We've introduced the ability to attach and manage Software Bill of Materials
(SBOMs) to software versions through Memfault. This new functionality will help
you streamline your software versioning process, keep track of everything that
goes into your version releases, and ensure that you can confidently meet
requirements associated with upcoming security regulations, like the EU Cyber
Resilience Act and US Cyber Trust Mark.
We support attaching a single SBOM file to a software version easily in the
Memfault web app by navigating to Versions tab > choose a Software Type that you
would like to attach your SBOM file to > click "Upload" under the SBOM column.
You can also download an existing SBOM from the same page.
We recommend uploading the SBOM via your CI build process for that specific
version and you can find more information about that in our
technical docs here, including how to integrate SBOMs
using our CLI.
We've introduced brand new filtering improvements within Memfault
Dashboards and Charts! These enhancements will help
you make better use of the data captured in Memfault and give you the ability to
manipulate your data to uncover deeper insights, identify trends, and highlight
relevant Metrics for your team.
Hardware version filtering: Dashboards can now also be filtered by
Hardware Version in combination with the Software Version and Cohort filters
Segment filtering (requires
Advanced Analytics Bundle):
Charts using the "by Population" rollup now also support the addition of
Metric conditions in combination with report type when creating segments
Let's say you want to see expected battery life data for sessions that had a
step count above 5000. Now you can add a condition that allows you to filter
the data based on that segment. For more information on segment filtering,
check out our
technical documentation here.
Create Issue Charts from Search: Create Issue/Trace Charts directly from
Issue search query to streamline reporting and root cause analysis.
Once you have selected all your filters on the Issues page, you can easily
create a Chart that already includes that filtering and add it to any
available Dashboards. For more information on segment filtering, check out our
technical documentation here.
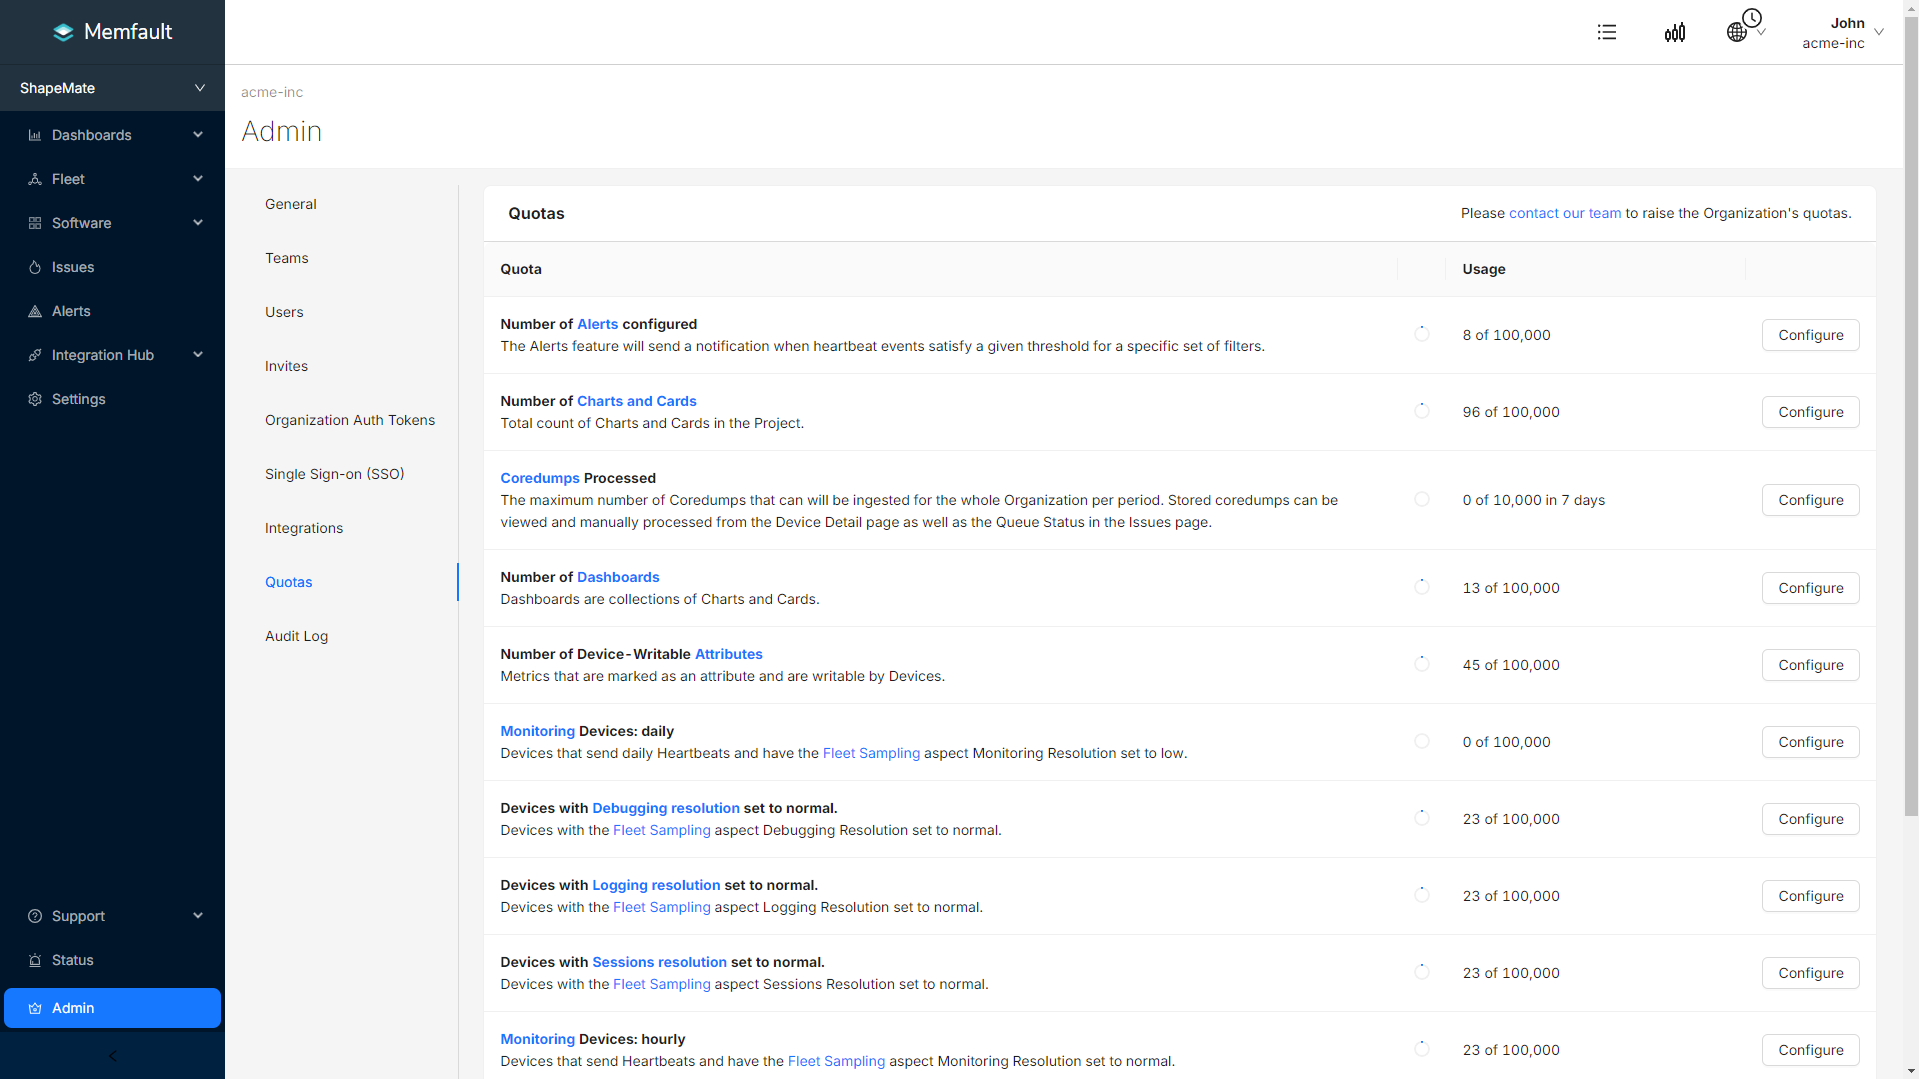
We've introduced features to simplify the management of your platform usage with
Project Quotas and increase visibility of OTA related events and actions with an
Audit Log.
Quota Management: Our new
Quota management
system gives you more control and visibility over how your contracted Quotas are
utilized. With this new functionality, Organization admins can manage the
distribution of Quotas across Projects. Notifications will be triggered when a
usage level has been crossed and restrictions can be put in place when limits
are reached.
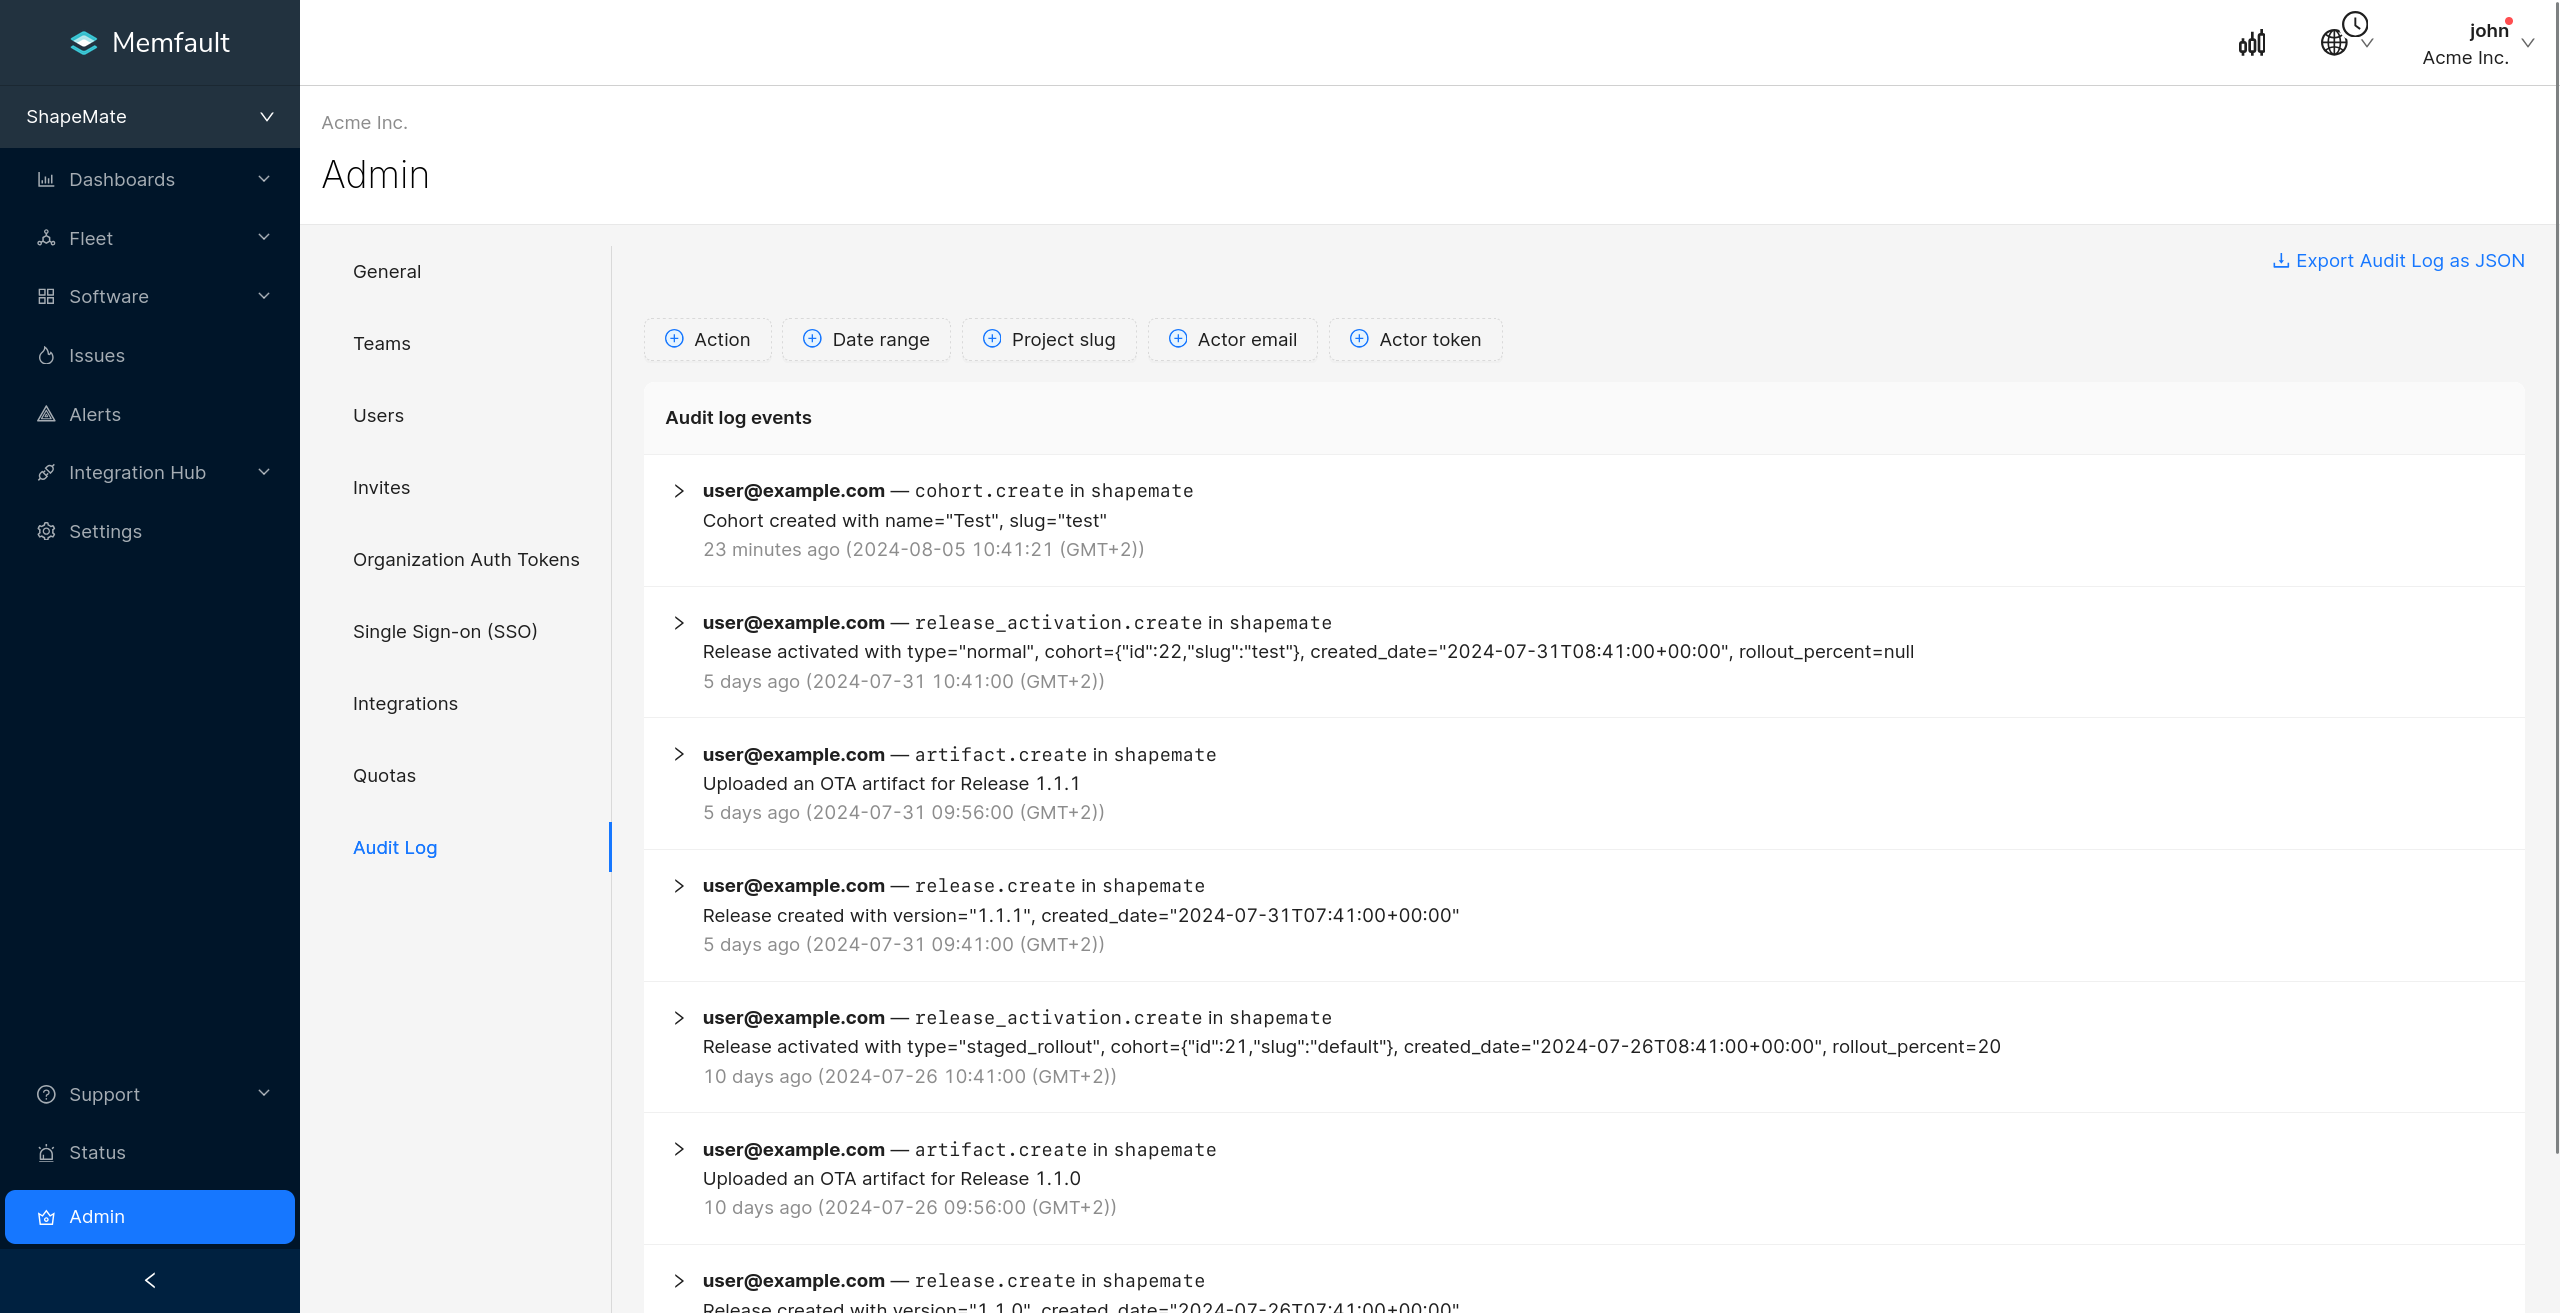
Audit Logs: The Audit Log is viewable by Organization admins and provides
visibility into all actions taken relating to the management and distribution of
OTA updates across your Project(s). As well as tracking actions, the Audit Log
also records the User performing each action and the time at which the action
was taken.
The Audit Log is currently only available to
customers on our Enterprise Plans and Users can find more information in our
technical documentation.
Product Analytics for Embedded Devices: Understand product usage, performance, and reliability like never before
We've introduced a brand new feature set within Memfault that helps you uncover
exactly how end-users interact with the devices you ship. Product Analytics
helps embedded teams and product owners understand product usage, performance,
and reliability like never before, giving them a clear view of feature and
function usage, adoption, and success rates.
With this new Product Analytics feature set comes the introduction of
Sessions. Sessions are a new
report type defined by the occurrence of an activity, allowing you to track
metrics in correlation with the usage of a specific feature or function on your
Device. It is up to the Memfault user to decide what they want to define as a
Session but when that Session is triggered, Memfault captures the length of that
Session and any important metrics you'd like to track specific to that activity.
This allows you to:
Track product engagement and adoption: Determine how newly launched
features are being used and adopted by your customers to refine and optimize
your product, driving higher satisfaction and retention.
Monitor and analyze feature usage patterns and behavior: Know when and how
your customers are using specific features to understand where you should be
focusing your efforts as you continue to develop your product.
Correlate feature usage with Device performance and reliability: Enhance
Memfault's existing functionality with the ability to answer really complex
questions about how your Devices are impacted by specific features.
Combining overall Device reliability data with product usage analytics will
unify embedded development teams, enabling them to make well-informed decisions
based on a comprehensive view of product health metrics.
We've introduced a new way to start collecting crash data and monitoring
firmware stability on your development devices in just minutes. With
Memfault Quickstart, firmware developers can
follow our simple, in-app guide to add Memfault to a real Device and start
reporting real Metric data related to connectivity, stability, and battery.
With Memfault Quickstart, you can experience key Memfault features with your
unique Device. After completing the guided integration, you can immediately:
Analyze a Coredump collected from your Device in our easy-to-use UI
Inspect activity happening on your Device on our Device Timeline
See what your data would look like in our charts and dashboards
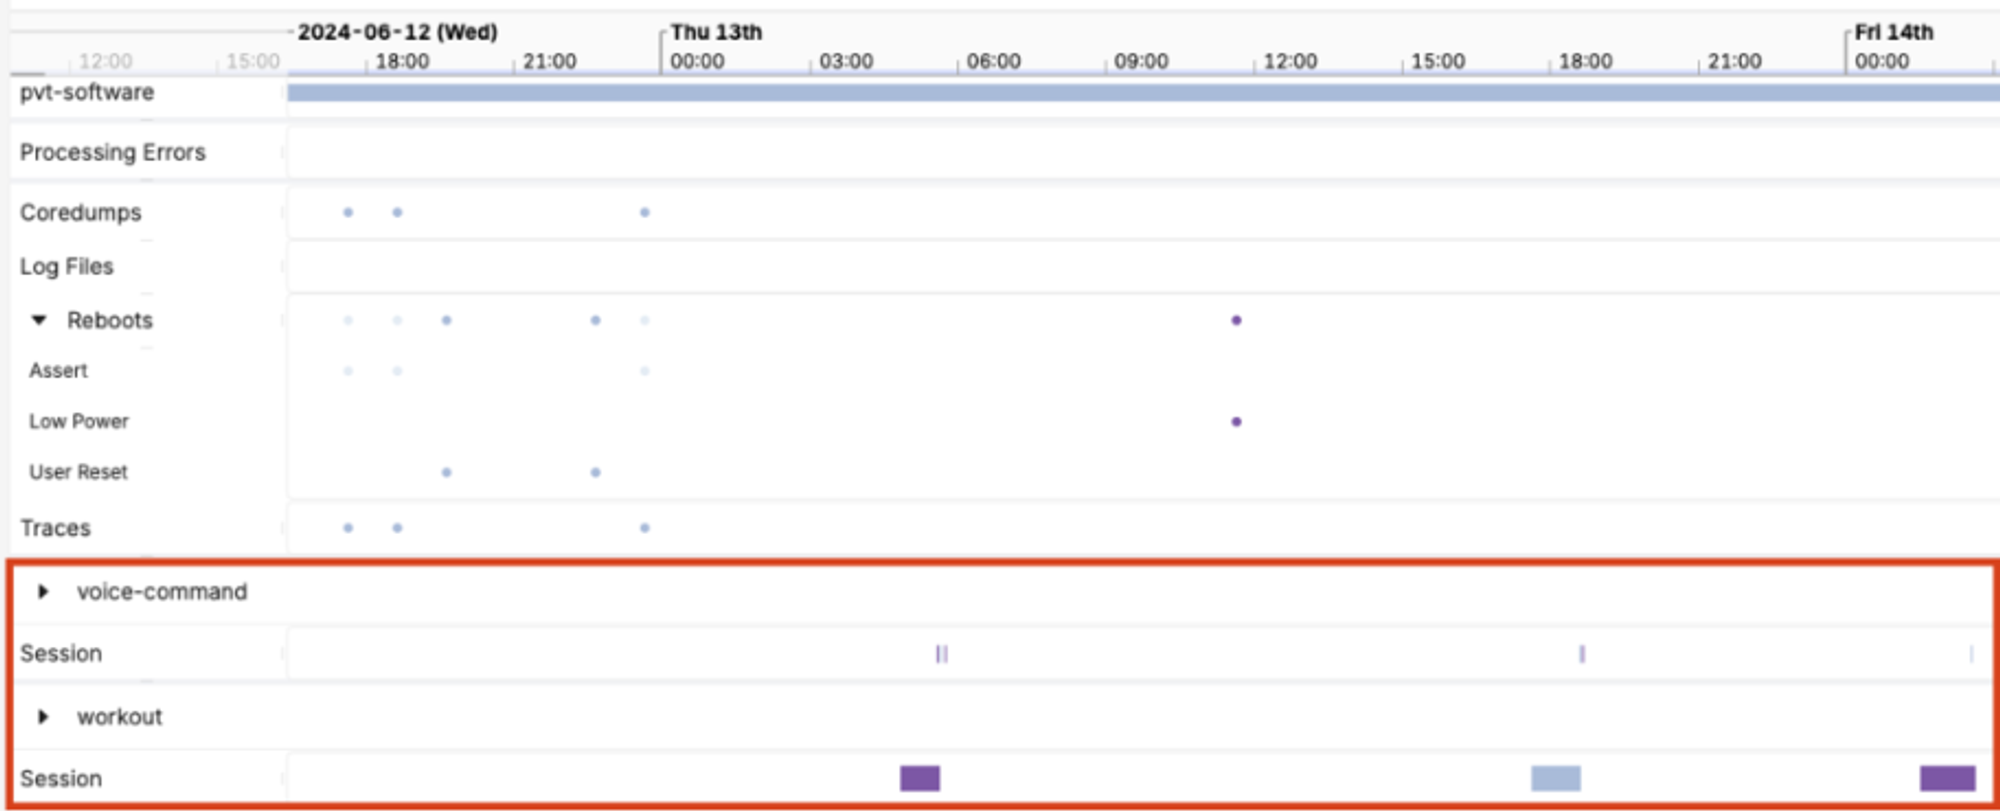
Sessions on Device Timeline: Investigate Feature and Function Usage
Users can now view Sessions - a
new report type to capture Device activity - on their Device Timeline. Sessions
are reported when an associated feature or function is active, and they will
last as long as that feature or function is active. Memfault users can define
custom sessions using the Memfault SDK to track the relevant activity on their
devices and now have the ability to see when sessions occurred and whether there
are any Device reliability issues that align with activity such as Traces,
Coredumps collected, or unexpected Reboot Events.
Being able to track Sessions allows users to analyze specific metrics associated
with that session. For example, seeing how much your Device's battery drops
during a "workout" session on a wearable device or understanding how often a
credit card payment fails to process during a "checkout" session on a POS
Device. You can read more about all of our
Device Vitals functionality in
Memfault's technical documentation.
Learn more about capturing Metric Sessions for each SDK:
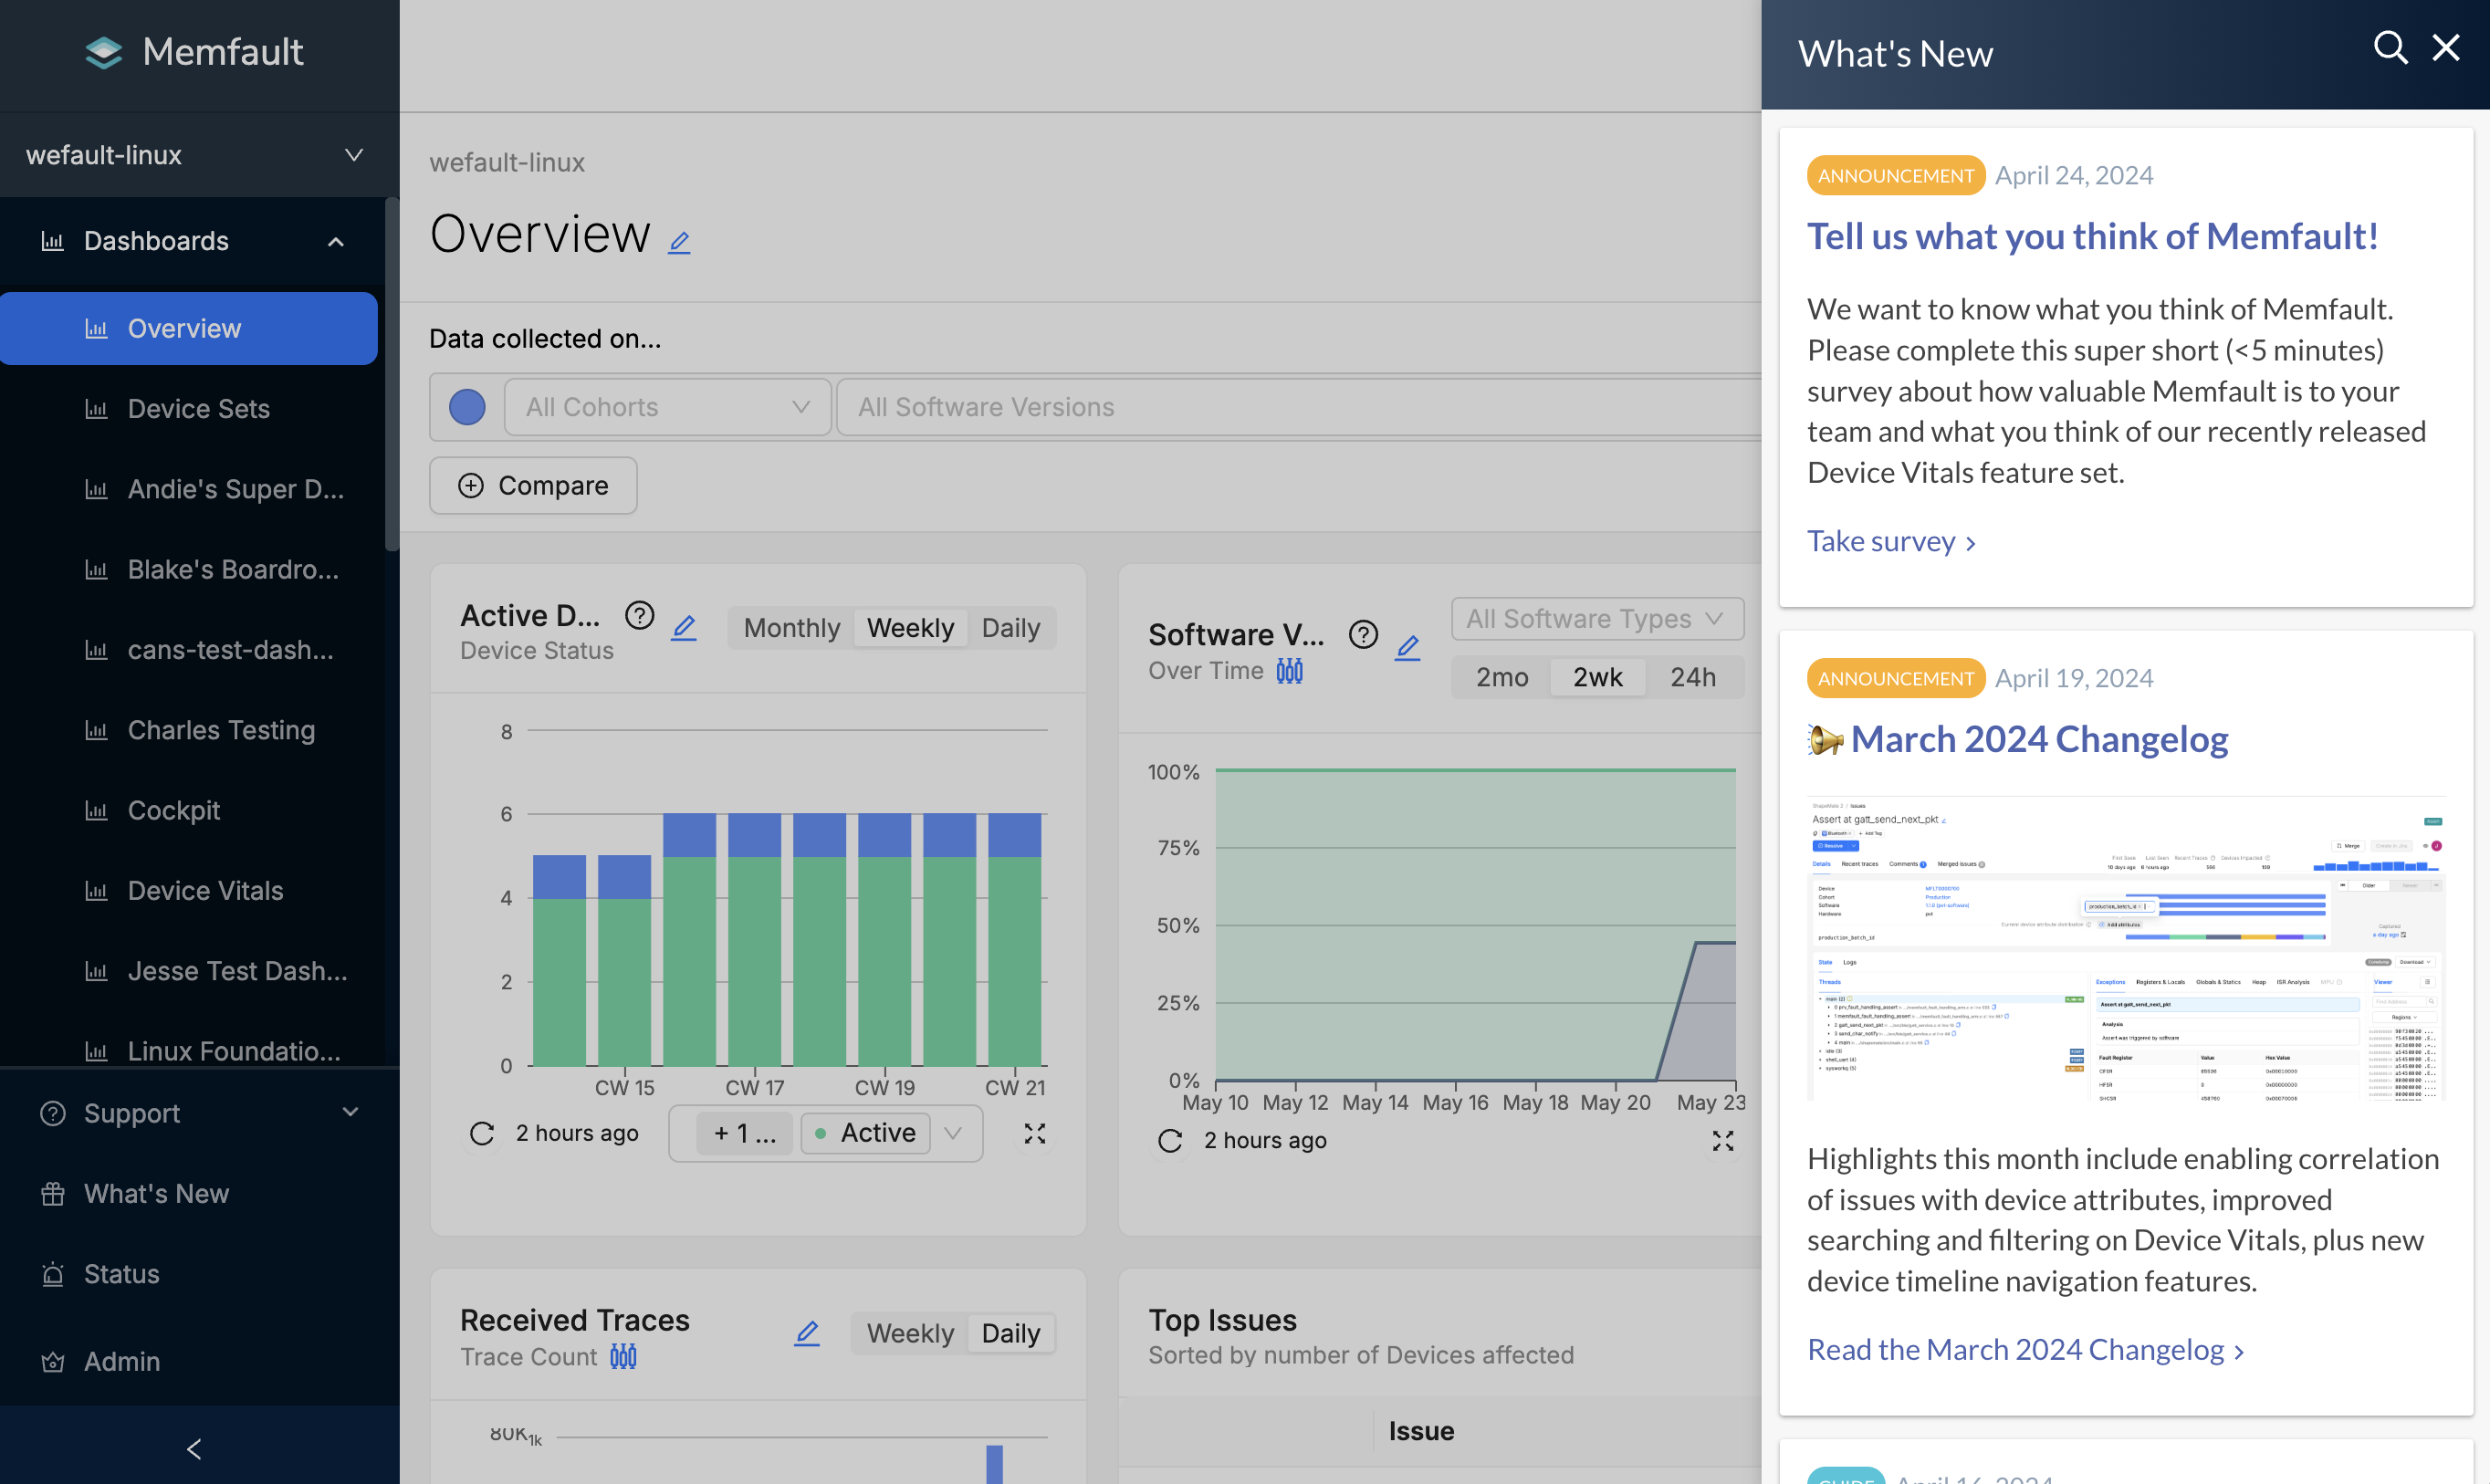
We've introduced a "What's New" announcements tool within the Memfault web
application to help users stay informed about the latest features without
waiting for the monthly changelog. This tool notifies users about new features,
guides, system updates, and user surveys as soon as they become available.
We continuously improve our services based on your feedback, and this real-time
feed will help us showcase the frequent updates we make to our services so users
can take advantage of them right away.
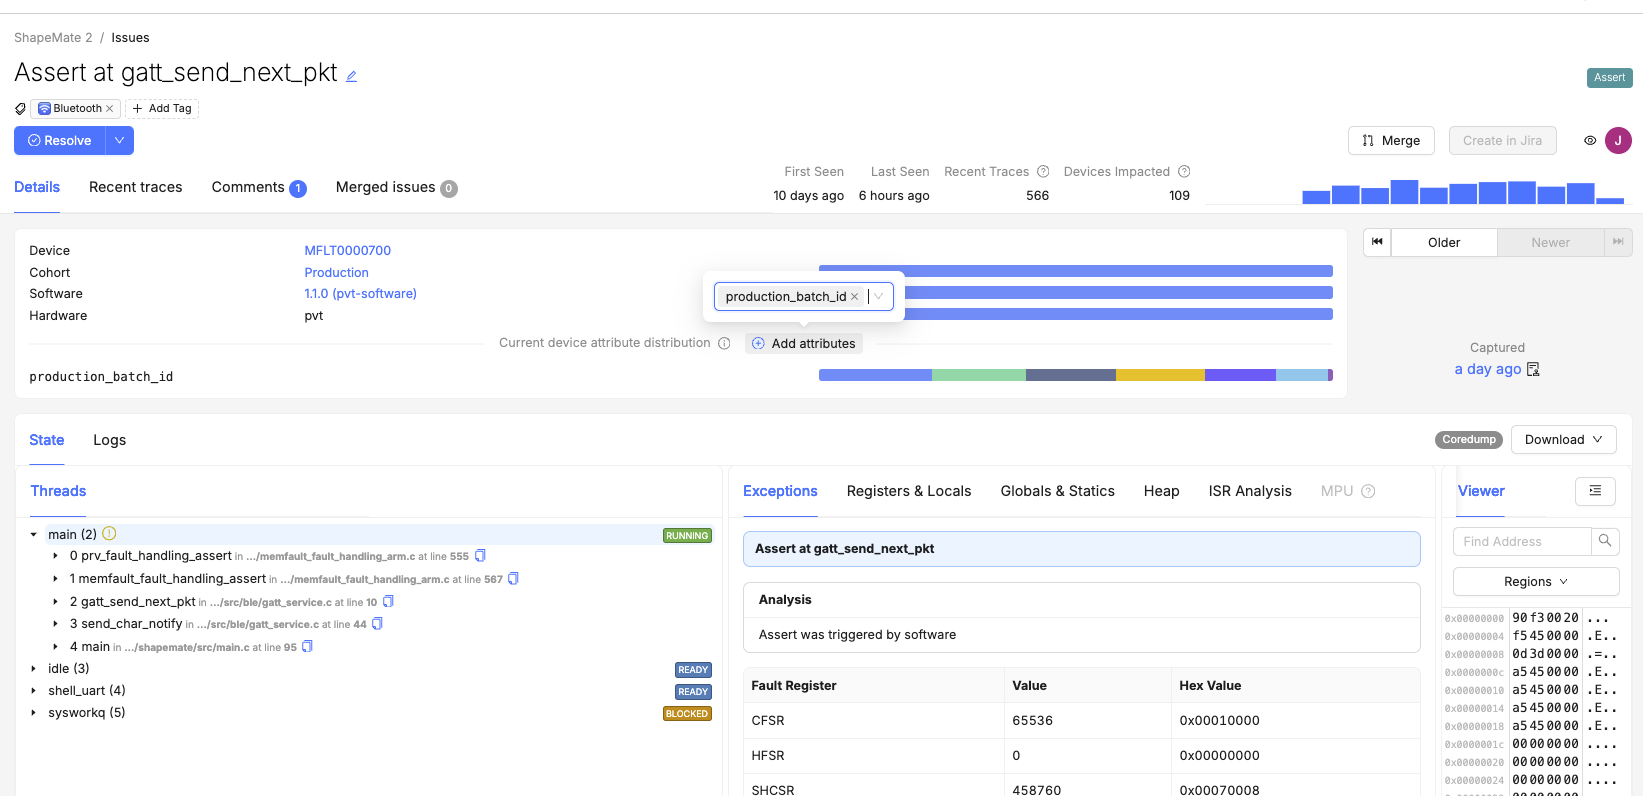
Users can now view the distribution of issues by device attributes in the Issue
view. Within the Issue view users can now select an attribute from the drop down
and see the distribution of that specific Issue by the attribute selected in the
same way as you can see distribution of Issue by software version or hardware
type. This is an extremely powerful tool to identify correlations between issues
occurring across your Fleet and things like production batch or device tree
information such as chip type.
Currently correlations are best used for attributes that are fixed for the life
of the device because the correlation is based on the most recently reported
state of the attribute on the device and not the attribute at the time the Issue
occurred. This means it's good for correlating with things like production
batch, and not good for correlating with things like state of charge. For more
information on Issue attribute correlation please read our
technical documentation.
We have made a number of enhancements to our Device Vitals feature set designed
to make it easier to go from top level insight to device level investigation.
Firstly, we have introduced a set of templated dashboards for each Device Vital
that can be selected when creating a new dashboard and will pre-populate with
our recommended chart and card types.
We have also introduced two ways to get to a list of devices based on their
performance on a specific Device Vital either by drilling down from a Device
Vitals percentiles chart, or using Device Vital readings as a filter in device
search.
We believe that some combination of Device Vitals should be central to the way
teams measure the performance of devices and making it easier to get the
insights and act on them unlocks more value, more easily. You can read more
about all of our Device Vitals functionality in Memfault's
technical documentation.
We made several enhancements and improvements to the navigation experience
within device timeline based on user feedback. The improvements include adding a
time interval selection (e.g. 1 day or week), zoom and pan buttons.
Device timeline is central to the value Memfault provides, giving you the
complete context of what's happening on your devices. These improvements make it
easier to isolate specific points of interest within the device timeline and
move through the timeline more easily.
Device Vitals: Built-in metrics and out-of-the-box visualizations for stability, battery life and connectivity
With our newly released Device Vitals
feature set we have added a streamlined and standardized way to start monitoring
critical health and performance data from your devices. The three Device Vitals,
Stability, Battery Life and Connectivity, are automatically computed by Memfault
on the cloud side based on a set of metrics collected by the SDK. The metrics
required for the computation are standardized across all platforms and are now
built-in to all SDK's from
Android 4.13,
MCU 1.5.0,
and
Linux 1.9.0.
We have also added a set of "out-of-the-box" dashboards for monitoring each
vital and new charts and cards to add to your own custom dashboards. The
combination of built-in metrics and out-of-the-box visualizations provides both
existing and new Memfault customers an easy way to start monitoring some of the
most important health and performance indicators across your Fleet. Read about
how to configure the built-in metrics and use the new visualizations in our
technical documentation.
Jira Integration: Connect and automatically sync Memfault Issues with tickets in Jira
Our new Jira integration adds the ability to sync key information from Memfault
Issues with Jira Issues. Users can now create Jira Issues from an Issue in
Memfault and link Memfault Issues to existing Jira Issues from within Memfault.
Once linked, key data is automatically and continuously sync'd with the Jira
Issue including:
Memfault Issue name and Issue status
Trace count and impacted device count
First seen and last seen dates
The Issue status in Memfault (e.g. Open, Resolved, Reopened) will also be
automatically updated based on the Jira Issue status (e.g. Done, Unresolved).
This new integration should make it much easier to work issues identified by
Memfault into your existing development processes in Jira. You can read more
about the integration and how to get set-up in our
technical documentation.
Get all the data you need in one place: Add any chart to any dashboard
It is now possible to add any chart, previously available across any part of
Memfault, into your custom dashboards. All of the charts and cards previously
only available in either the Overview or Device Sets dashboards can now be added
to any dashboard. The three pre-existing dashboards,
Overview,
Metrics
and
Device Sets
have all been consolidated under the Dashboards section of the side nav and can
now be renamed and customized.
This series of changes means that users can get maximum value from all data
sources in Memfault in their custom dashboards.
The list of newly available charts and cards includes:
Active devices
Issue charts
Software Versions
Device sets
Active devices
Device incident alerts
Combine all these data sources into a single dashboard to maximize the relevance
and usefulness of each dashboard and eliminate the need to jump between
dashboards to get the insights you need. You can read more about the changes in
Memfault's Dashboards documentation.
Improved Processing Log: More data, better discoverability, more tools
The Processing Log has been updated to cover more processing-related activity,
improve discoverability and make it easier to take action. The update adds
multiple new filtering options including Hardware Version, software version and
log level (e.g. Errors or Info). It also adds multiple new ways to take action
on the information, including shareable links for each log, a download of the
log for further investigation, and a quick link to upload missing symbol files.
The introduction of the Processing Log will make the initial integration much
easier, providing instant feedback for a developer encountering unexpected
behavior during integration. For customers already using Memfault this will
provide much greater visibility of project related data processing and errors
that might impacting the completeness of their data. Users can read more about
the
Processing Log in Memfault's documentation.
Users can now add two new chart types into their custom dashboards - Reboots and
"Crashes per 10k hours". The Reboots chart gives visibility into the breakdown
of different reboot reasons across each data set. The "Crashes per 10K hours"
provides a calculation of the average number of crashes (unexpected reboots)
across a minimum of 10,000 operating hours.
These new charts give teams a way to track the stability of their devices and
measure and compare software quality across distinct populations. Teams will now
be able to definitively measure software quality improvements or regressions
between versions and even compare software stability across product lines. The
Reboot chart is available to all users but the Crashes per 10k hours chart is
currently only available to MCU customers. You can read more about these
new charts in Memfault's documentation.
Users can now create custom dashboards and manage the layout of content within
these new dashboards. This change makes dashboards much more flexible, able to
cope with a wider variety of use cases such as dashboards for specific teams,
software versions, Cohorts, etc. Users can also re-arrange the content within
the dashboard using drag, drop and resize functionality.
Create and manage dashboards in the
All Dashboards
tab within the "Dashboards" sub-menu and customize chart layouts using the
"Layout mode" toggle available within each dashboard. Find out more about
creating custom dashboards
and using layout mode in Memfault's
documentation.
Users can now add tags to issues within Memfault and use the tags to filter
issue searches and build issue charts. This change facilitates more
sophisticated issue triaging, grouping and categorization within Memfault. For
example, tags could be used to indicate issue priority and also to associate
groups of related but separate issues together.
A user can add tags in the issue view, each issue can carry multiple tags and
tags can be added or removed at any time.
Users can now view a detailed listing of processing errors in the
Processing Log
under the "Integration Hub" sub-menu. The Processing Log contains details on
errors such as missing symbol files on coredump upload, MAR file processing
errors and instances of device data not being accepted by the server. This
change adds a huge amount of additional visibility into errors related to
processing of device data in Memfault.
These processing errors are now also reported on the device timeline adding
another layer of debugging information for devices. Users can read more about
the Processing Log in Memfault's documentation.