August 2025
Improved Linux Support
We've introduced Python crash support and custom trace capture for Linux devices. These updates close observability gaps where Python apps mix native code or where failures don't trigger kernel crashes. With full Python stack traces and structured custom traces integrated directly into Memfault Issues, you can now capture a broader range of problems, see them grouped fleet-wide, and get the same alerts and contextual data you rely on for other issues.
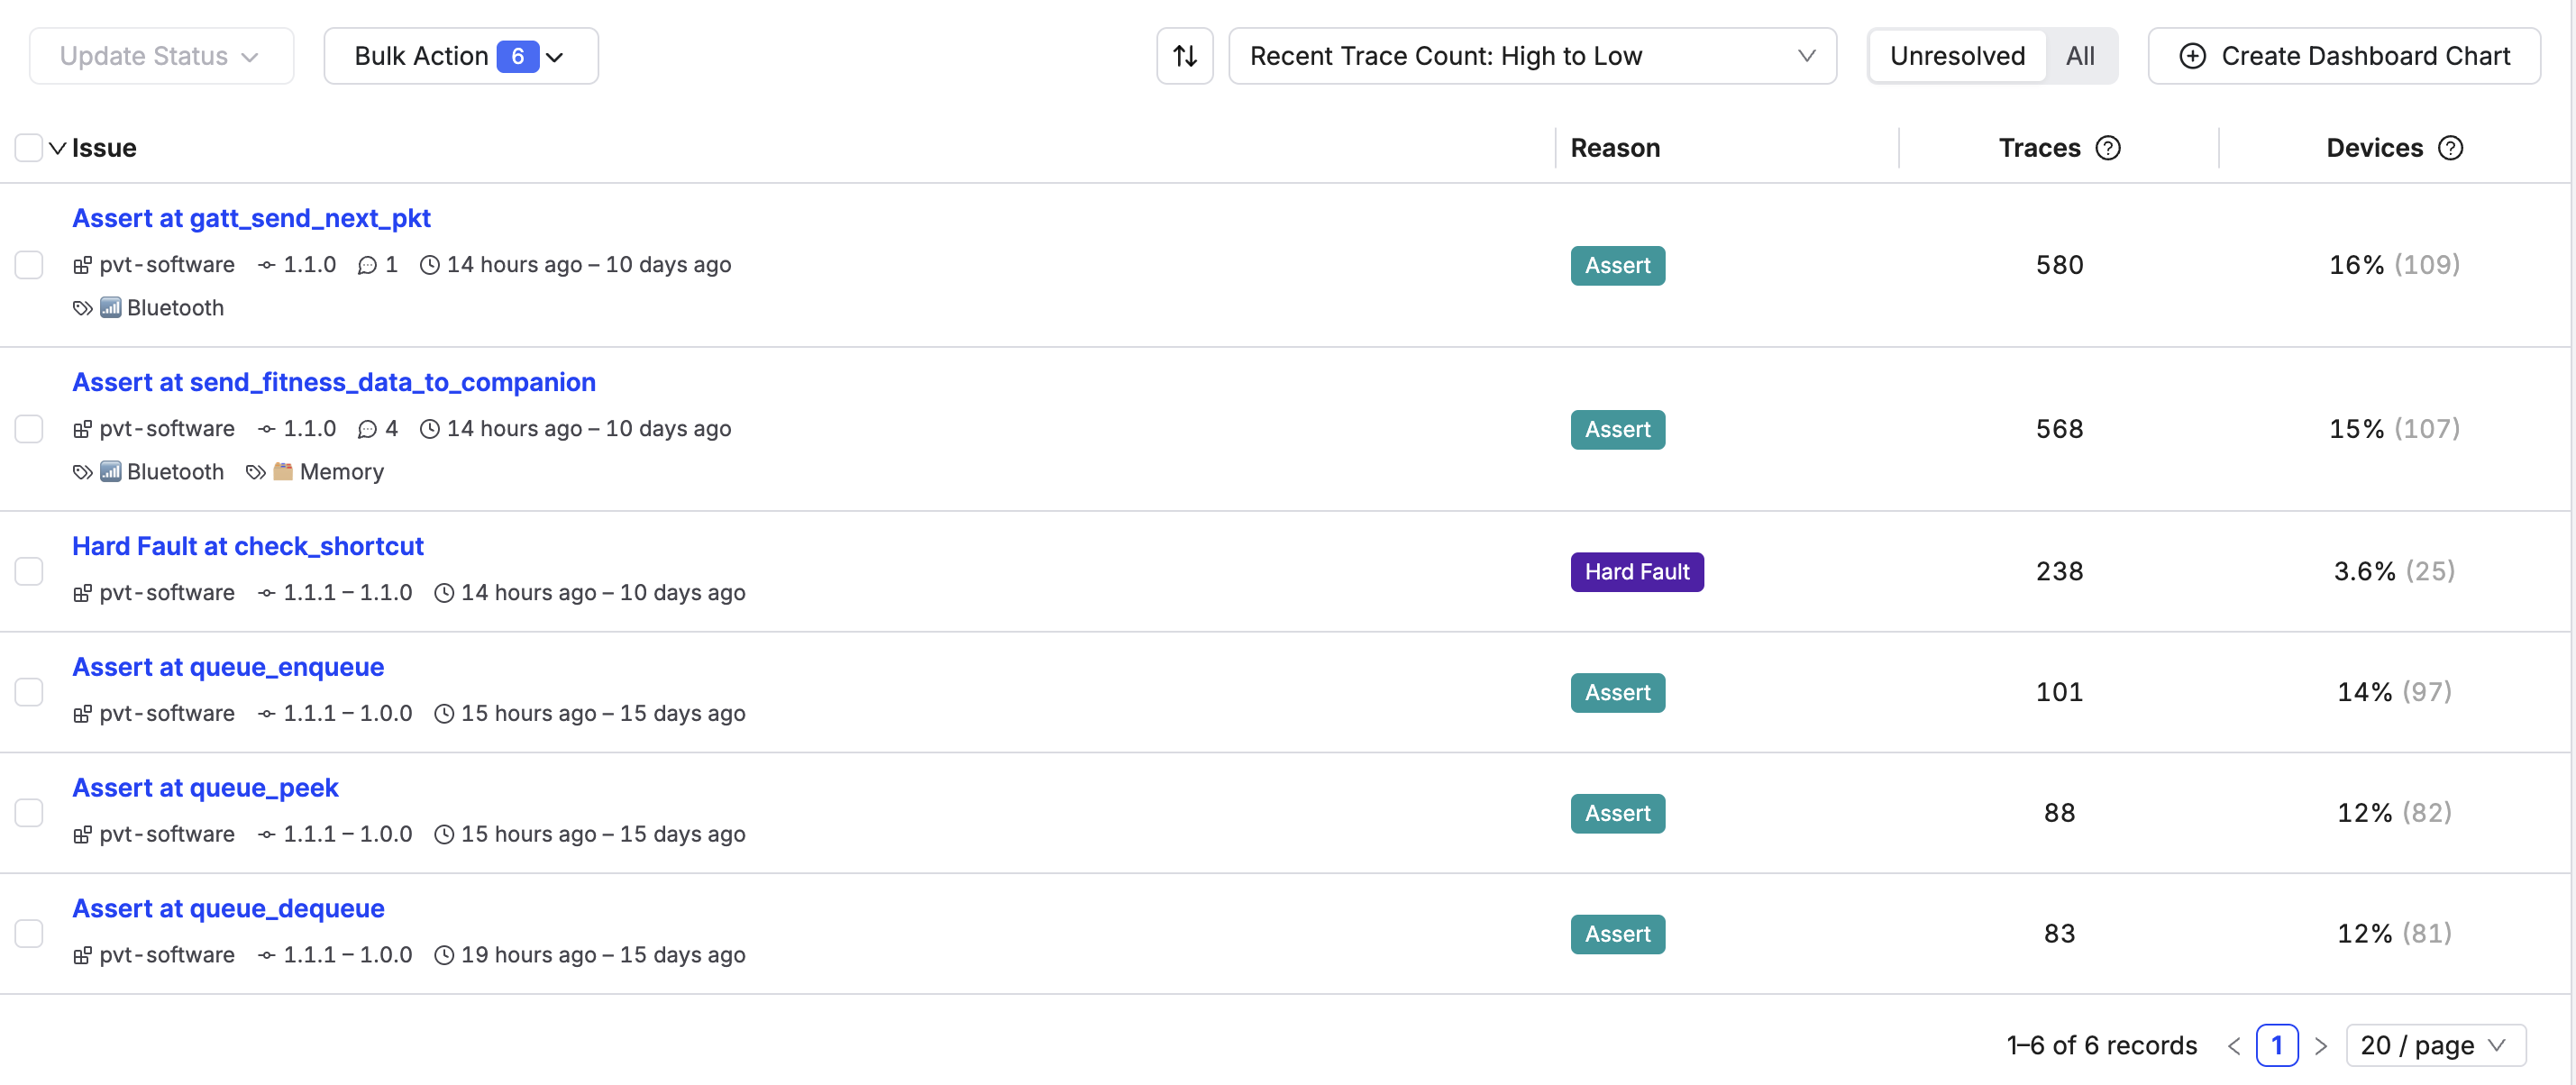
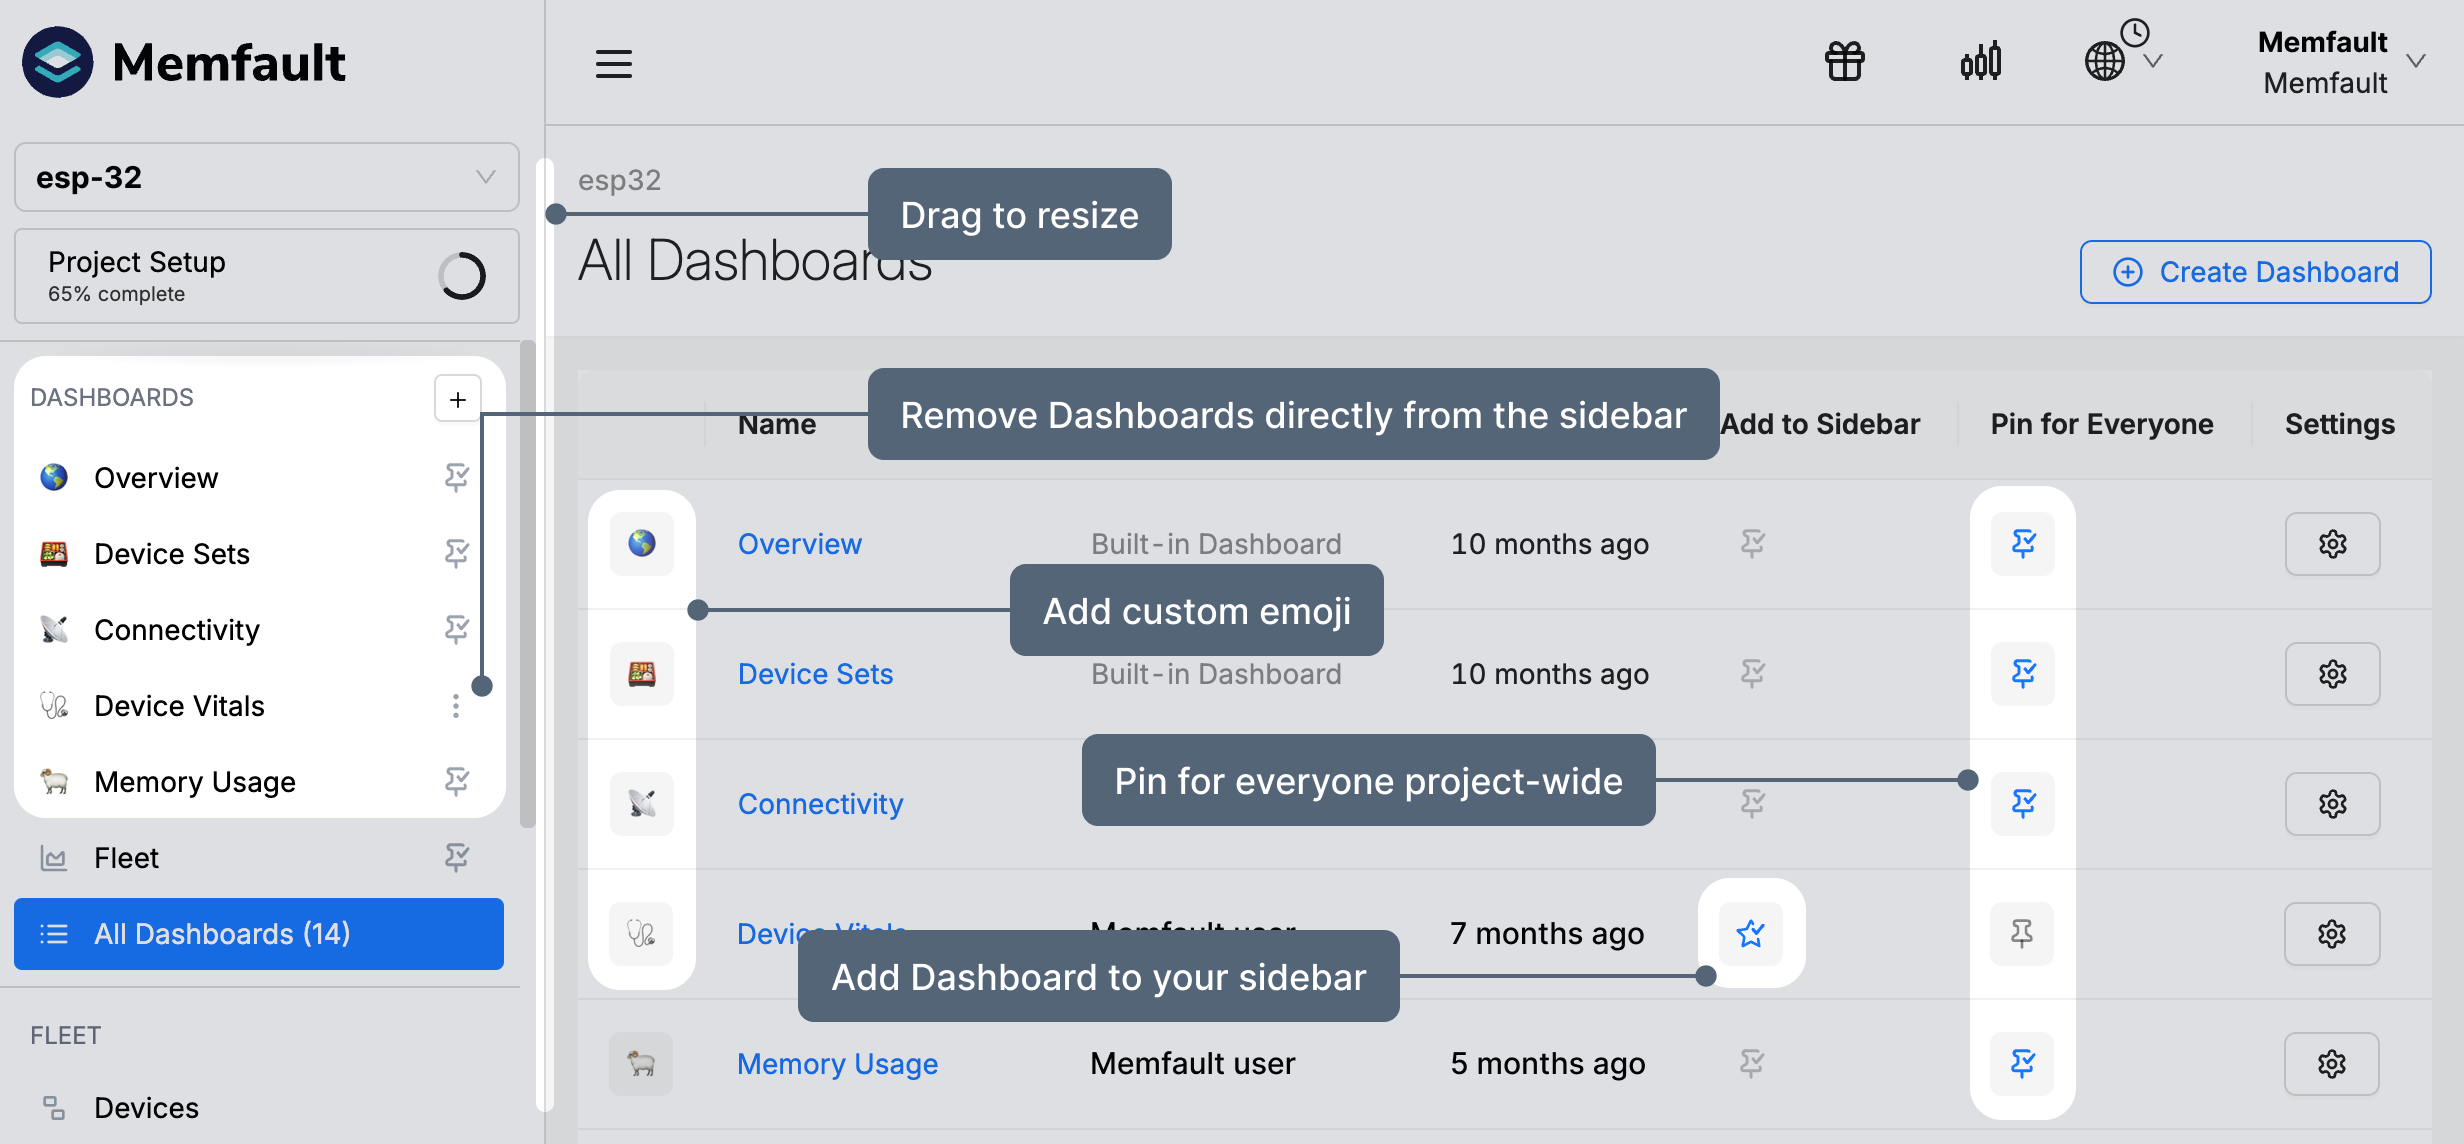
Saved Issue Search and Summaries
Managing issues across large and fragmented fleets just got much easier. You can now save filtered issue searches, pin your favorites to the sidebar for fast access, and even subscribe to scheduled email summaries that notify you of changes in the issues that matter most. This ensures your team gets higher-signal alerts without the noise.