October 2023
Export lists of Devices as a CSV
Users can now bulk export lists of Devices and associated information as a CSV file. Use filters as normal to define the desired list of Devices and then export that list as a CSV. Once the CSV is generated it will be emailed to the user. This makes it easy to share information on specific groups of Devices to teams in the organization outside of Memfault for the purpose of further processing in external tools or scripts for logistics, reporting, etc.
By default on export the CSV will include basic information about the Device such as serial number, Cohort, software and Hardware Version etc. and a user can also choose to include Device Attributes in the export if required.
See data in Metric charts as soon as it's received
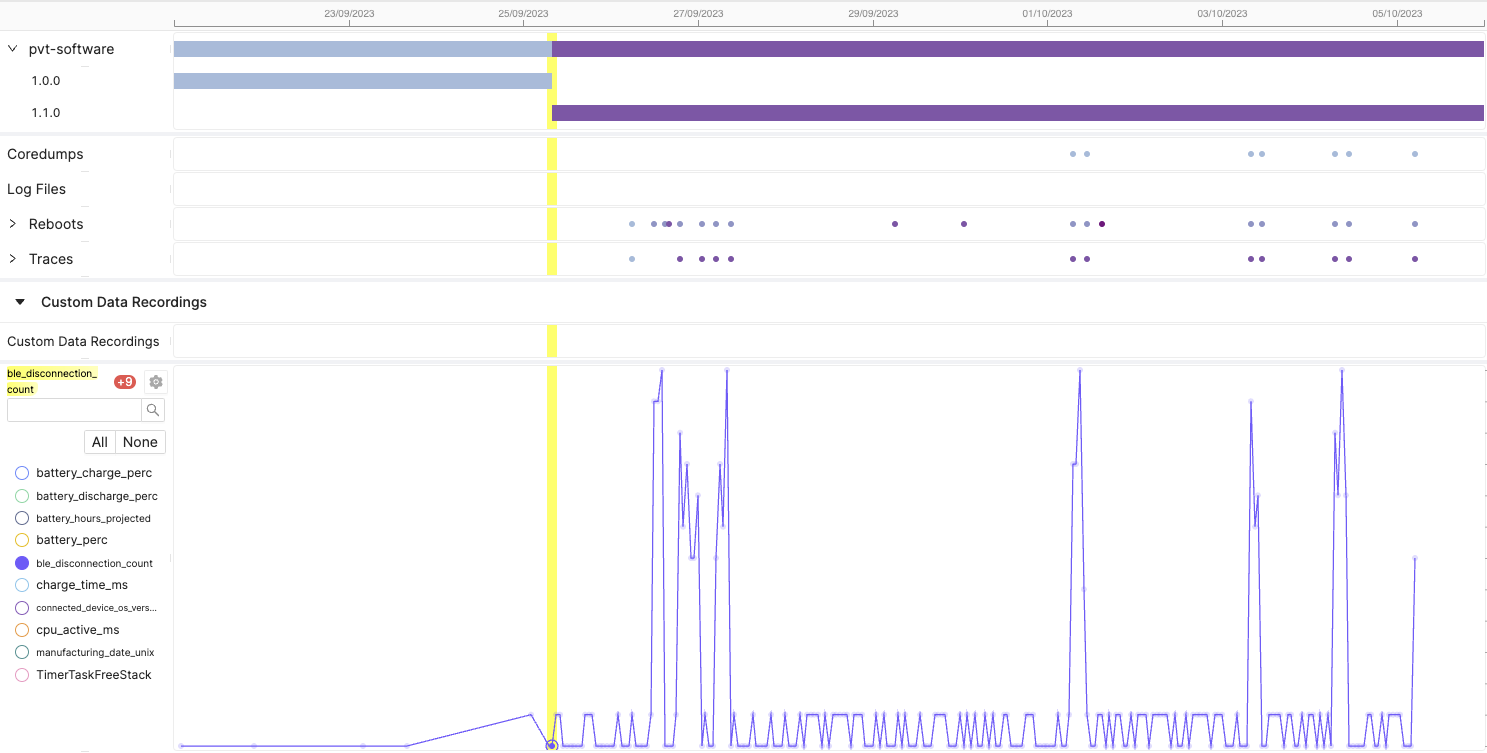
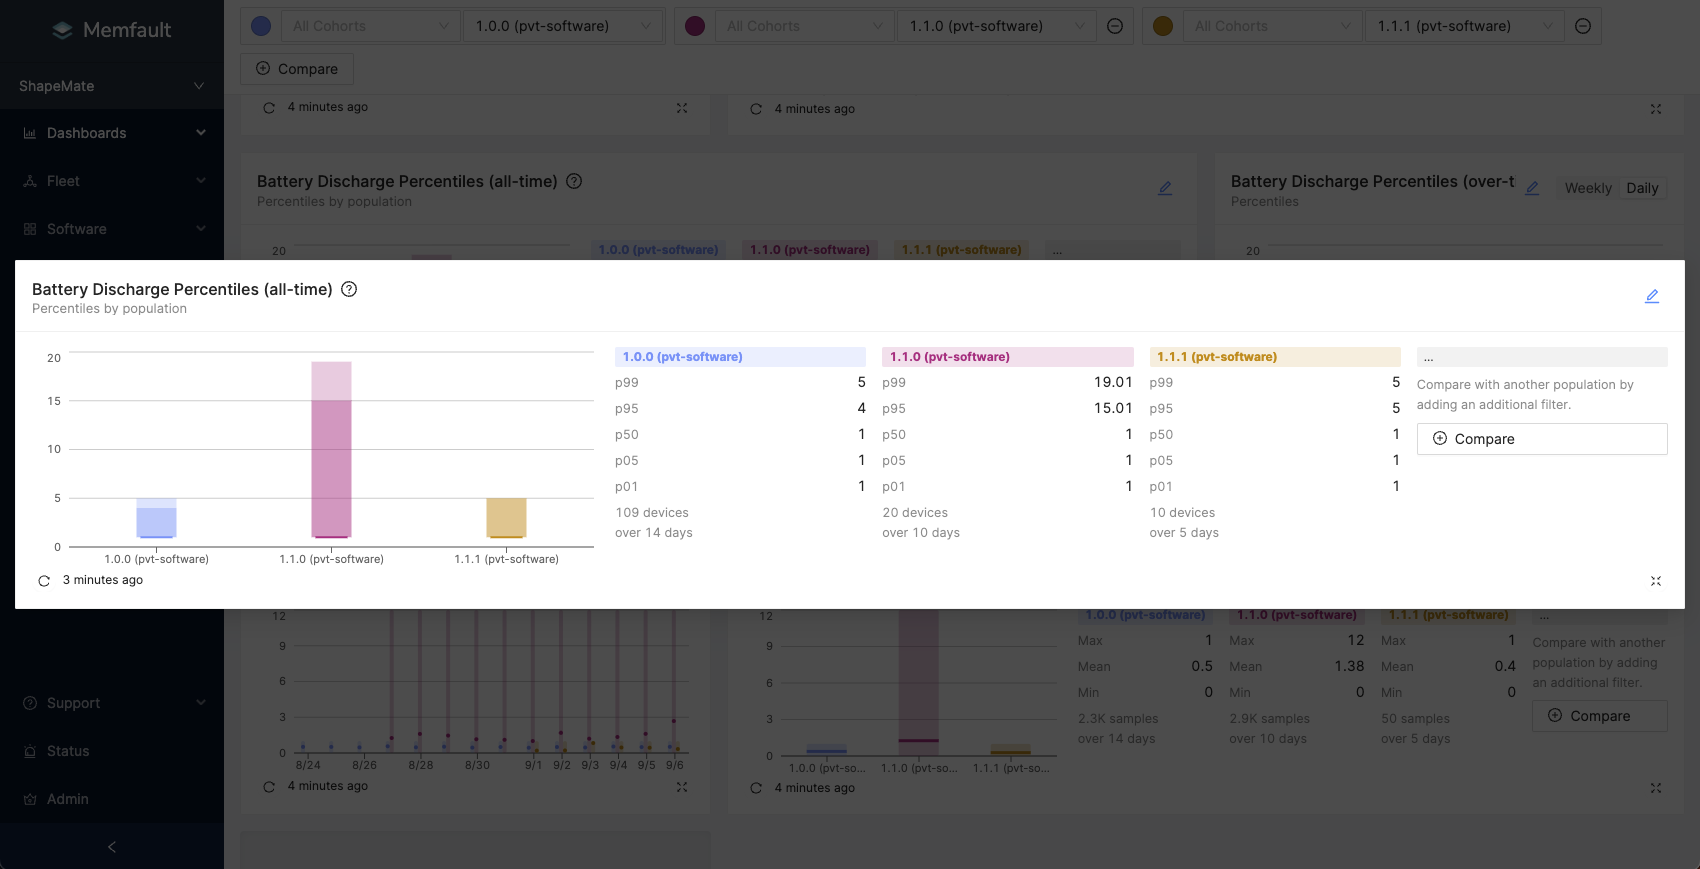
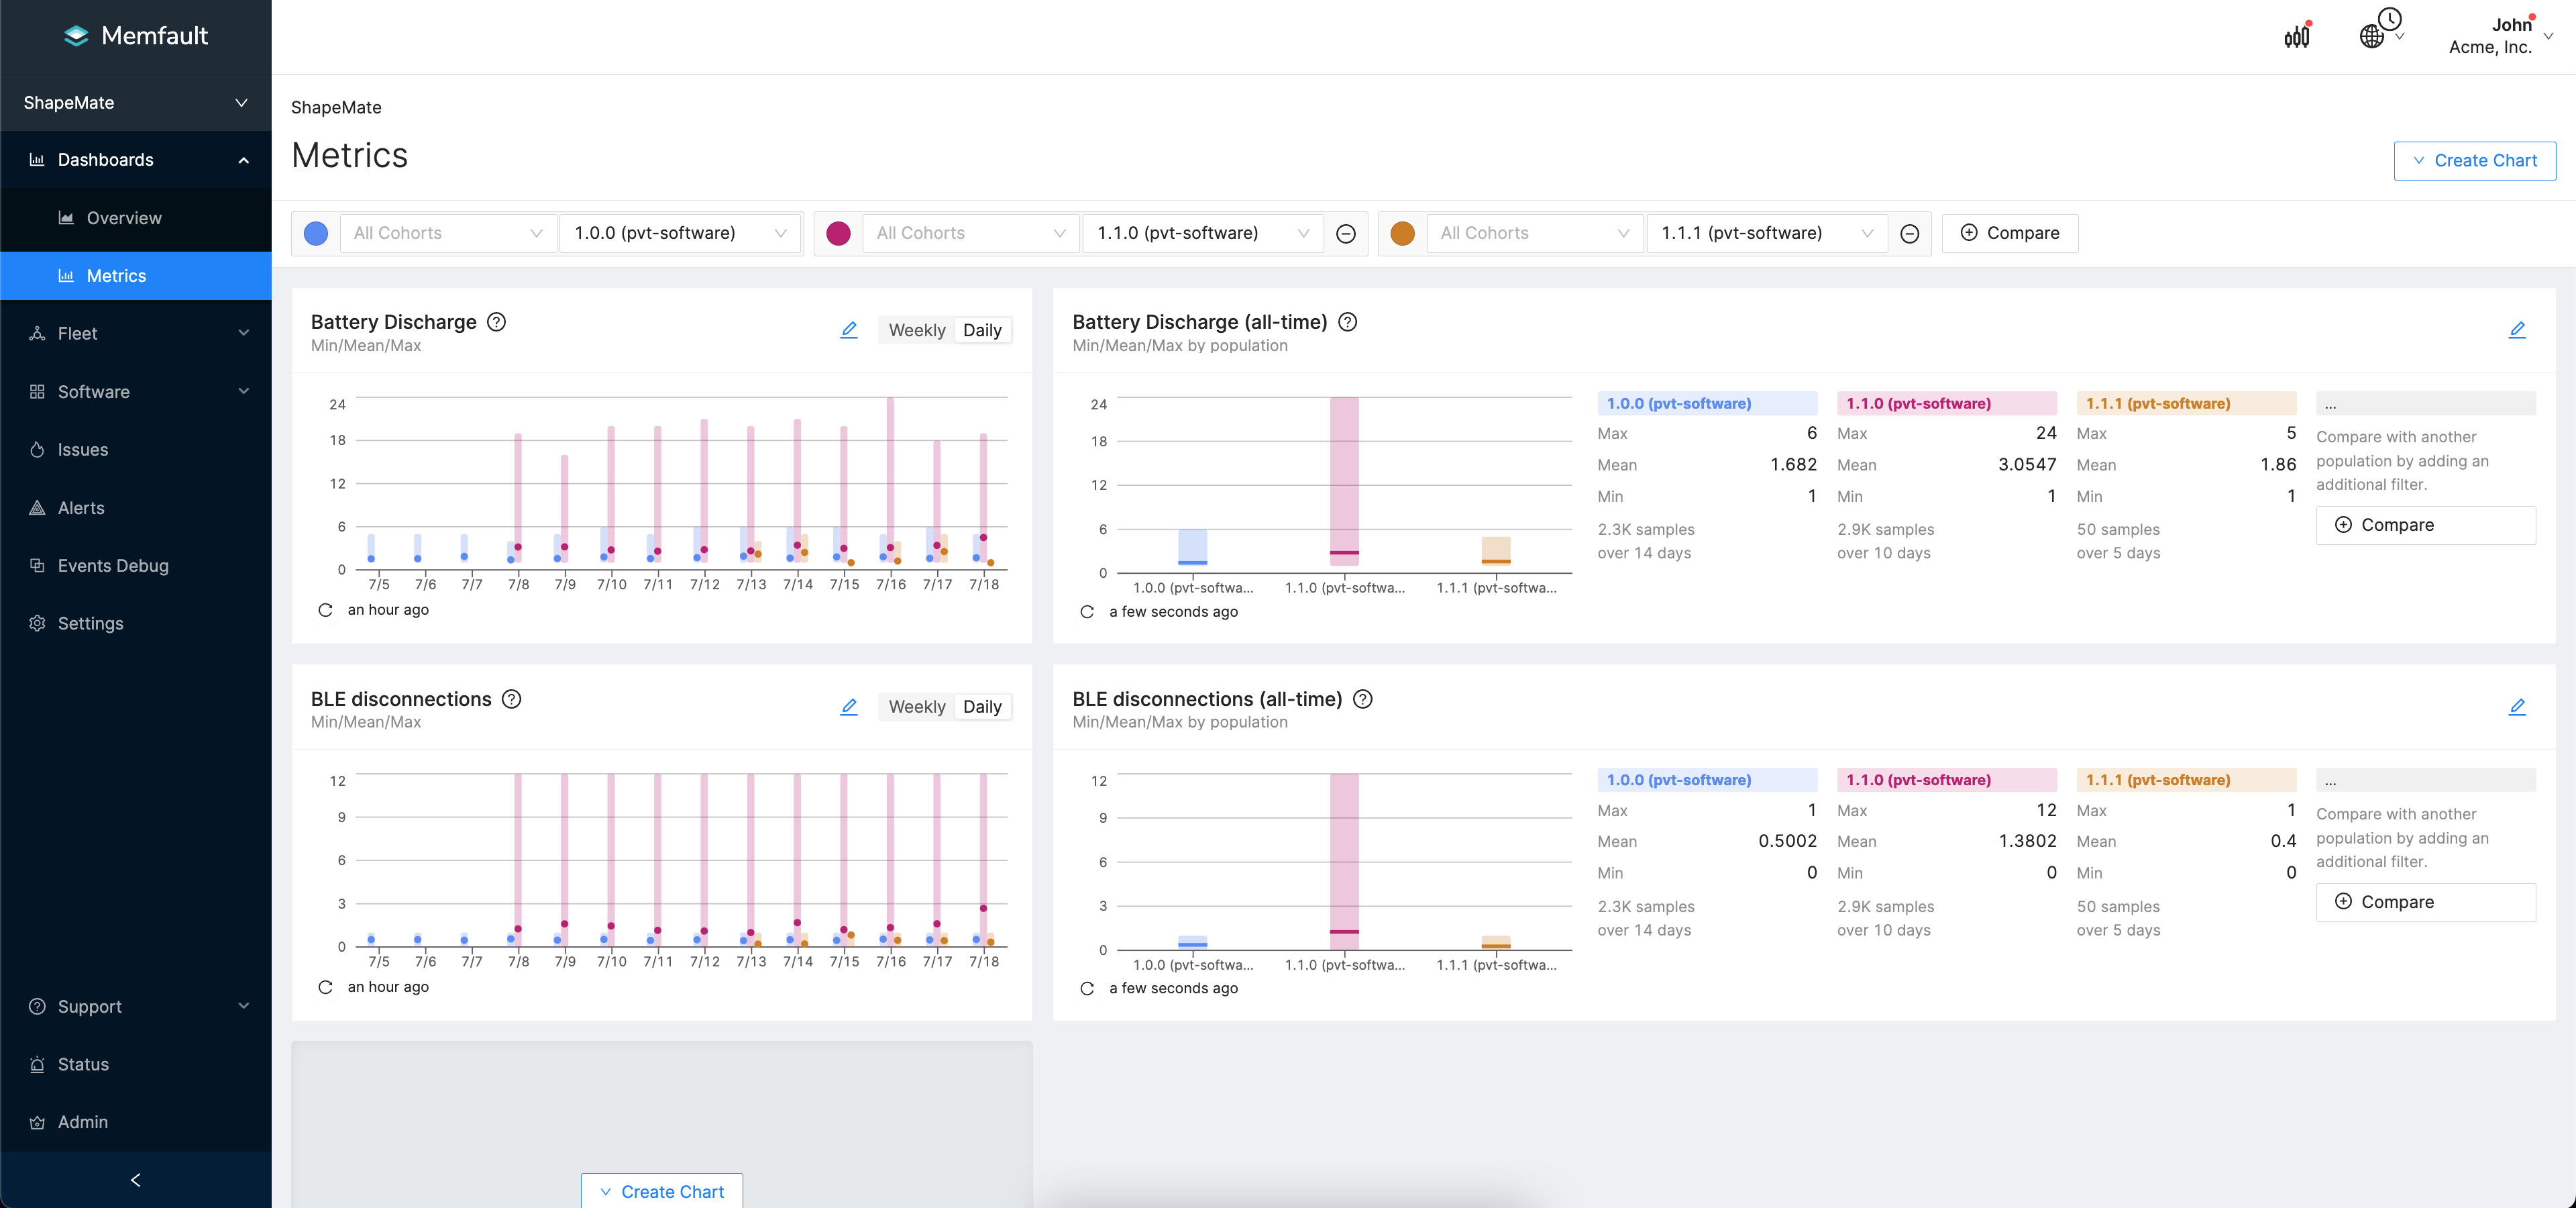
Data in Metric charts is now available in "real-time" once received. Previously, data in Metric charts only updated once the day in UTC completes and this would add some delay in the insights the Metric charts were able to provide. Now the Metric data collected from devices is visible in Metric charts as soon as it is received by Memfault.

Memfault Metric charts now display data in "real-time"
This enhancement will allow users to react quicker to undesirable changes in behavior and provide closer to real-time information during significant events like software version roll-outs. Currently, this change is only applicable to Metric charts and does not apply to other chart types (e.g. Issues charts, Device set charts, etc).