December 2024
New Trace and Issue Summary Charts
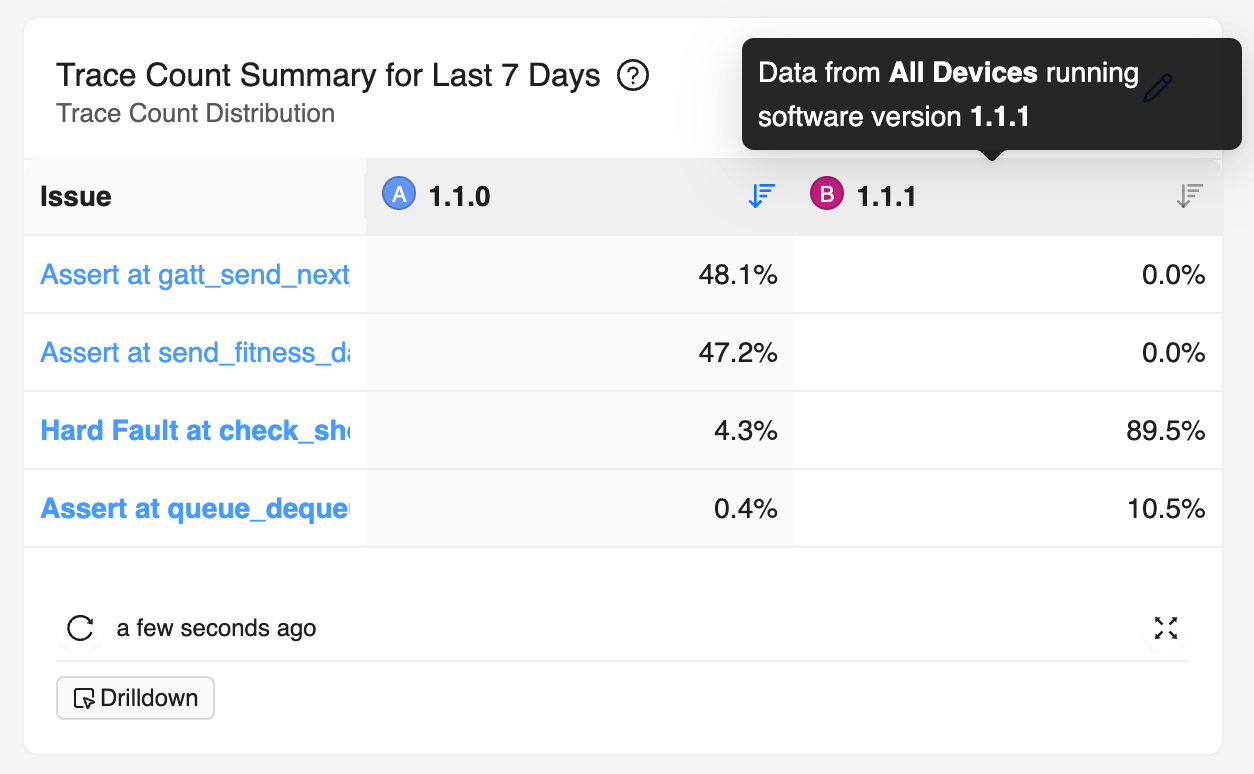
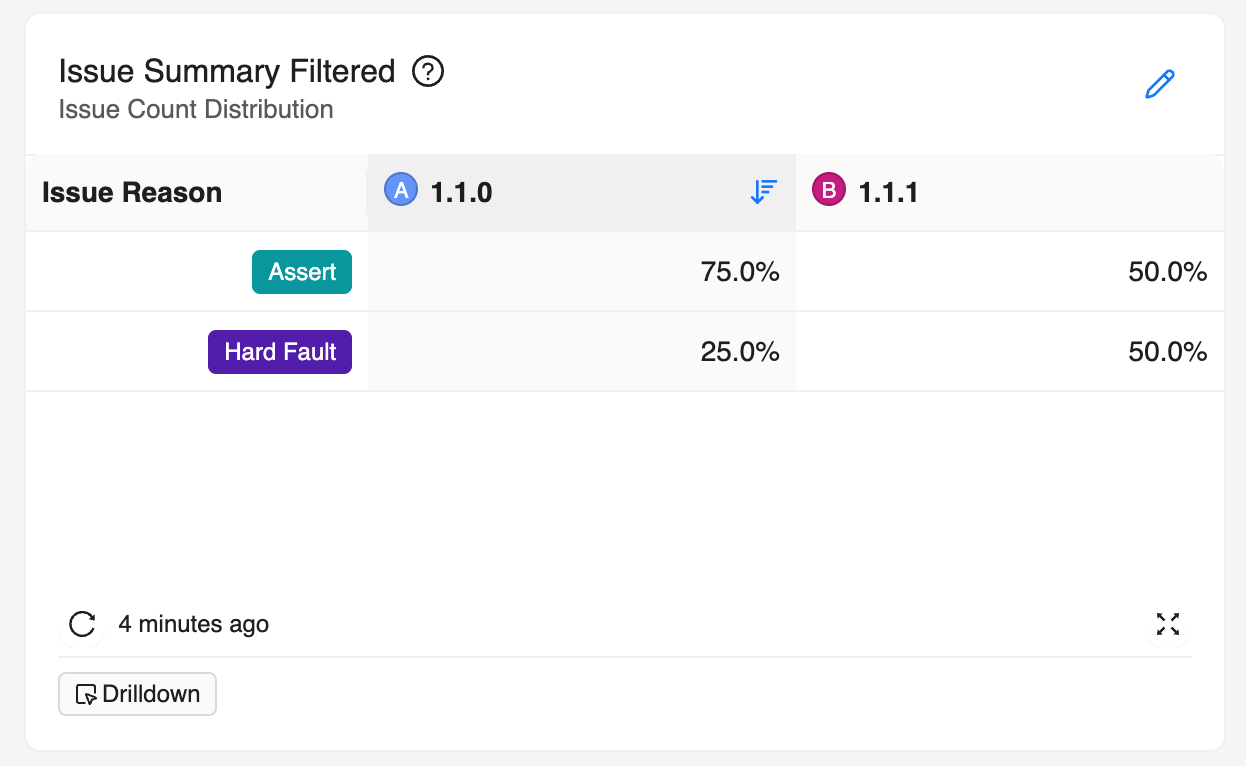
We have introduced two new Issue Charts for looking at Trace or Issue count distributions between different populations of devices. These Charts allow grouping by Issue ID or Issue Reason and support comparisons of different data sets with Dashboard filters.
General
- Dashboard chart descriptions now support Markdown formatting, enhancing readability and presentation in tooltips.
- Introduced new Trace and Issue Summary Charts, enabling users to compare Trace or Issue count distributions across different groups, helping identify pressing Issues over a certain time period.
- Added a new setting that allows users to hide empty swimlanes on the Timeline for a cleaner view.
- Added support for using
== nullin report conditions, enabling customers to filter reports that do not contain specific metrics. - Introduced a plugin system allowing customers to deploy an application to render proprietary Custom Data Recordings (CDRs) on the Device Timeline, enhancing data visualization and debugging capabilities.
Linux
Released SDK Version 1.16.0
This release includes two major new features:
- A new Coredump capture mode to process the Coredumps directly on Device resulting in even smaller crash Signature and guaranteeing that no user data is uploaded.
- High Resolution Telemetry for Linux, storing every single datapoint and enabling second-by-second data from Linux devices, for even deeper debugging capability.
Added
- Built-in wireless metric capture - wireless interfaces being monitored by the
metrics.system_metric_collection.network_interfacesconfiguration will now have RSSI captured alongside the existing network metrics - Added a
boottime_duration_msto Metric Reports that indicates the duration of the report independent of whether the CPU was running or not. This is intended to be used for debugging purposes for teams whose devices sleep often while in use. - The new on-device stack unwinding option for capturing crash Traces, which can
be enabled by setting
coredump.capture_strategy.typetostacktraceinmemfaultd.conf. - High resolution telemetry, which is enabled by default and can be disabled or
have its rate limiting configured with the
metrics.high_resolution_telemetryfield. - Support for Yocto Scarthgap in
meta-memfault. This support will be extended tometa-memfault-examplein an upcoming release. Check out thescarthgapbranch if you are using that version of Yocto! - The built-in system memory metrics now include additional states such as Cached and Buffered.
- The
metrics.statsd_serverhas had a new option,legacy_gauge_aggregation, added that averages Gauge metric readings rather than simply storing the most recent value. This is meant to allow for a smooth migration fromcollectd's StatsD server tomemfaultd's. New integrations should use theh(Histogram) metric type for Metrics whose readings should be aggregated via average.
Changed
- The default on-device rate limit for logs ingested by
memfaultdhas been increased from 500 lines per minute to 1000 lines per minute
Fixed
- Arbitrary ASCII strings between 1 and 128 in length can now be used in StatsD
metric keys (besides the
:delimiter), matching the behavior described in the docs.
Removed
Some built-in metrics were removed, as the naming conventions were not consistent. All of these metrics were added in 1.15.0. The list can be found below:
cpu_usage_pctconnectivity_recv_bytesconnectivity_sent_bytesconnectivity_<interface>_recv_bytesconnectivity_<interface>_sent_bytesmemory_used_pctmemory_<process>_pctcpu_usage_<process>_pctstorage_used_<disk>_pct