Debugging Android Battery Life with Memfault
Battery life on Android devices is a complex topic: There are many factors which could impact the battery life of a device (including hardware issues, software bugs, usage patterns and much more). Android devices themselves are complex beasts, potentially running hundreds of individual applications and with varying hardware configurations.
In this guide, we will discuss some of the common issues and how to use Memfault to identify and diagnose them - looking at battery life over an entire fleet, and also drilling down into an individual device.
How do I debug battery life?
The great news is that the Android SDK will collect battery metrics out-of-the-box, with no further action required once the SDK is integrated! This can be disabled, but is enabled by default (see Battery Stats Collection Enabled).
The Memfault Android SDK will query the Android batterystats subsystem hourly, capturing a high-fidelity history of battery performance (other factors that may have affected it). The data captured by the SDK is similar to what would be displayed by the Battery Historian tool - except without taking a full bugreport!
What data does Bort collect?
- Hourly aggregate metrics describing battery usage since the last collection. These are listed here. They are all available for selection as timeseries or attributes in Metrics Settings, and can be used in Metric Charts and Alerts, as well as Device Search.
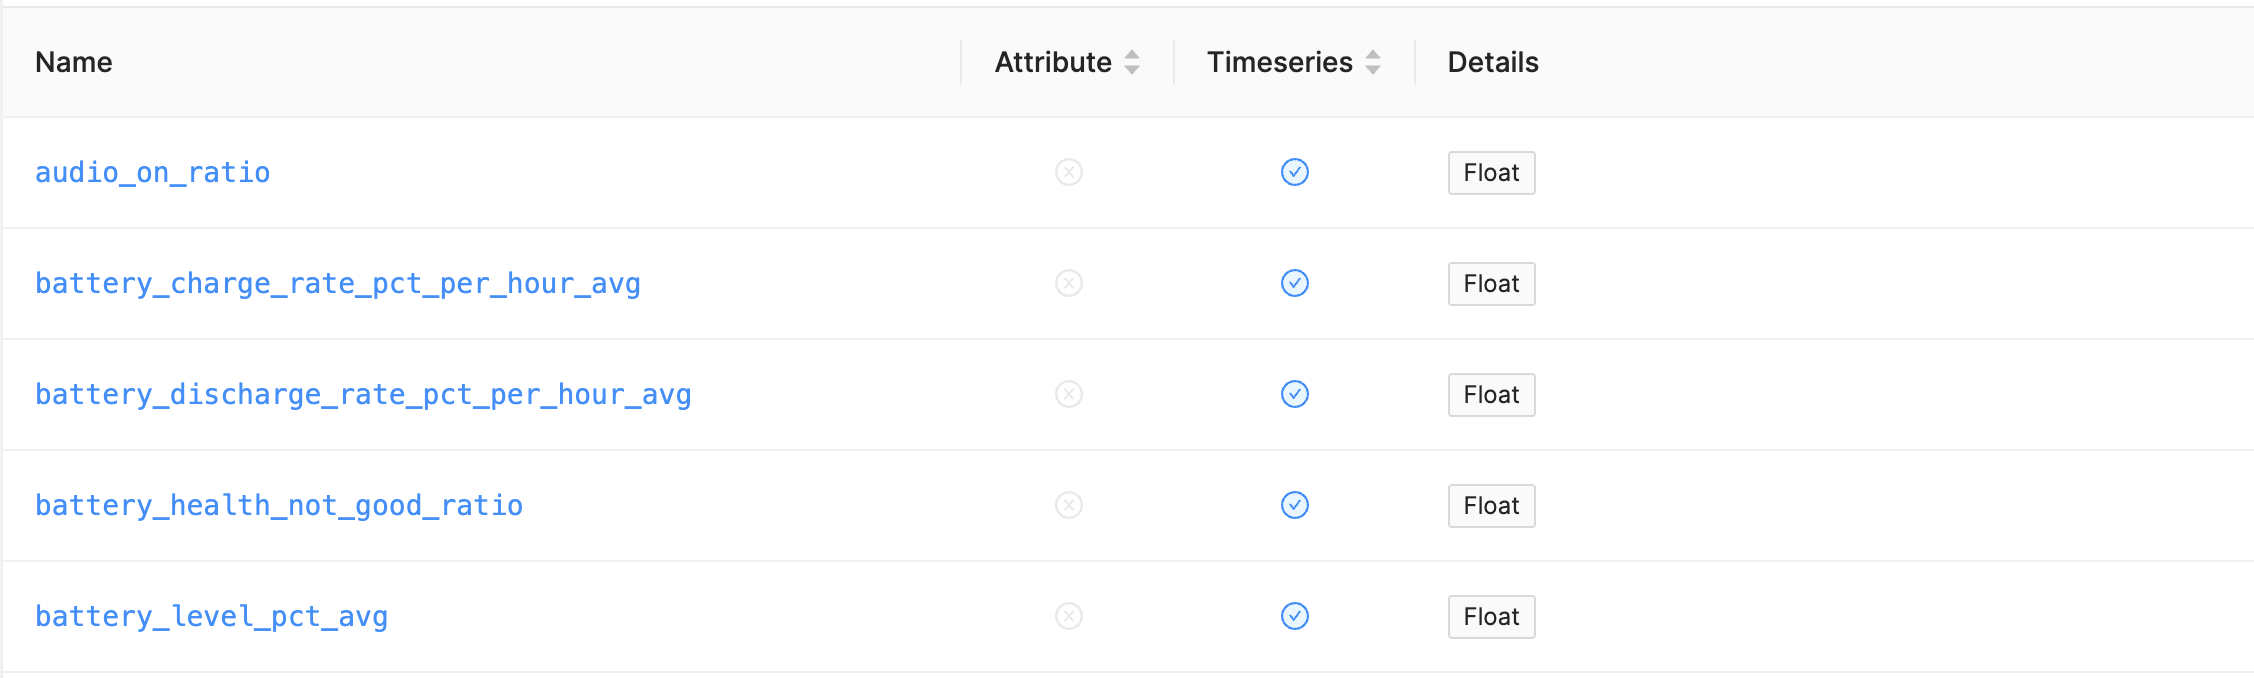
- High resolution battery data, showing battery usage in detail. This is displayed on the device timeline, allowing close inspection for an individual device. Since Android SDK 4.8.0, this includes per-component battery usage metrics.
Note that we continue to add new metrics to Bort - be sure to keep the SDK updated to benefit from these.
Analyzing Fleet Battery Performance - do we have a problem?
The first thing we want to know is - do we have a battery life problem?
Analyzing battery metrics across the entire fleet is the most powerful way to see any trends - good or bad - in battery performance. We can see whether the absolute performance across the fleet is acceptable, and also spot changes. Memfault can help with all of this.
Fleet-wide charts
Any of the listed metrics can be used to create fleet-side charts on the Metrics dashboard.
Battery discharge rate
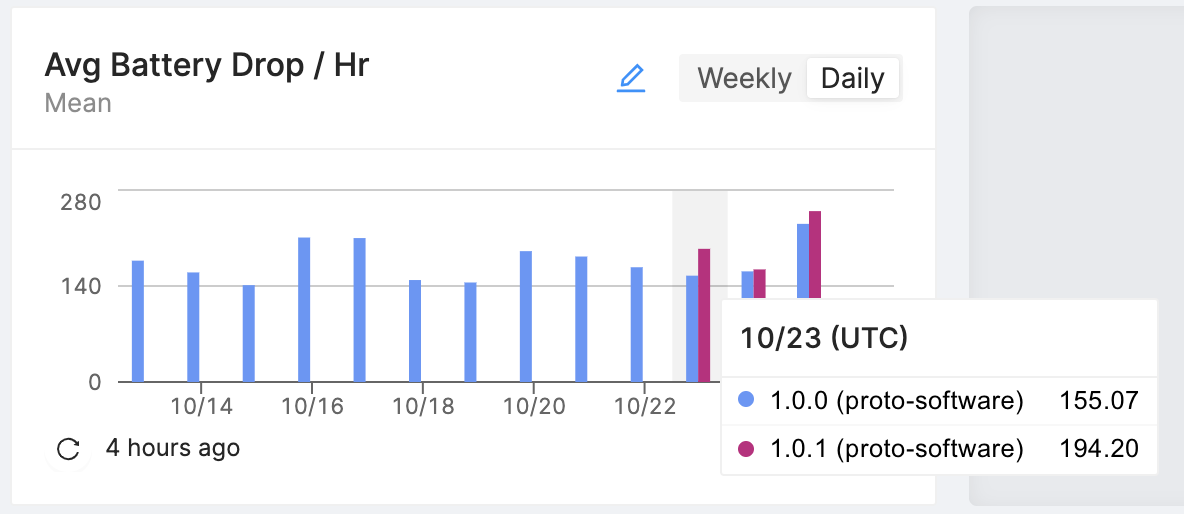
As an example, the battery_discharge_rate_pct_per_hour_avg metric will show us
the average drop in battery level. A noticeable spike in this metric across the
fleet would be worth investigating - it might signal that something changed
which is adversely affecting battery life.
Why use this, rather than battery_level_pct_avg (average battery level)? The
discharge rate is more meaningful - the average level will not show us if the
battery is discharging faster, if users are also charging more often!
battery_discharge_rate_pct_per_hour_avg ignores periods when the device was
charging, to provide a true discharge rate, prorated per hour.
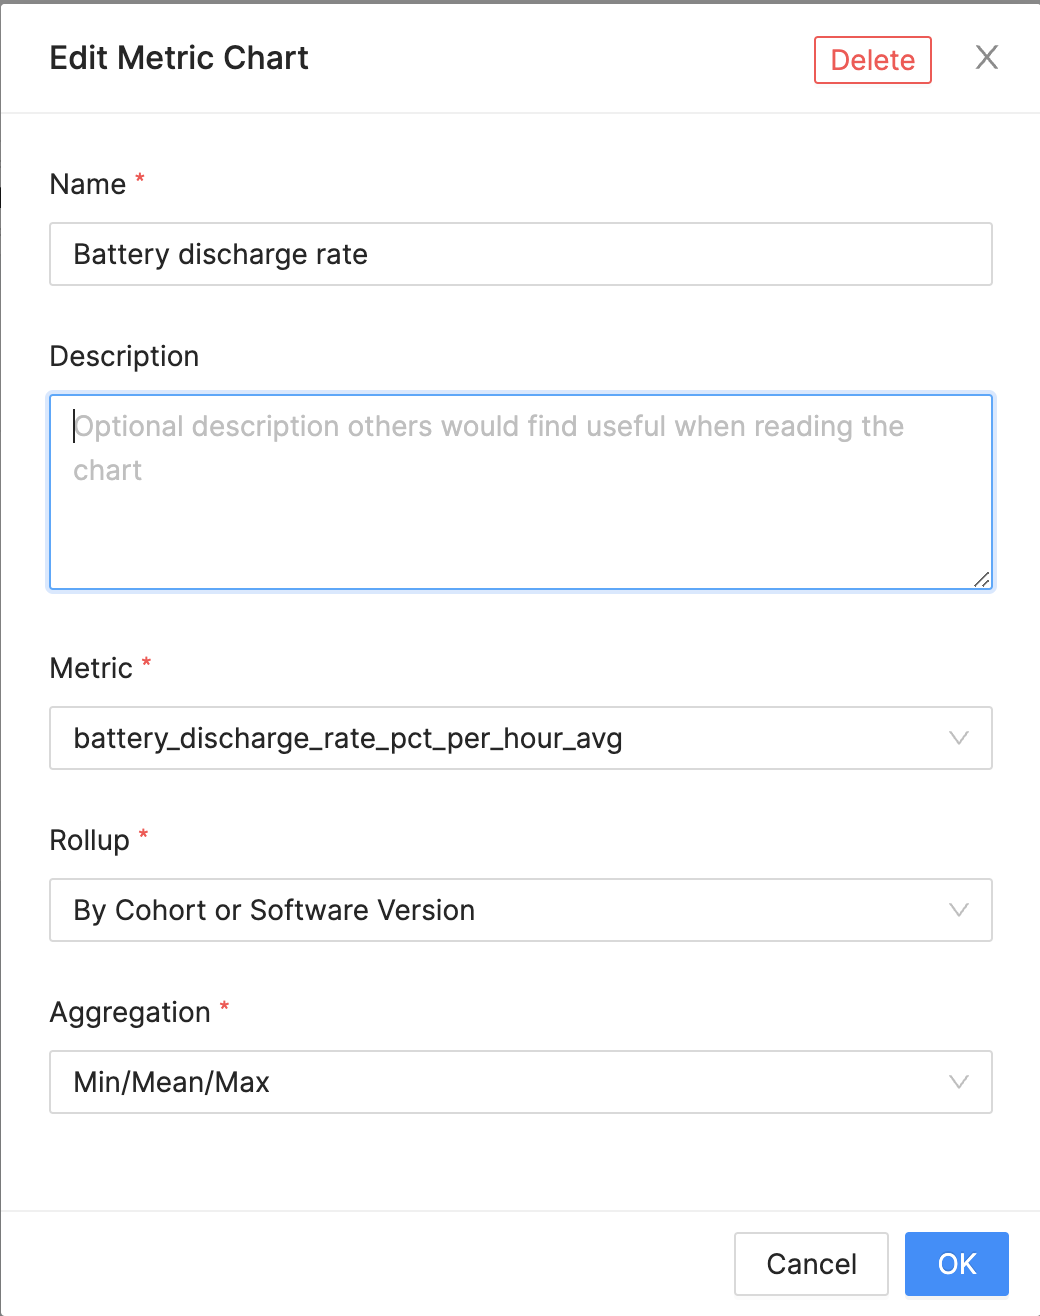
This chart configured with Rollup By Cohort or Software Version allows
comparison between software versions over all-time, which can be useful to
identify battery life regressions caused by firmware changes. See
Metric Charts by Cohort or Software Version
for more details on how these charts highlight trends.
Rollup Over time also
allows comparison between software versions,
while showing trends over time (up to the last 8 weeks). This is more likely to
identify battery life changes caused by usage pattern or environmental changes.
Eliminating screen variability
The screen is usually the biggest power draw on an Android device; the screen-on and screen-off discharge rates may be more useful to track than the overall discharge rate. This will avoid investigating spikes that were caused simply by users keep the screen active for longer. These metrics were added in Android SDK 4.8.0 and make useful metric charts:
screen_off_battery_drain_%/hourscreen_on_battery_drain_%/hour
Another interesting metric added in 4.8.0 is estimated_battery_capacity_mah,
which reports the Android estimation of current battery capacity. This is
expected to degrade over time, but sudden drops might be cause for alarm.
Alerts for Fleet Battery Performance
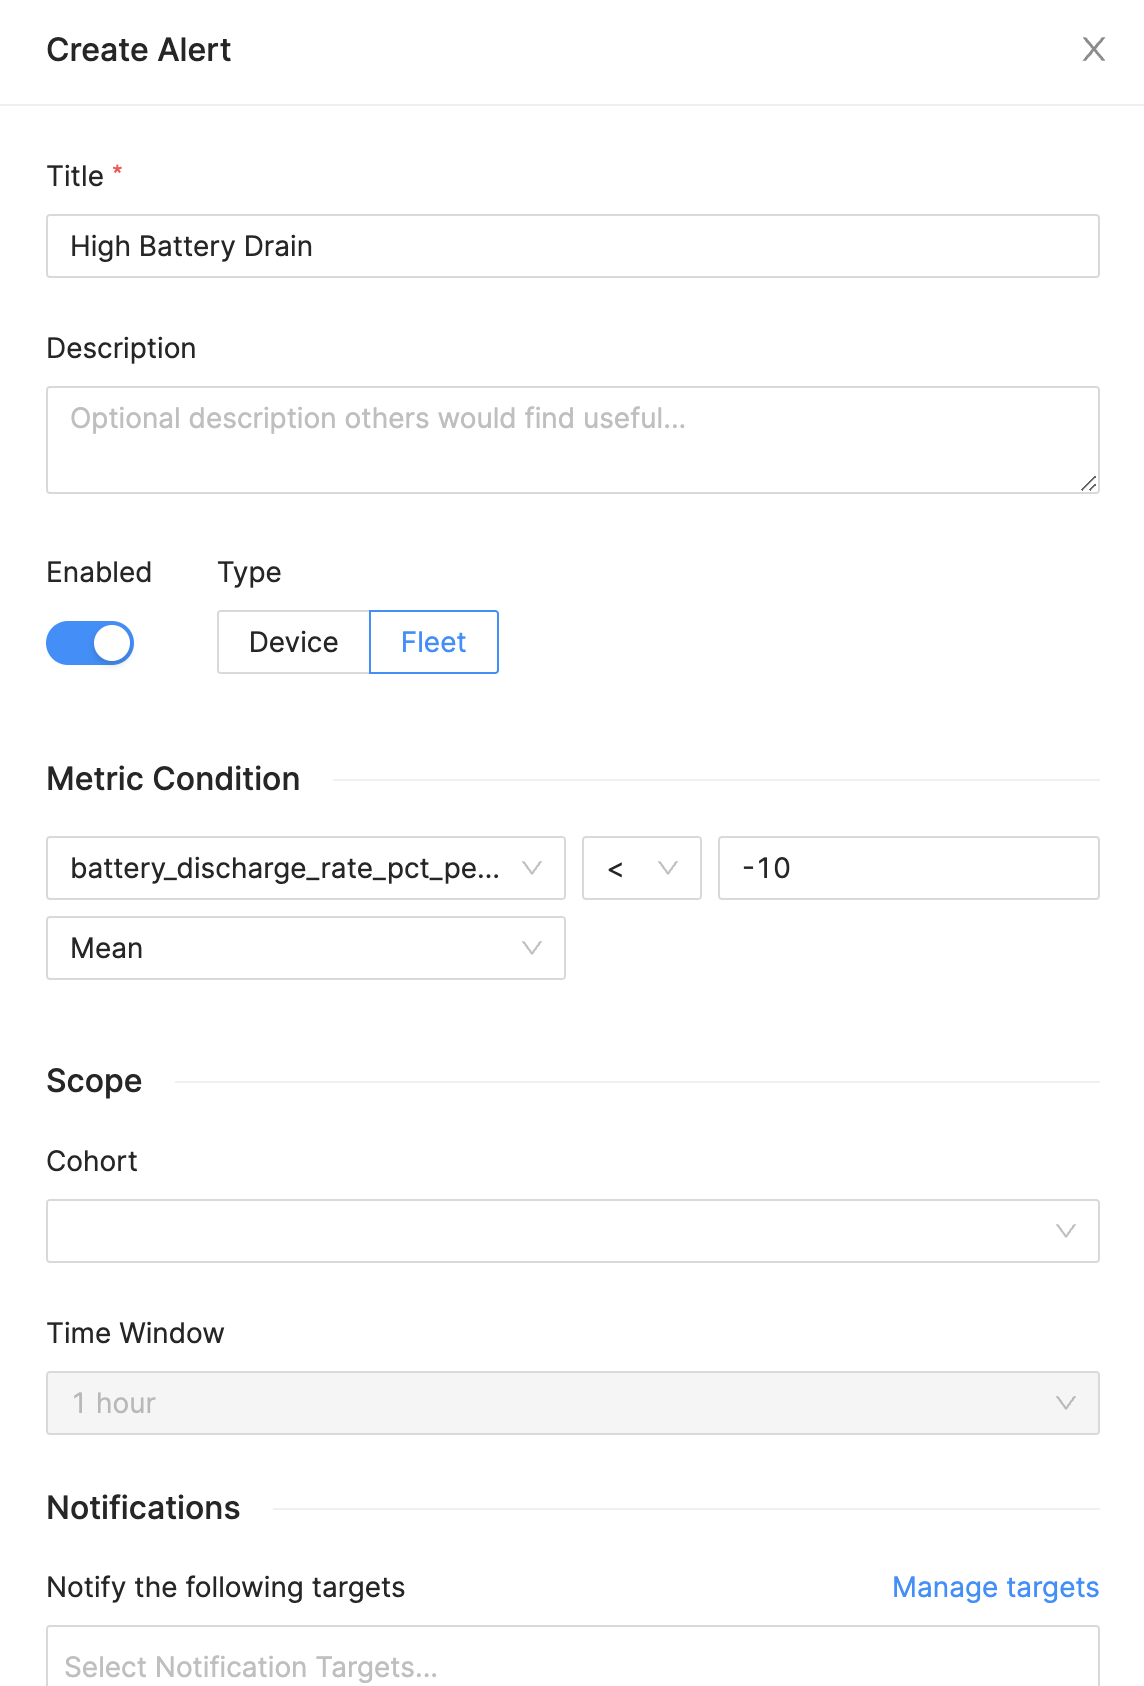
Using the same metrics mention above, we can create an alert whenever the
fleet-side average drain goes above a specific rate. Note: the metric is
reported in negative percentage values, so we use a < operator and negative
value to configure the alert.
On the Alerts screen, create a new alert with these settings to be alerted whenever the average drain rate for the fleet is more than 10%/hour:
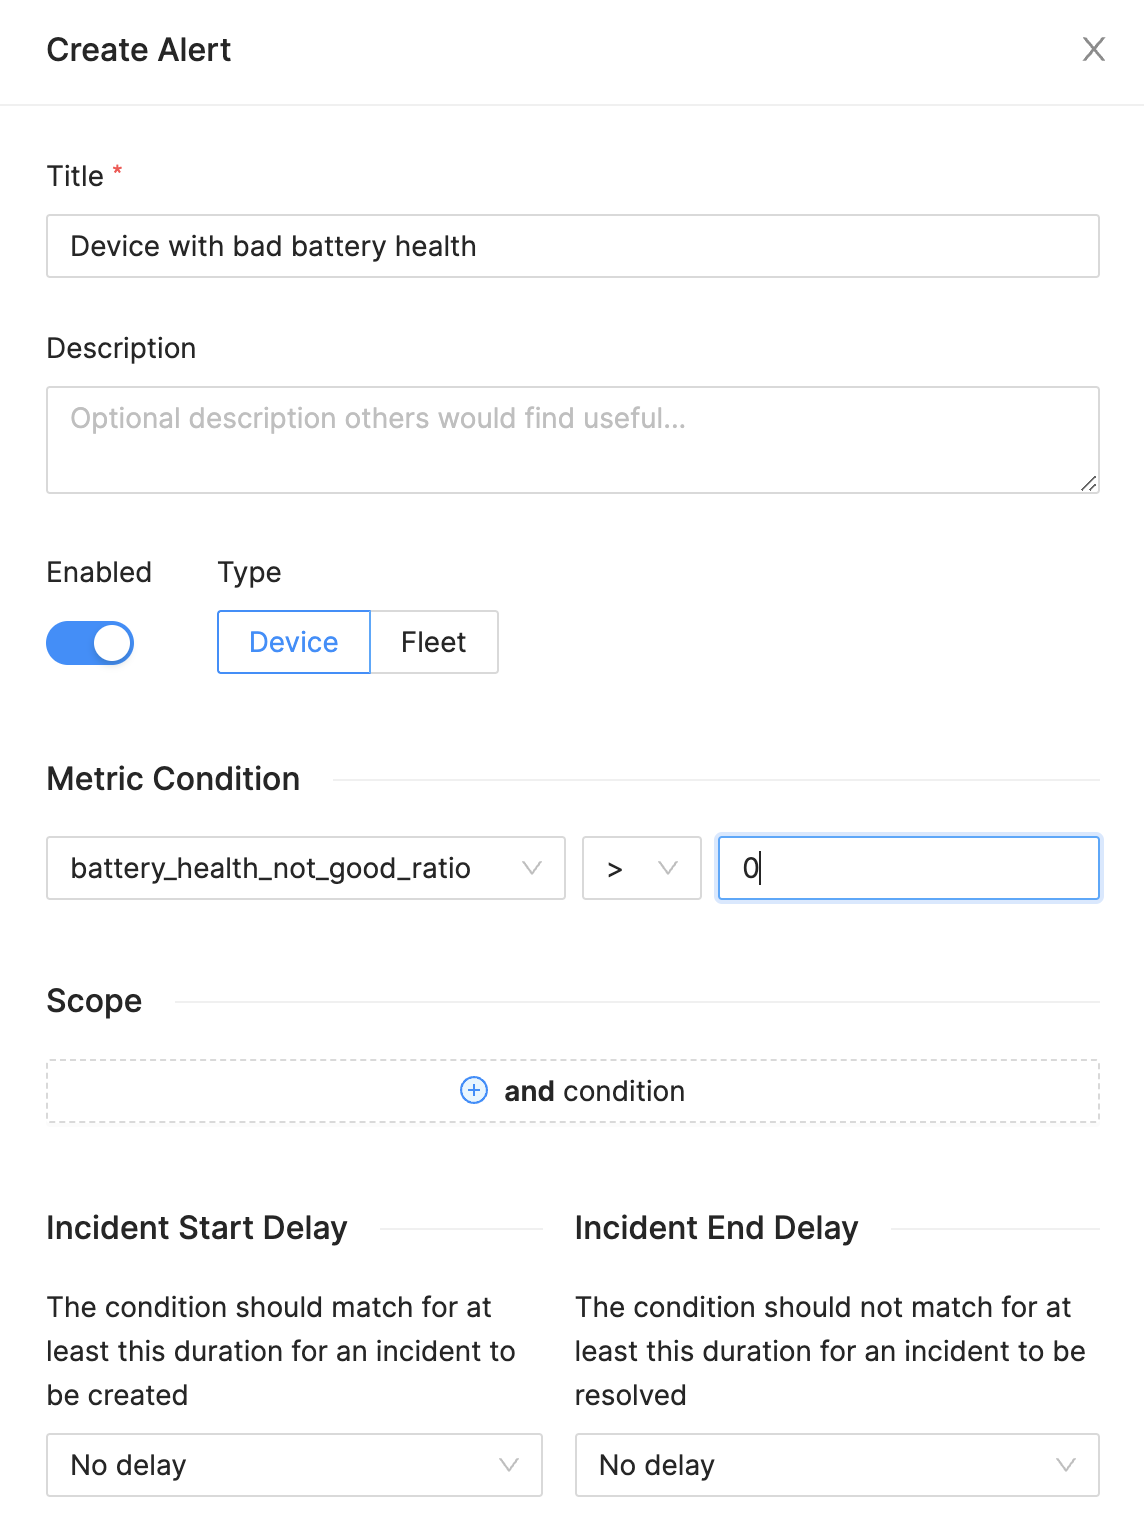
Alerting for individual devices
We may wish to know immediately when an individual device reports certain
battery states - e.g. bad battery health as reported by Android
(battery_health_not_good_ratio) or battery tmperature (max_battery_temp).
An alert for bad battery health can be configured like this - which will report each individual device reporting any bad battery health during the reporting window:
We have a problem! Drilling down to find out why
Once we have found a problem - whether that is a fleet-wide drop in battery performance, an alert on an individual device, or a customer reporting a problem - we can use Memfault to investigate:
- Finding affected devices.
- Drilling down into these devices, to view high-resolution battery metrics and identify the root-cause.
Finding affected devices
Memfault's device search is a powerful tool to find devices in your fleet which match certain criteria. This can include looking for devices which experienced a high level of battery discharge. This search will return devices which saw any 1-hour period with a 15% screen-off battery discharge rate in the selected 7-day period:
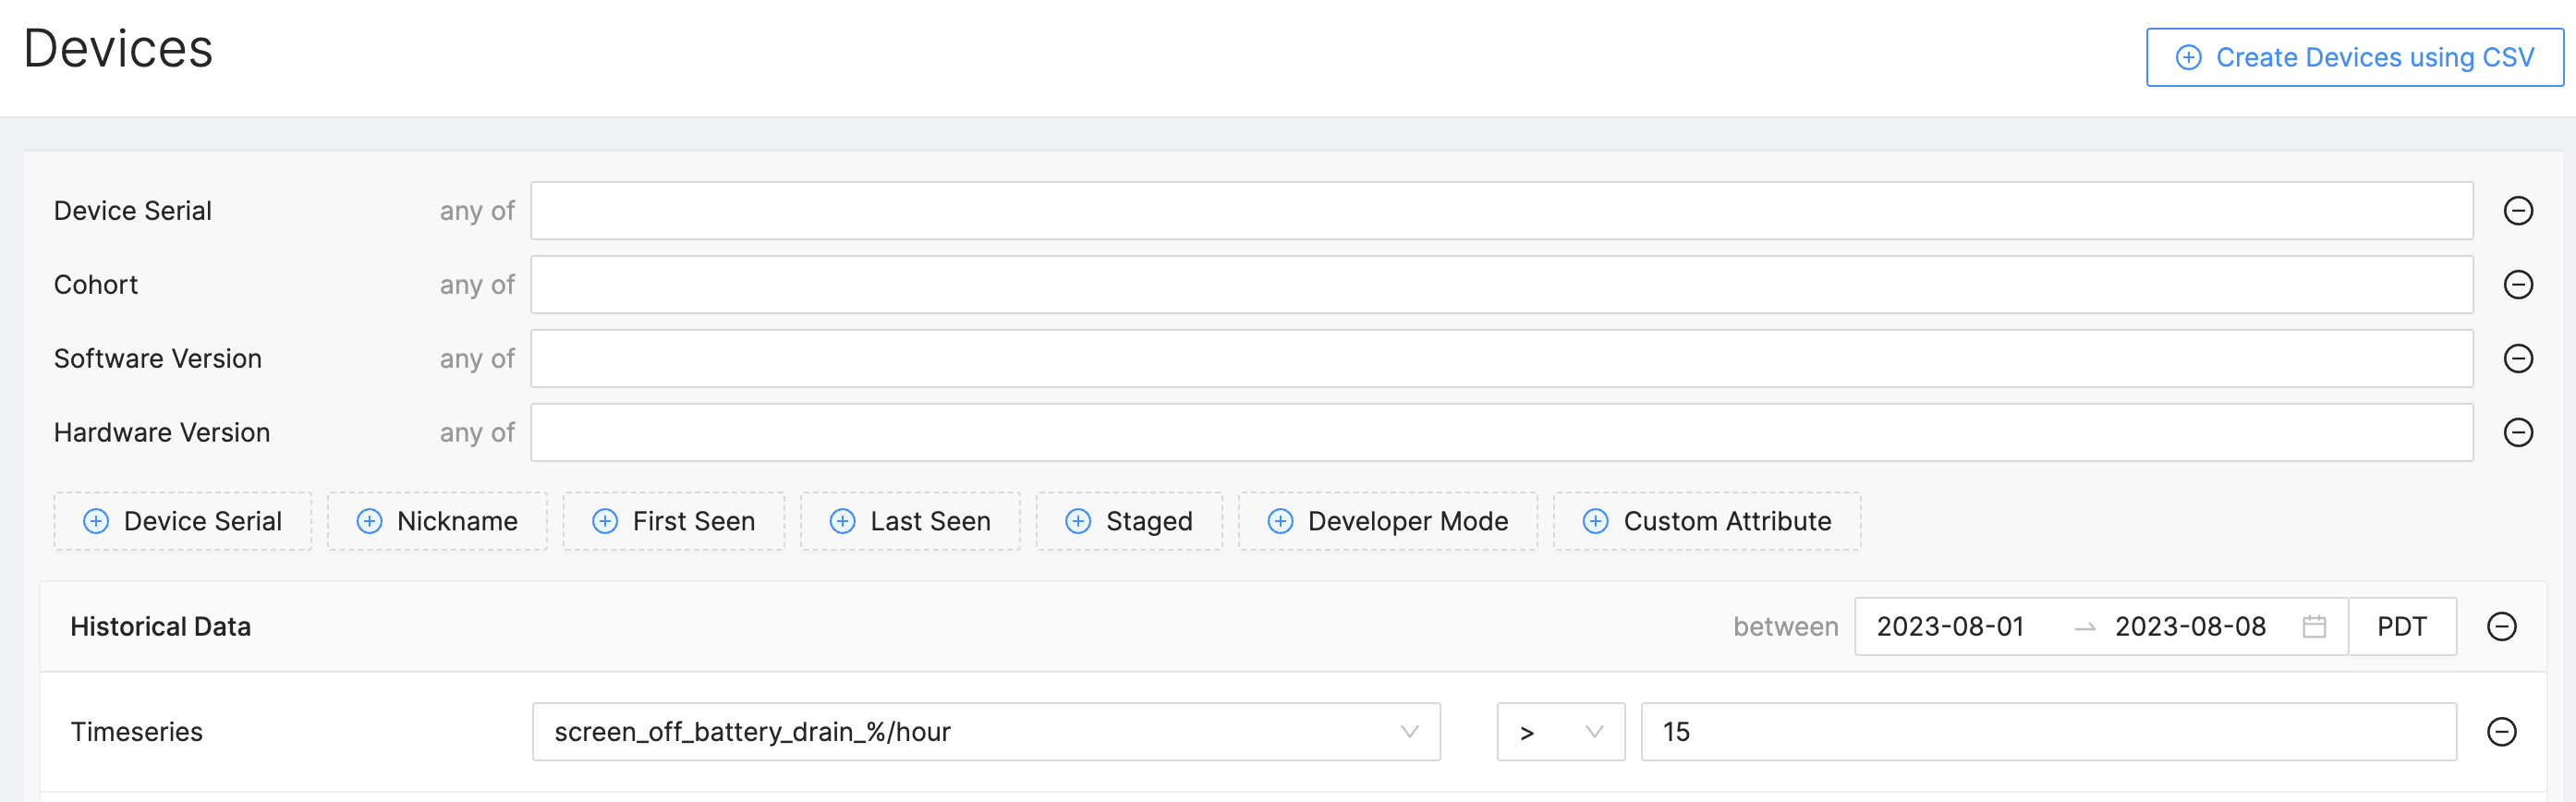
We can then click through to any affected device, to investigate further.
This search can also be converted into a Device Set, allowing us to see how many devices are affected over time, and easily come back to the results to investigate further.
Debugging an individual device
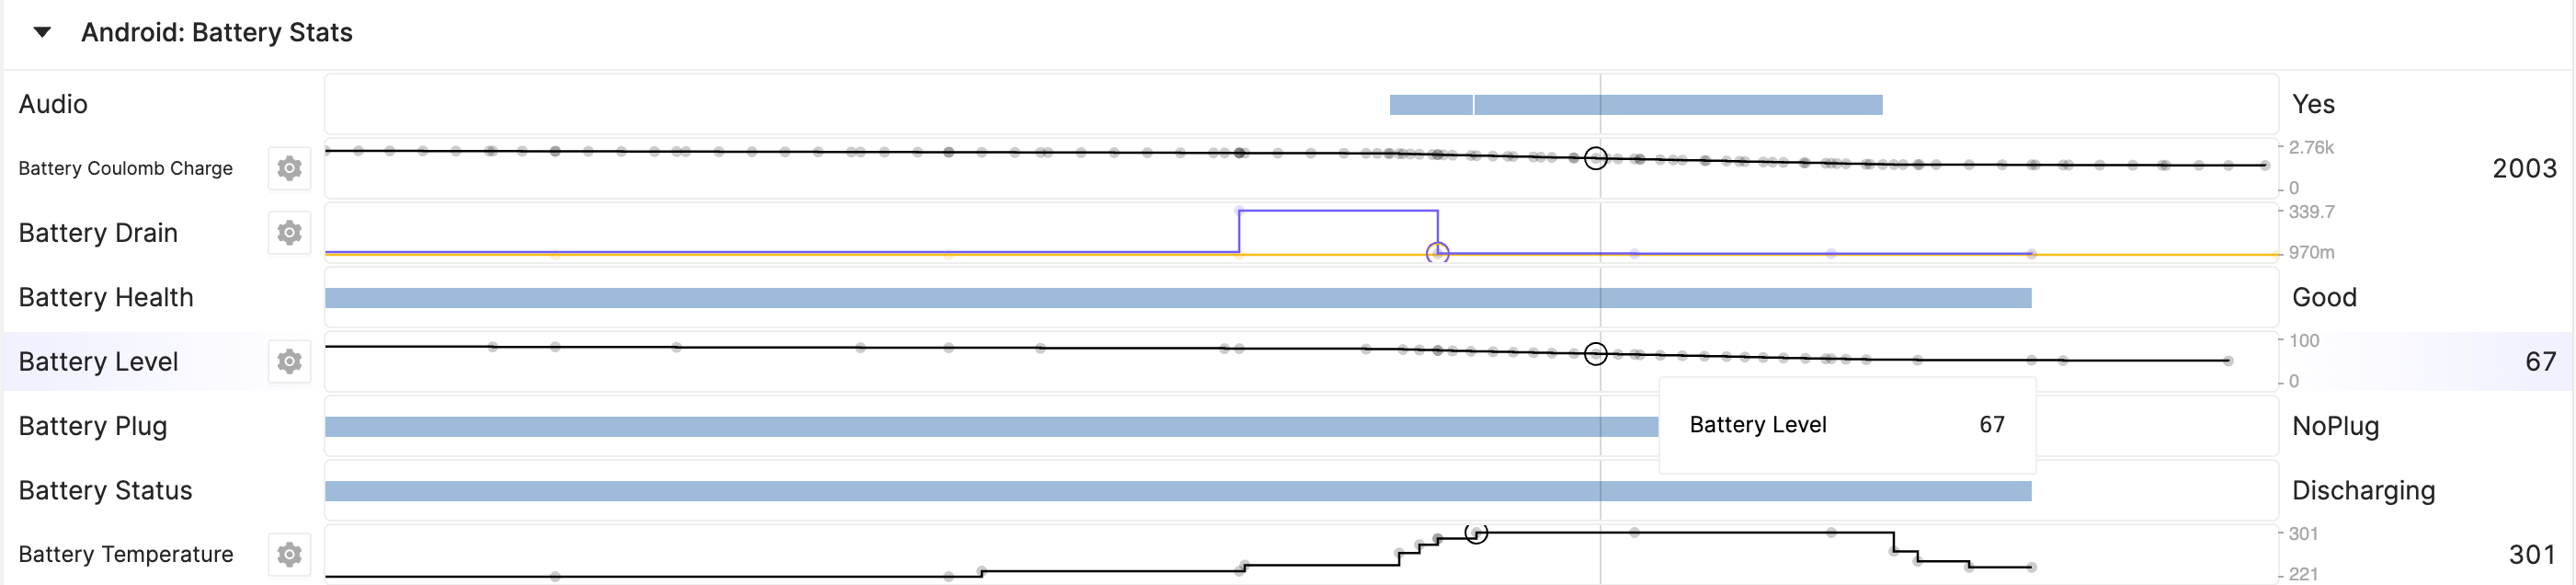
Device timeline - what is happening on this device?
The device timeline is a detailed view of everything happening on a device, including many battery-related metrics. It can be useful for:
- Spotting abnormal events or metrics easily, without diving into logs.
- Viewing the changes in metrics over a short period of time, in granular detail.
- Correlating related (sometimes causal) events to try to find out "why" something is happening.
Out-of-the-box, the Android SDK will display many battery-related metrics (including e.g. battery level/voltage/temperature, charging state, battery health, CPU usage, screen usage, Wi-Fi/cell/bluetooth radio activity, wakelocks) on the timeline. Also on the timeline:
- Traces (app crashes, ANRs, kernel oops, WTFs, etc).
- Reboots.
- CPU/Device temperatures.
- Many others - see Built-in metrics.
We are constantly adding new metrics to the SDK - make sure to keep your Bort integration up-to-date!
If your device has specific behavior or triggers which may affect battery life (for example, if a device starts to power an external USB device, turns on an external light, or a known heavy data processing job is running), then we recommend using our Metrics APIs to record relevant state or events. High-Resolution Telemetry enables viewing this data in the same granular detail as the built-in events on timeline, and could prove very useful in debugging exactly how battery life is affected. We cannot overstate how powerful it is to have pertinent device state visible on timeline, rather than needing to manually dig through logcat to build up a picture of what is happening on the device!
Find battery issues on timeline
Some battery issues might be immediately obvious on the timeline. If we spot a
large drop in Battery Level correlated with any of these then it is a good
candidate to be related:
- A
Battery Temperatureoutside our expected range. - A high number of
Traces(e.g. a reboot-loop), potentially correlated withCPU Runningfor extended periods of time. - Any
Battery Healthother thanGood(e.g.Overheat,OverVoltage,Failure,Cold). - The device never enters
Dozemode even when inactive (or never entersFullDoze, if supported). Jobshows an unexpected number ofJobSchedulerjobs running.Estimated Battery Capacityis lower than expected (i.e. the battery has degraded).
On the other hand, we might find some things which suggest that high battery usage is actually expected given the usage pattern:
- Constant
Screen On, combined with aBrightScreen Brightness. PoorPhone Signal Strengthfor an extended period (which may require further investigation to determine whether this itself was expected given the environment, or a potential radio problem).
Which component is using battery?
Newly introduced in Android SDK 4.8.0, per-component battery usage is also now
displayed on timeline (see Battery Usage %/hour):
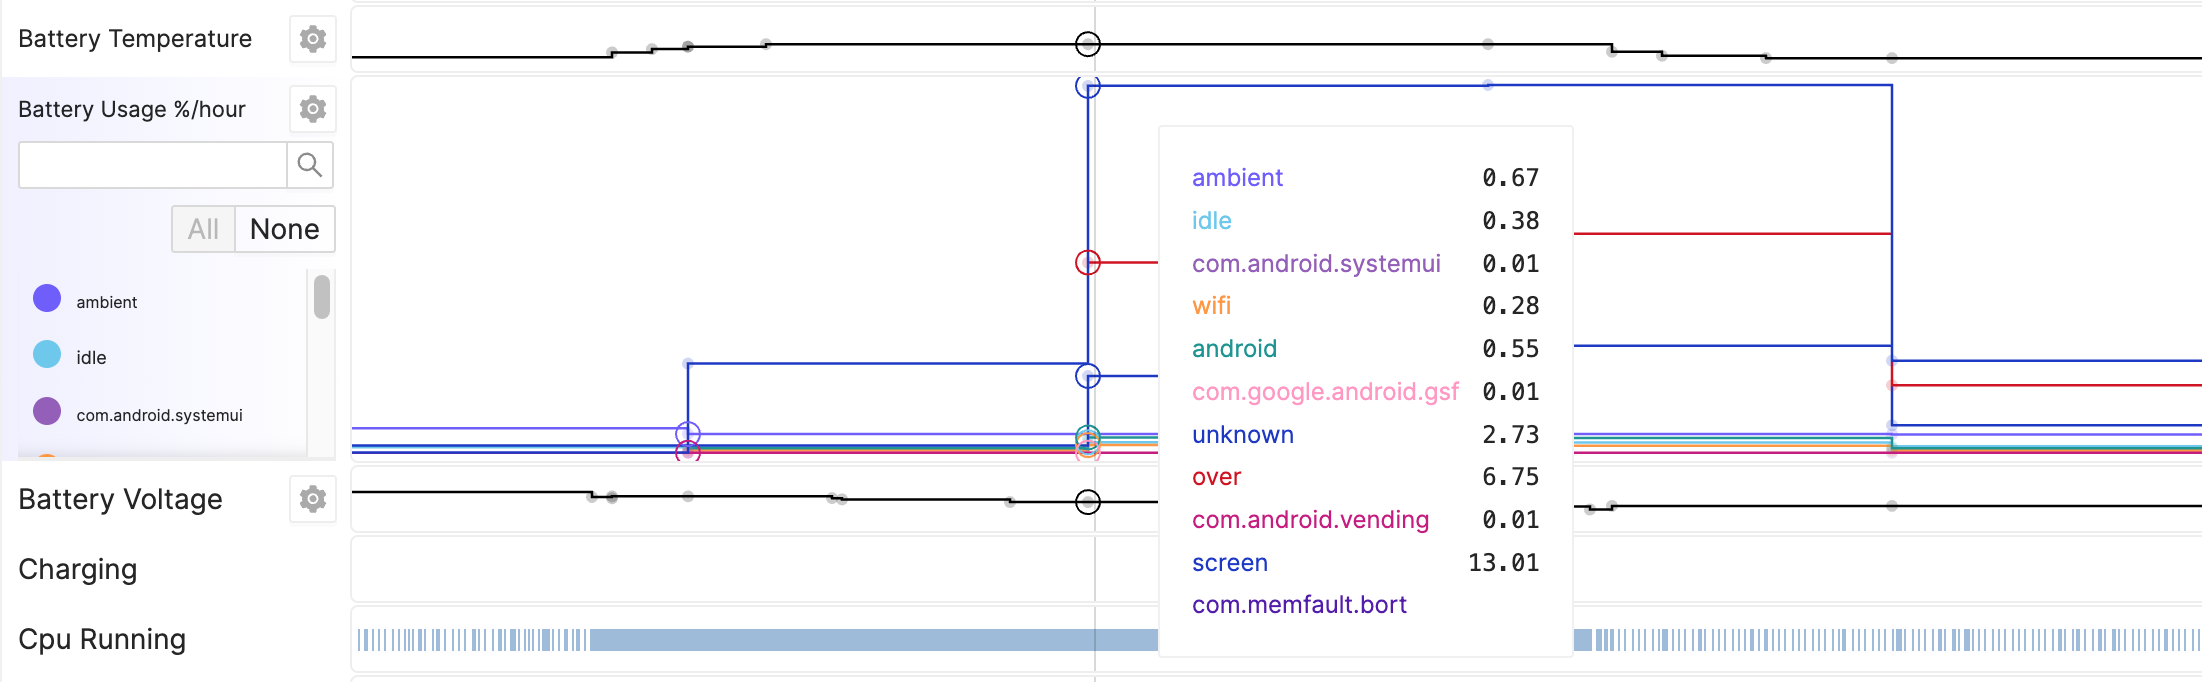
Here we can identify whether a specific system component or application is using large amounts of battery. This displays the pro-rated usage % per hour for each component.
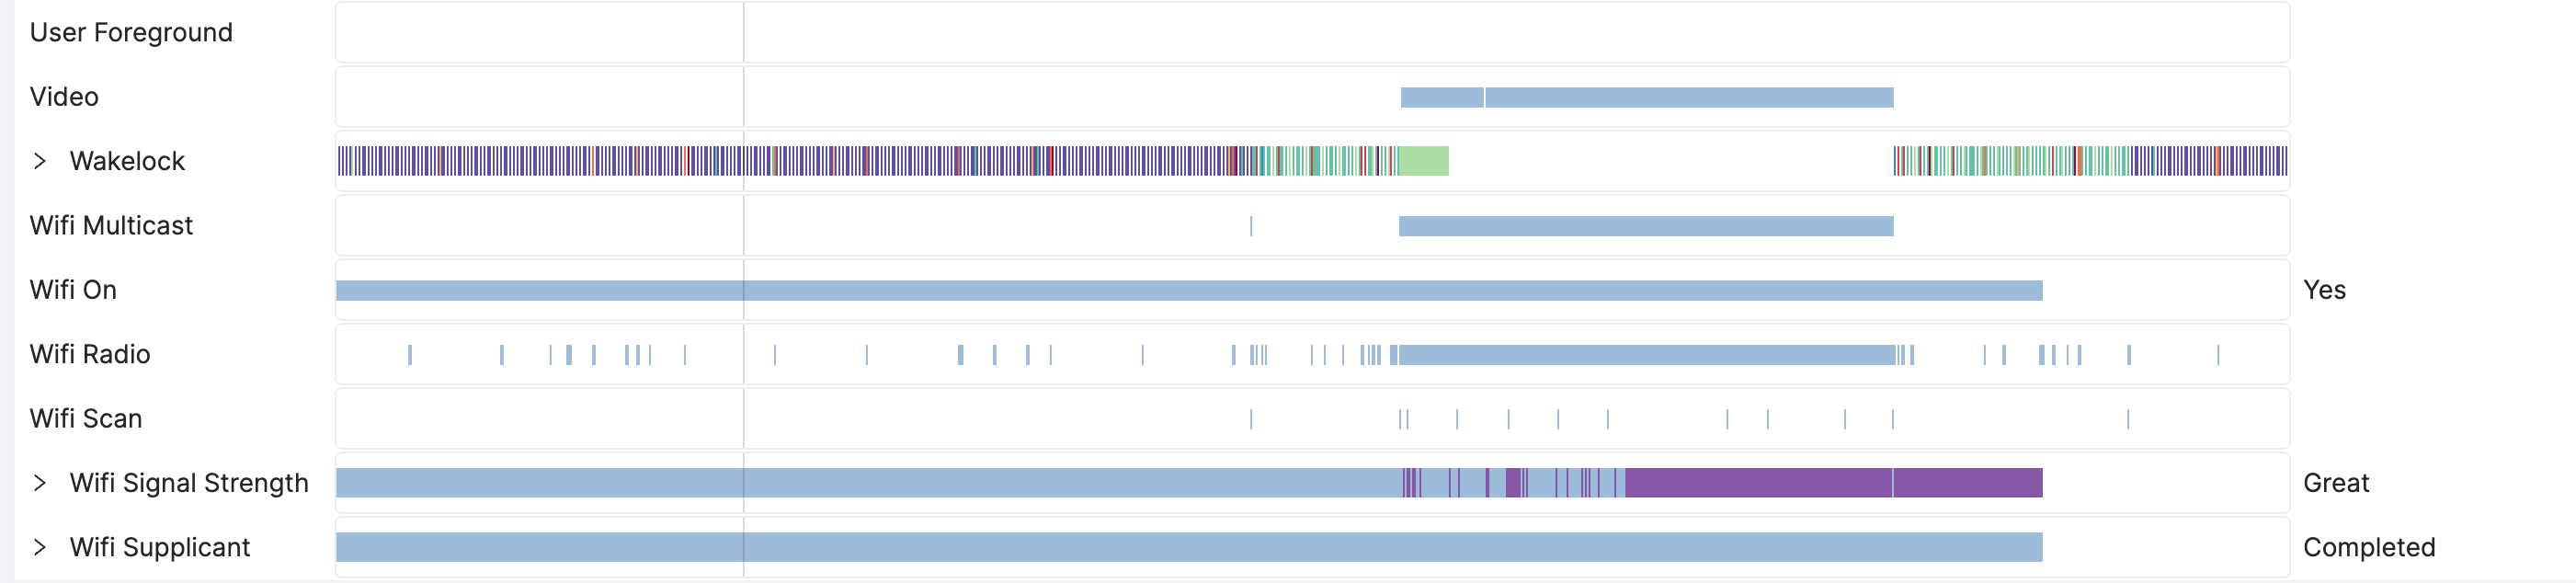
Some other clues will help identify problematic apps/services:
Foregroundwill show the current foregrounded app.Top Appshows the top-most application (some devices report this in place ofForeground).Wakelockshows which apps/services are holding wakelocks at any given time.Jobdisplays allJobSchedulerjobs, including which service is running.
From this, it may be obvious that a particular app or system service. is misbehaving.
How many devices have the same problem?
Once a root-cause has been identified (e.g. high CPU usage), we can go back to
create metric charts (using the cpu_running_ratio metric) to see how this is
trending across the fleet, and how it improves after rolling out a fix - e.g. we
should monitor the root cause, not just the outcome (battery discharge rate).
We can also create a Device Set
based on the cpu_running_ratio to see other affected devices, and track
individual devices as a fix is rolled out.