June 2026
Highlights
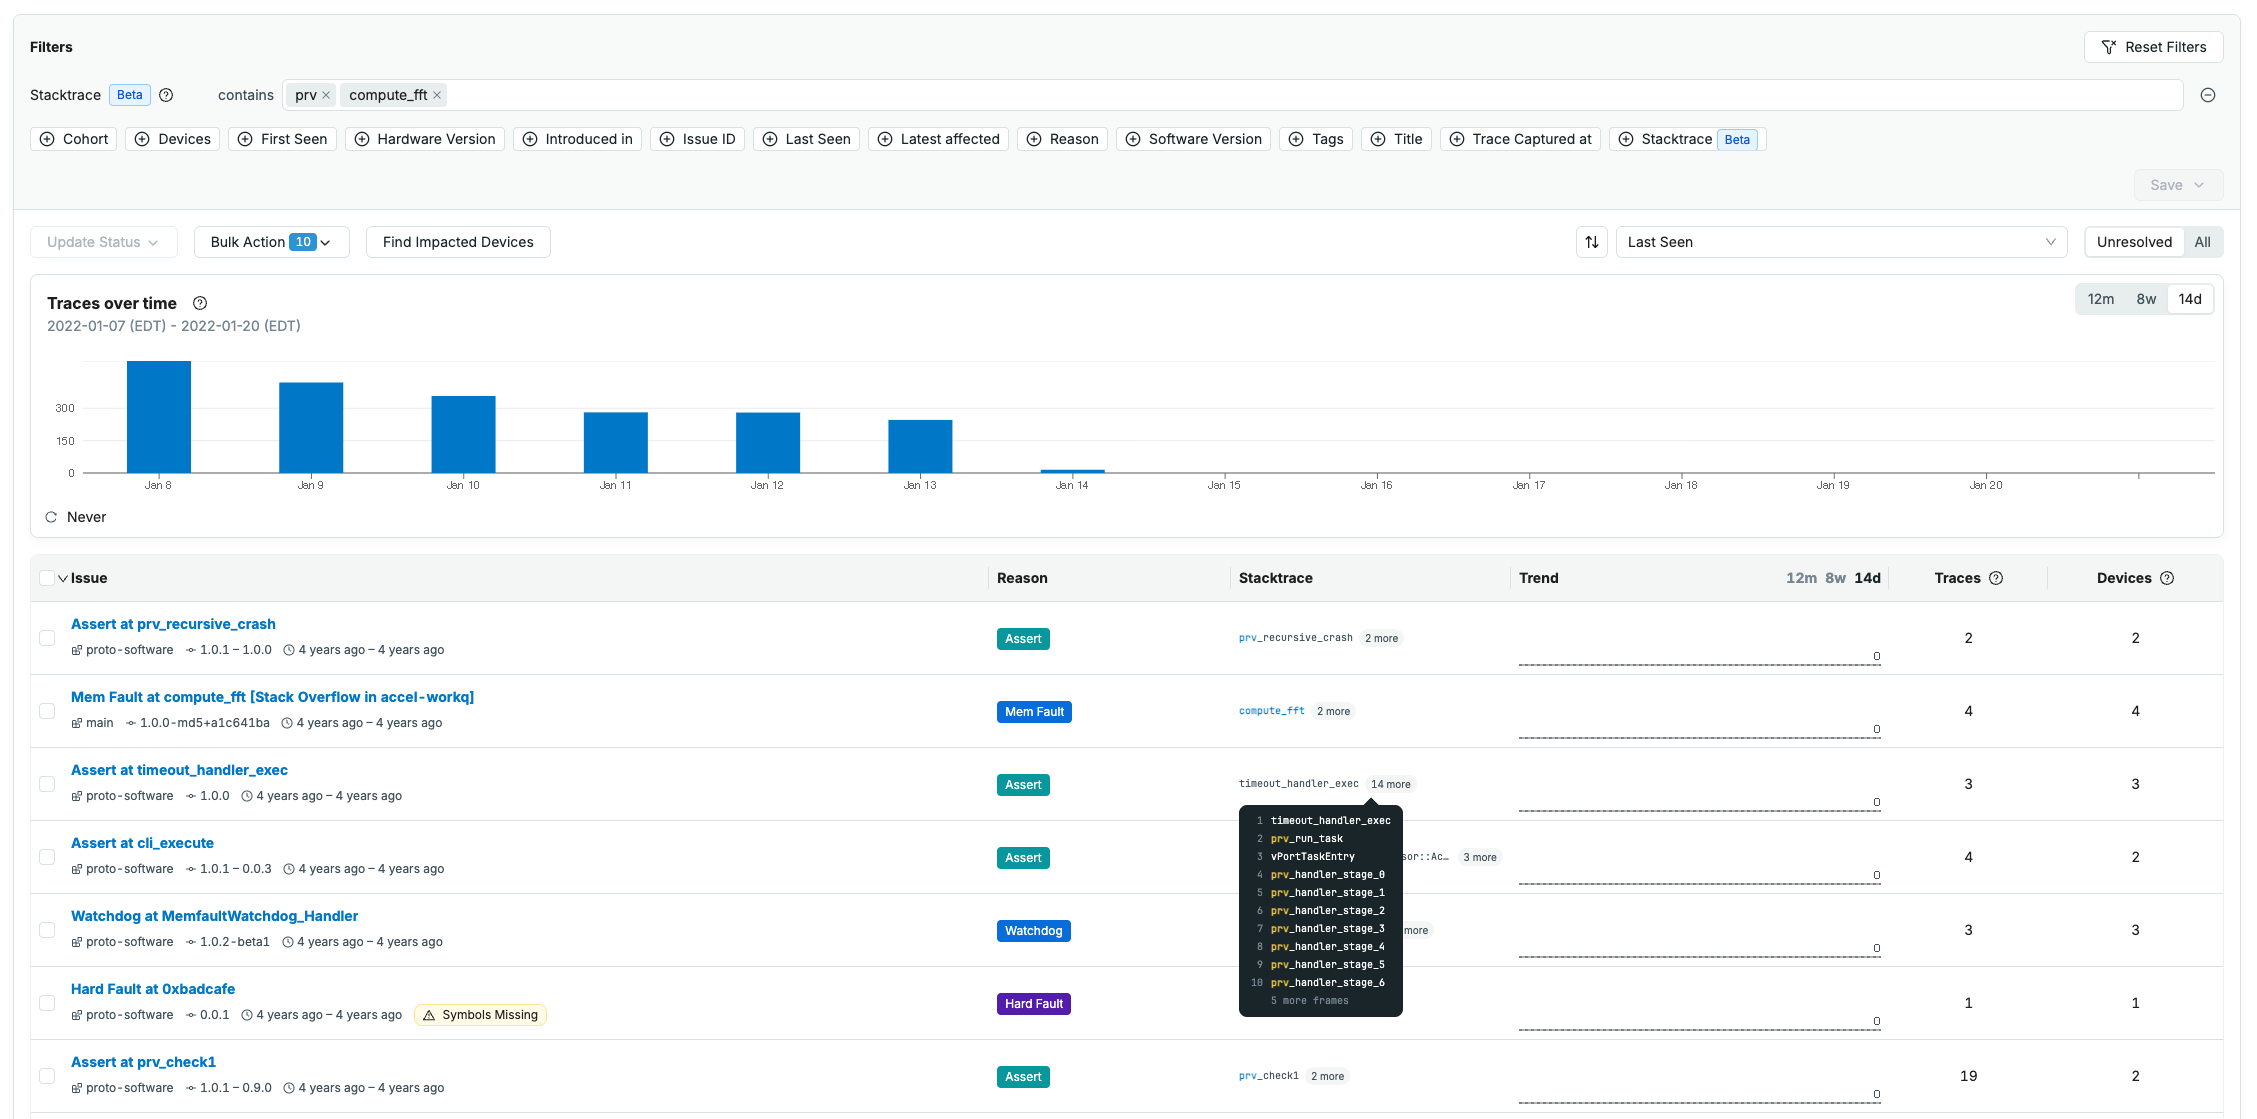
Issue Search: Stacktrace Column
Issue search results now include a Stacktrace column, showing the frames matched by the "Stacktrace contains" filter directly in the results table instead of requiring a click into each issue. From the trace thread viewer, you can also hover over a stack frame and jump straight to issue search with that function name applied as a filter.