October 2024
Sidebar Customization
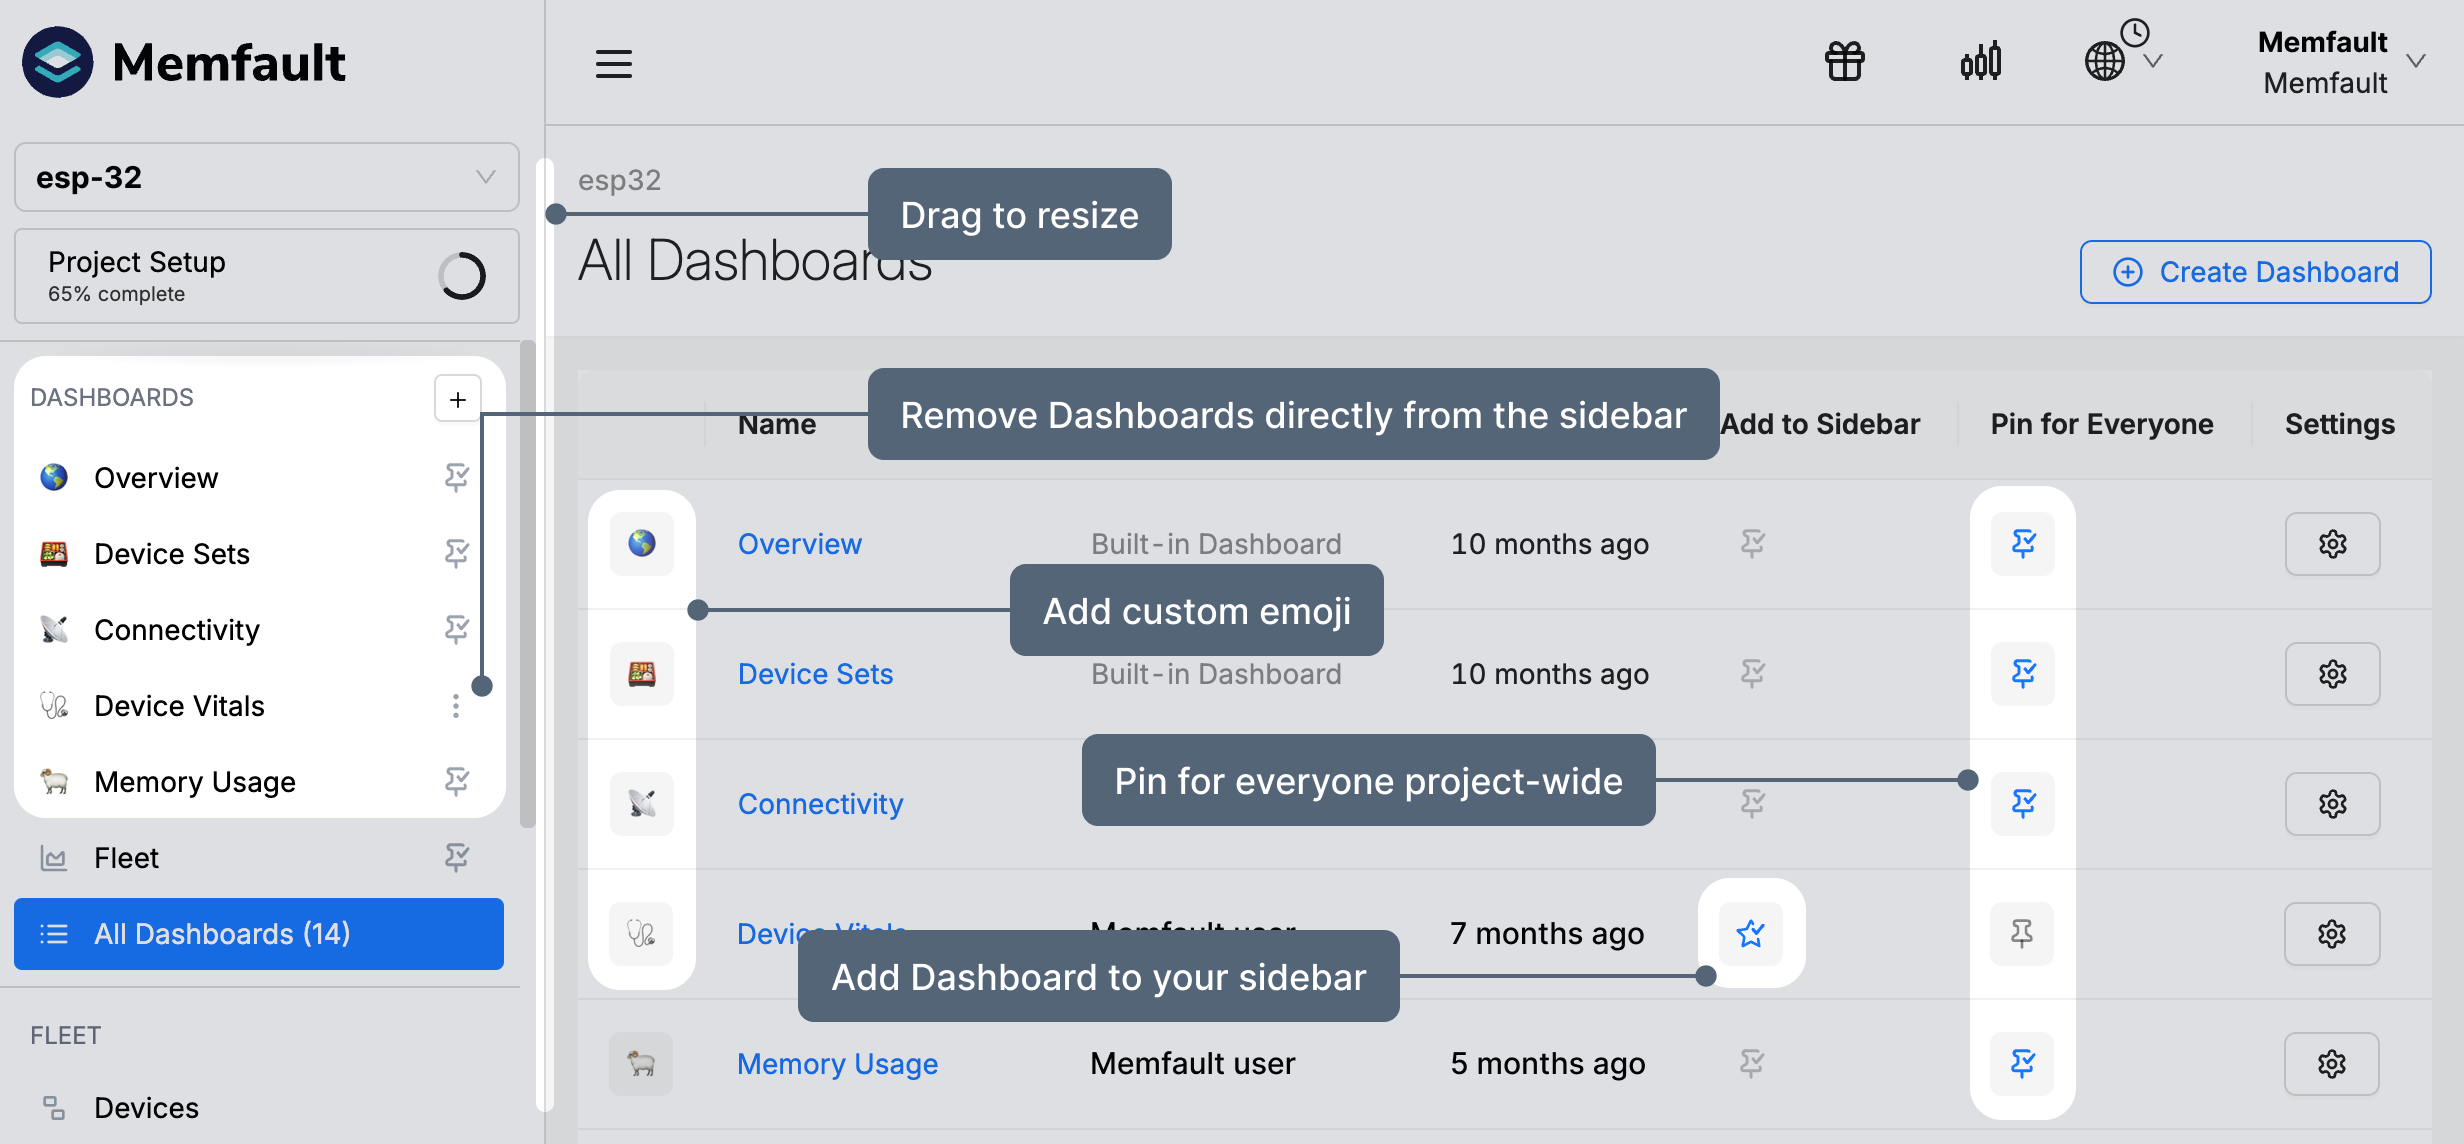
We've shipped a set of customization features to help you keep important Dashboards front and center
- Add your Favorite Dashboards to the Sidebar from the All Dashboards page or on any individual Dashboard page.
- You can assign a custom emoji to each Dashboard by clicking the icon next to the Dashboard's name.
- You can choose to Pin a Dashboard for everyone in the Project. You can use this feature to highlight the most important Dashboards to your team.
- In addition to hiding the sidebar you can now drag to resize too.
Pin Metrics to refine the Device Timeline
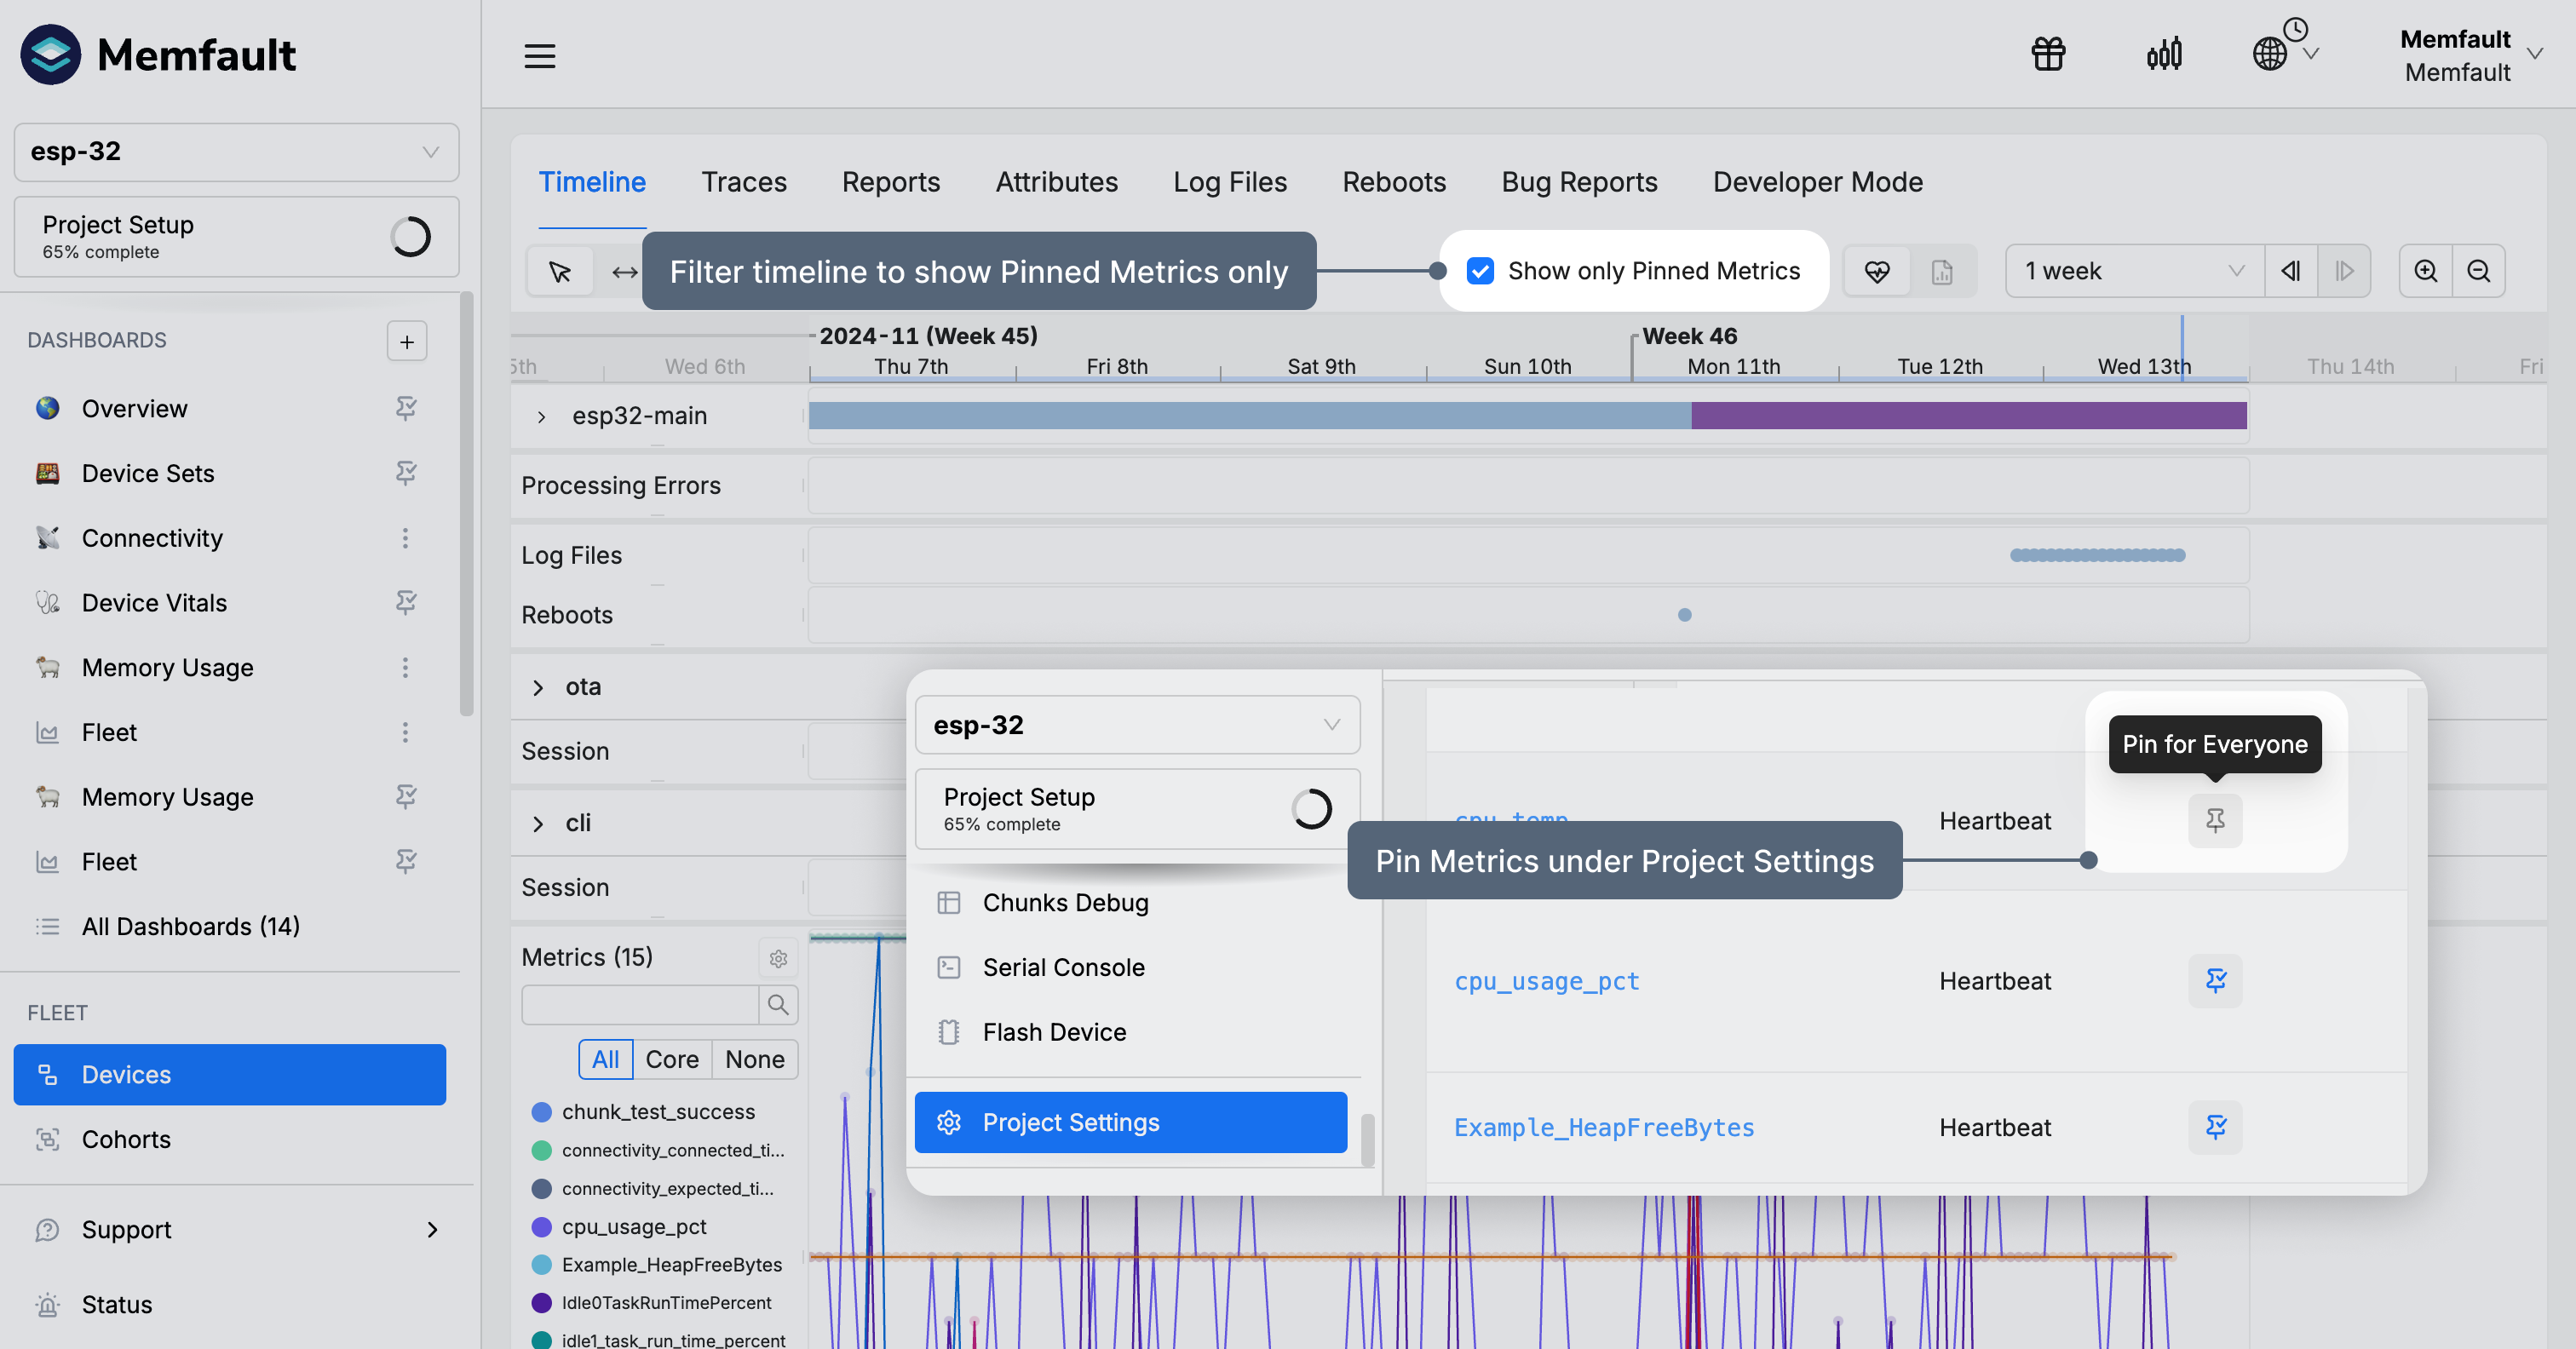
We enabled users to reduce the number of metrics shown on the Device Timeline by pinning what's most relevant for their projects.
- Under Project Settings pin Metrics that are shown on the Timeline as default.
- Toggle 'Show only Pinned Metrics' on and off to switch between views.
Introducing Dark Mode
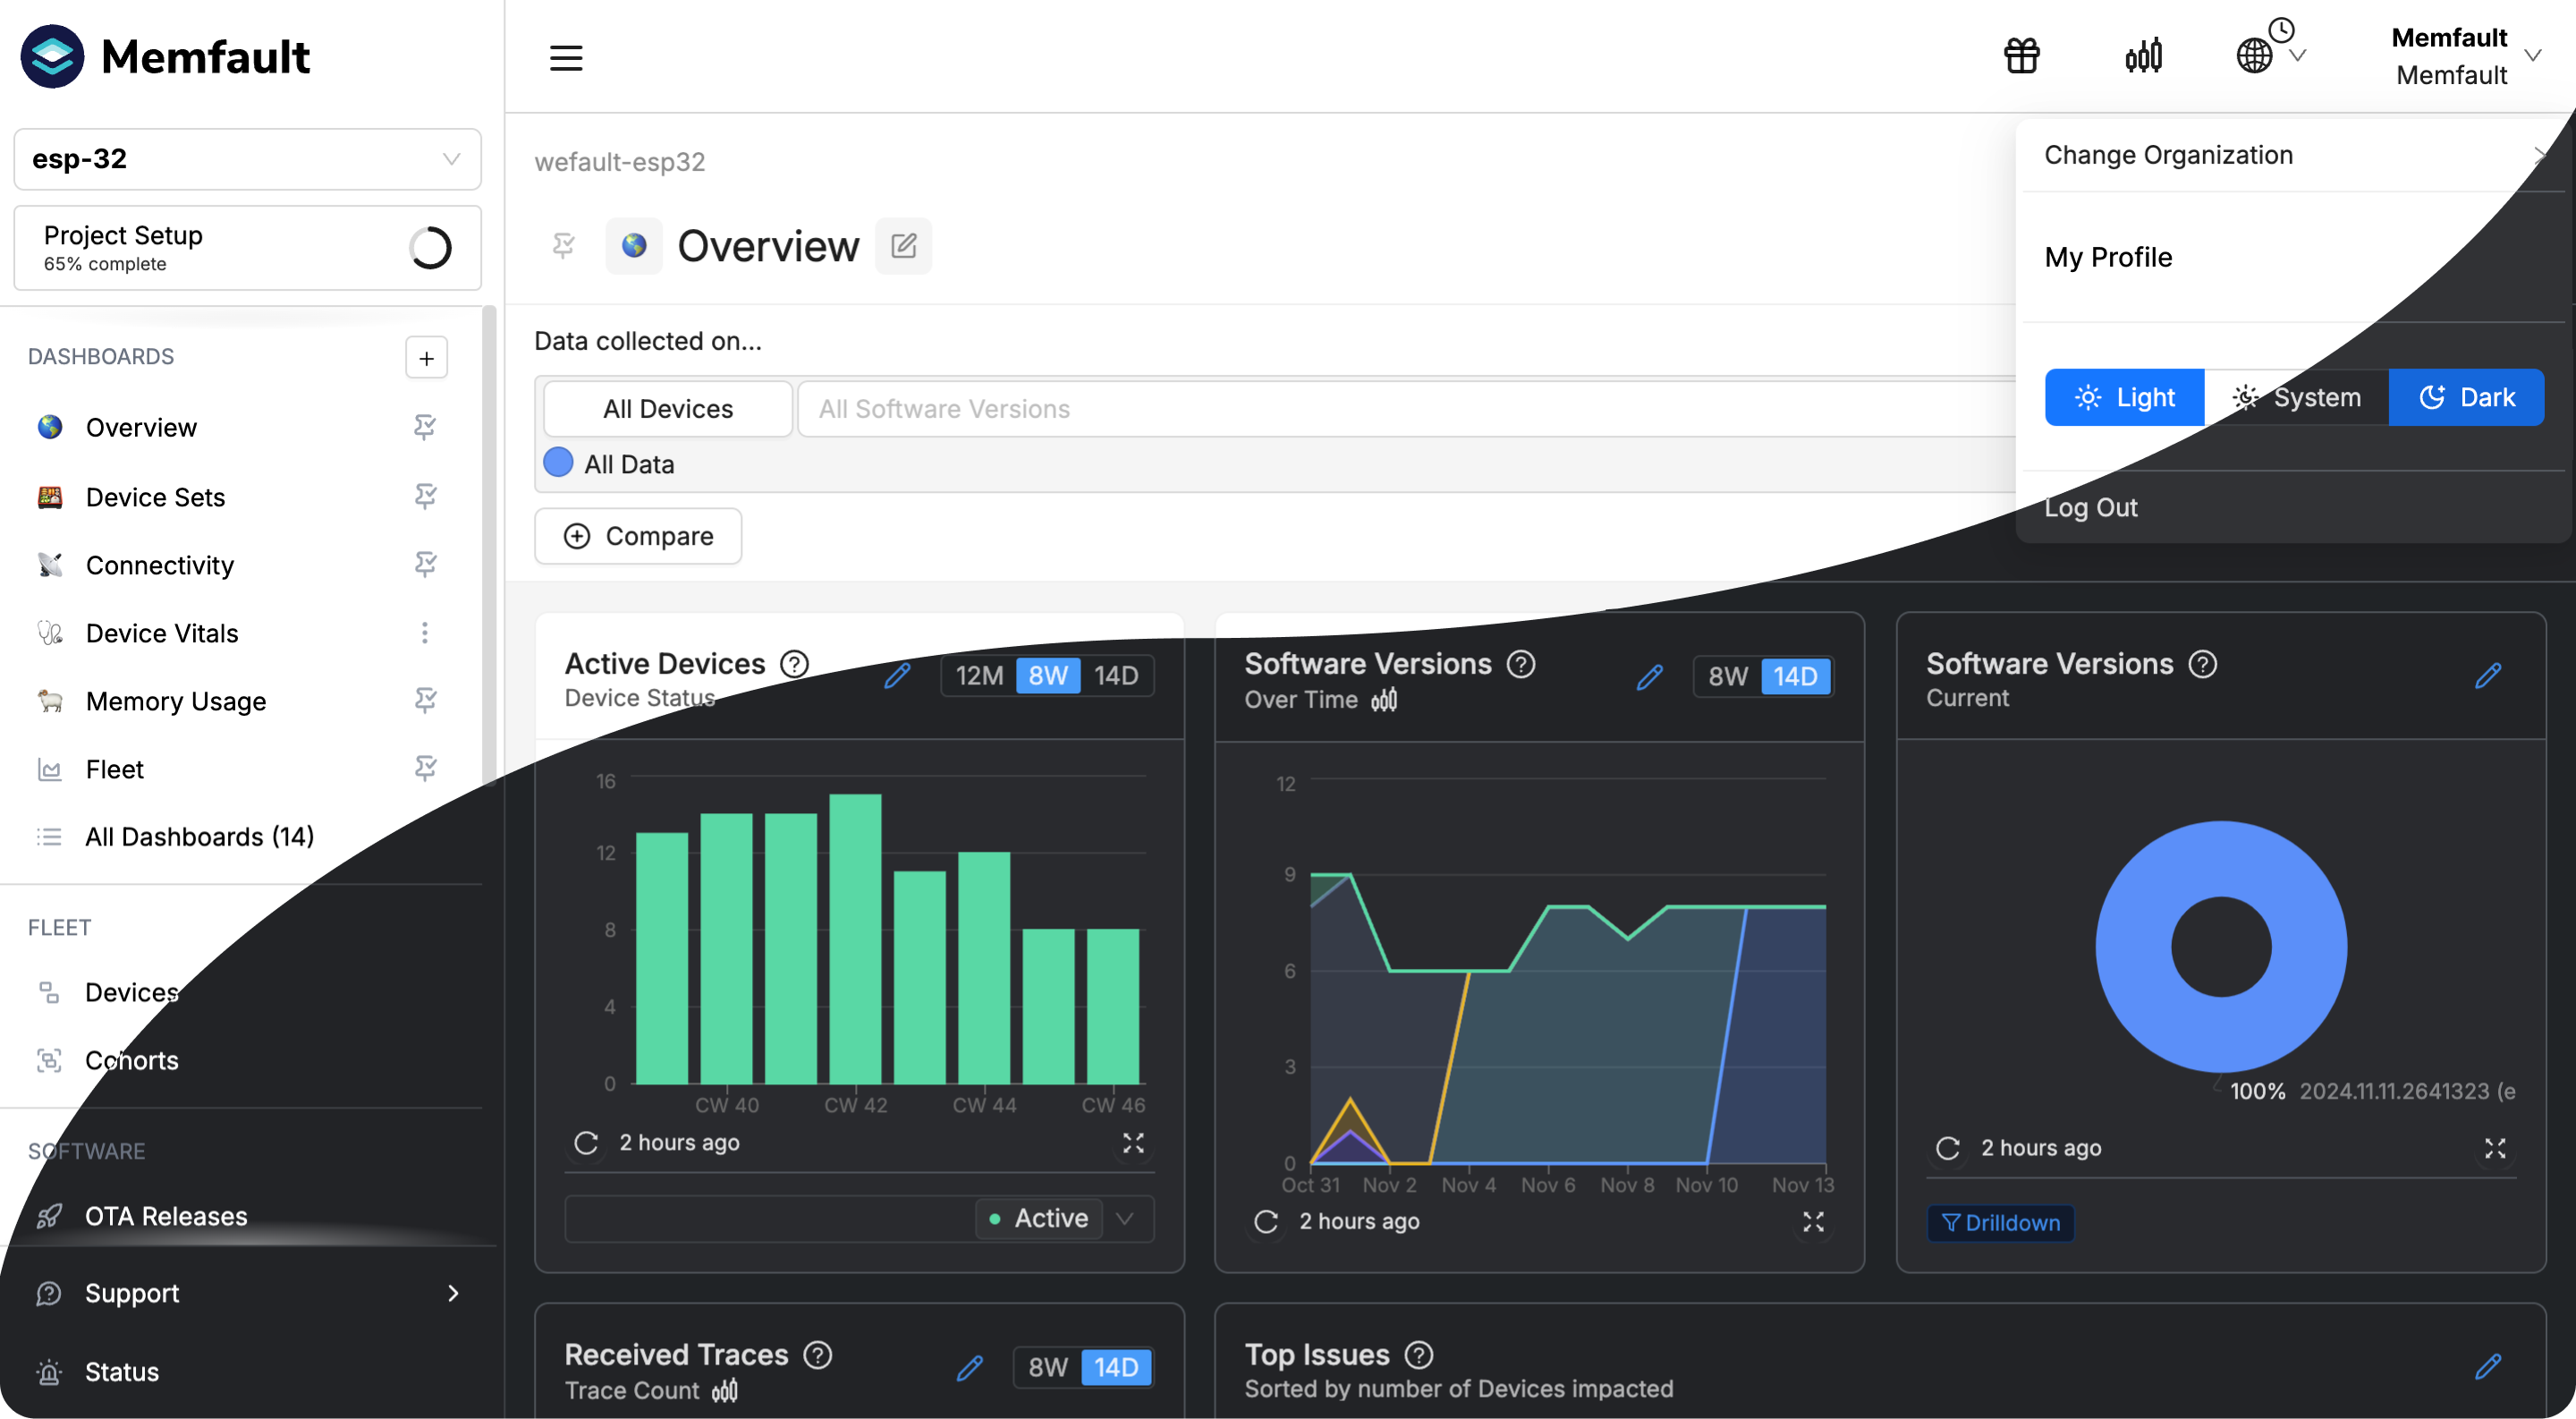
You request, we deliver. Dark Mode is now available for all Memfault users. Whether you prefer a darker interface for its sleek look or its practicality, this feature is designed to enhance your Memfault experience.
- Switch between Dark and Light mode, or use your System Settings under the profile dropdown in the top right corner.
General
Added
- Ability to pin/unpin metrics to be filtered on the Device Timeline.
- Added data type indicators to Metric selection dropdowns.
- Support for relative dates in Device filters.
- We now display the associated Hardware Version in the OTA Payload selector.
- Ability to define org-wide key Dashboards to all users.
- Added support for update-only mode in Devices CSV Import.
- Add Metric Descriptions that appear when hovering on the Timeline.
- Added 'Introduced in Software Version' and 'Latest affected Software Version' in Issue Details
- Added Dark Mode, all users can choose between Light / System / Dark modes.
Improved
- Replaced technical comparison operators like
>=with their natural mathematical symbols like≥along with clear labels. - The 'Last Seen' filter now defaults to relative time range.
- Enhanced the Current Software Versions pie chart to switch to a stacked bar chart when multiple dashboard filters are used.
- Replaced Trace Count based percentages with percentage of Devices impacted by Software Version on the Issue Distribution Charts.
- Updated Reboot Charts to show the top 50 reboot reasons.
- Warn users when moving Devices across Cohorts if the new Cohort has an active Release.
Changed
- Optimized visibility of Traces on the Timeline.
- Removed Cohort Distribution from the Issue Detail page.
Fixed
- Empty Metric Reports are no longer created when there are missing symbol files.
MCU
- Added automatic tagging of devices with the 'user-agent' that was used to submit data to our servers.
SDK versions 1.13.0, 1.14.0, 1.15.0, and 1.16.0 were released. Some highlights include:
Added
- Introduced
memfault_reboot_tracking_load()/memfault_reboot_tracking_save()functions for custom reboot tracking data handling. - Added
memfault_port_coredump_save_begin()callback for custom pre-coredump operations. - Improved API documentation for events and data packetizer components regarding ISR context usage.
Removed
- Removed support for Zephyr < 2.7.0, nRF-Connect SDK < 1.9.2, and ESP-IDF < 4.4.0.
Android
We did not publish a new version of the Bort SDK in October 2024.
Linux
- Fixed a bug where Crashed Program Name was missing from the issue title of New Linux Issues.
SDK version 1.15.1 was released. Highlight:
- Fixed a bug in the release process that allowed the Cargo lock file to get out
of sync with other published crates, causing a build failure when building
with
-locked.
CLI
We did not publish a new version of the memfault-cli in October 2024.