October 2023
Export lists of Devices as a CSV
Users can now bulk export lists of Devices and associated information as a CSV file. Use filters as normal to define the desired list of Devices and then export that list as a CSV. Once the CSV is generated it will be emailed to the user. This makes it easy to share information on specific groups of Devices to teams in the organization outside of Memfault for the purpose of further processing in external tools or scripts for logistics, reporting, etc.
By default on export the CSV will include basic information about the Device such as serial number, Cohort, software and Hardware Version etc. and a user can also choose to include Device Attributes in the export if required.
See data in Metric charts as soon as it's received
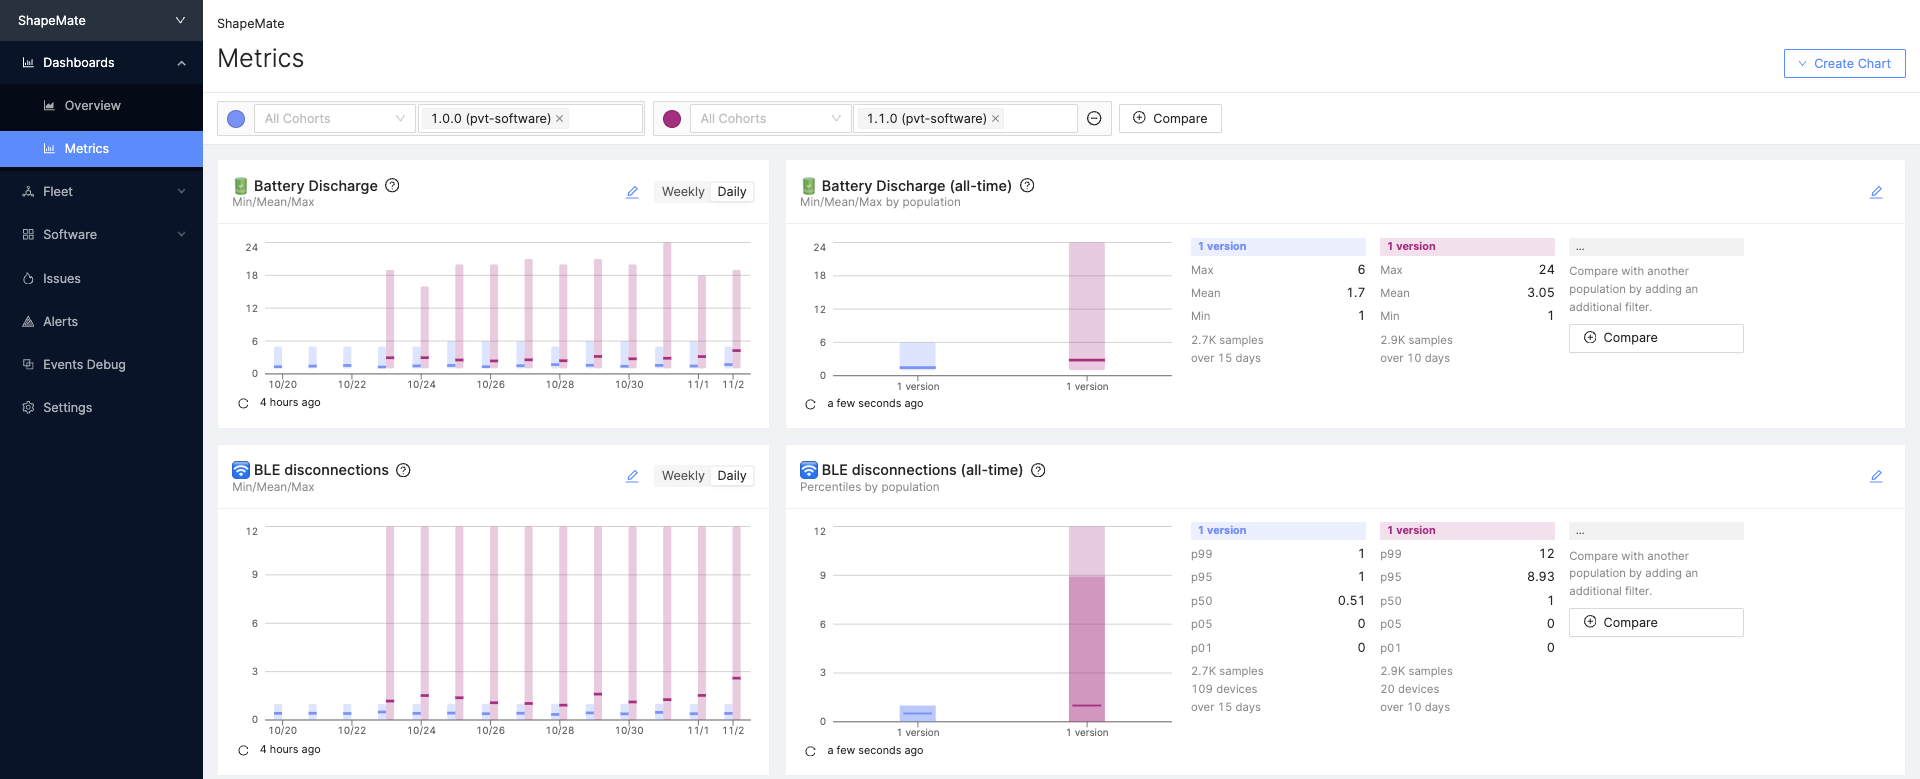
Data in Metric charts is now available in "real-time" once received. Previously, data in Metric charts only updated once the day in UTC completes and this would add some delay in the insights the Metric charts were able to provide. Now the Metric data collected from devices is visible in Metric charts as soon as it is received by Memfault.

Memfault Metric charts now display data in "real-time"
This enhancement will allow users to react quicker to undesirable changes in behavior and provide closer to real-time information during significant events like software version roll-outs. Currently, this change is only applicable to Metric charts and does not apply to other chart types (e.g. Issues charts, Device set charts, etc).
General
- Added: Ability to export lists of Devices from the Device search page as a CSV.
- Added: Ability to download a Coredump which failed to process from the Device Timeline popover.
- Added: Documentation on what FQDN Memfault calls and cellular sync frequency.
- Added: User web-app cookie preferences banner and profile settings.
- Improved: Enable real-time metric chart data, instead of aggregate values processed once a day.
- Improved: Various UI glitches and improvements (display the effective device number for sampling quotas instead of only manually-assigned devices, sort missing symbol file errors starting with most recent, smear out timestamps for multi-part chunks, addressed Global & Statics data retrieval bug on Firefox, enforce whole numbers on axes for charts that present counts)
- Fixed: Prevent accidental double rate-liming for reboot and trace/heartbeat events.
MCU
- Added: Pair Qualcomm P0 MiniCoredumps with an Apps P1 Coredump
- Added: A
Linked P0 Dumpbadge to indicate P0 coredumps are linked and aBuilt-inbadge for recognizing built-in trace attributes to the Trace details page. - SDK versions
1.3.3,
1.3.4,
1.3.5,
1.4.0
and
1.4.1
were released. Some highlights:
- Added: Support for a "zero-config" integration on ESP-IDF. This change makes the template and platform config files optional. See the ESP32 Integration Guide section on configuration files for details.
- Added: New Zephyr Kconfig flag,
CONFIG_MEMFAULT_FAULT_HANDLER_RETURN, which will call the normalz_fatal_errorhandler at the end of Memfault fault processing instead of rebooting the system. This is useful when user code needs to run withink_sys_fatal_error_handler()just prior to system shutdown. Thanks to @JordanYates for the patch! Fixes #59. - Added: New ESP-IDF Kconfig flag,
MEMFAULT_COREDUMP_STORAGE_MAX_SIZE, which can be used to set the Memfault SDK's built-in ESP-IDF coredump storage implementation to artificially limit the maximum coredump storage size. This is useful for situations where the defaultmemfault_platform_coredump_get_regions()function is still desirable, but the coredump maximum size needs to be limited (e.g., for bandwidth reasons). - Added: Built-in heap allocation metrics by default. These can be disabled
with the
CONFIG_MEMFAULT_ESP_HEAP_METRICSKconfig flag.heap_free_bytesheap_largest_free_block_bytesheap_allocated_blocks_countheap_min_free_bytes
Android
- We did not publish a new version of the Android SDK in October 2023.
Linux
- Improved: Added basename of the executable to the Trace title in the web application.
- Changed: Removed the requirement that all Linux
.sofiles need to have a Build ID for processing coredumps. - SDK version
1.8.0
was released. In this release, we improved coredump captures and now support
different capture modes which will greatly reduce the size of coredumps and
make them more useful
(see our Coredump Guide). Some
highlights:
- Added: The coredump capture strategy can now be set to capture the thread
stacks of the crashed program or all the memory regions included in the ELF
core file generated by the kernel. This behavior is defined by
coredump.capture_strategyinmemfaultd.conf. - Added:
memfault-core-handlernow captures the program arguments in the coredump metadata. They will be displayed in the Memfault Dashboard. - Added: A device's Software Type and version can now be set
via
memfault-device-infowithMEMFAULT_SOFTWARE_TYPEandMEMFAULT_SOFTWARE_VERSIONrespectively. - Added: New configuration to set the max age of an unuploaded MAR entry
in
memfaultd.confviamar.mar_entry_max_age_seconds. Once a MAR entry's age is greater than this value it will be deleted from disk. The default is set to 7 days. - Fixed: A bug causing logs of any level to be written to the kernel logs from
the
memfault-core-handler. - Changed: The default coredump capture strategy is now 32 KB threads.
- Added: The coredump capture strategy can now be set to capture the thread
stacks of the crashed program or all the memory regions included in the ELF
core file generated by the kernel. This behavior is defined by
CLI
- CLI versions 1.0.3 and
1.0.4 were released. Some
highlights:
- Added: New
upload-elf-symbolscommand for uploading ELF files with debug symbols built outside of a Yocto environment. - Added: New
upload-elf-coredumpcommand for uploading a Linux coredump to Memfault. - Fixed: A bug where
upload-aosp-symbolswould fail when uploading too many files at once.
- Added: New