Core Metrics & Device Vitals
Memfault provides support for a set of core metrics that apply to a wide range of devices. These metrics are either automatically collected by the on-device SDKs, or the SDKs have built-in facilities for enabling collection. The core metrics are also exempt from Metric and Device Attribute quotas.
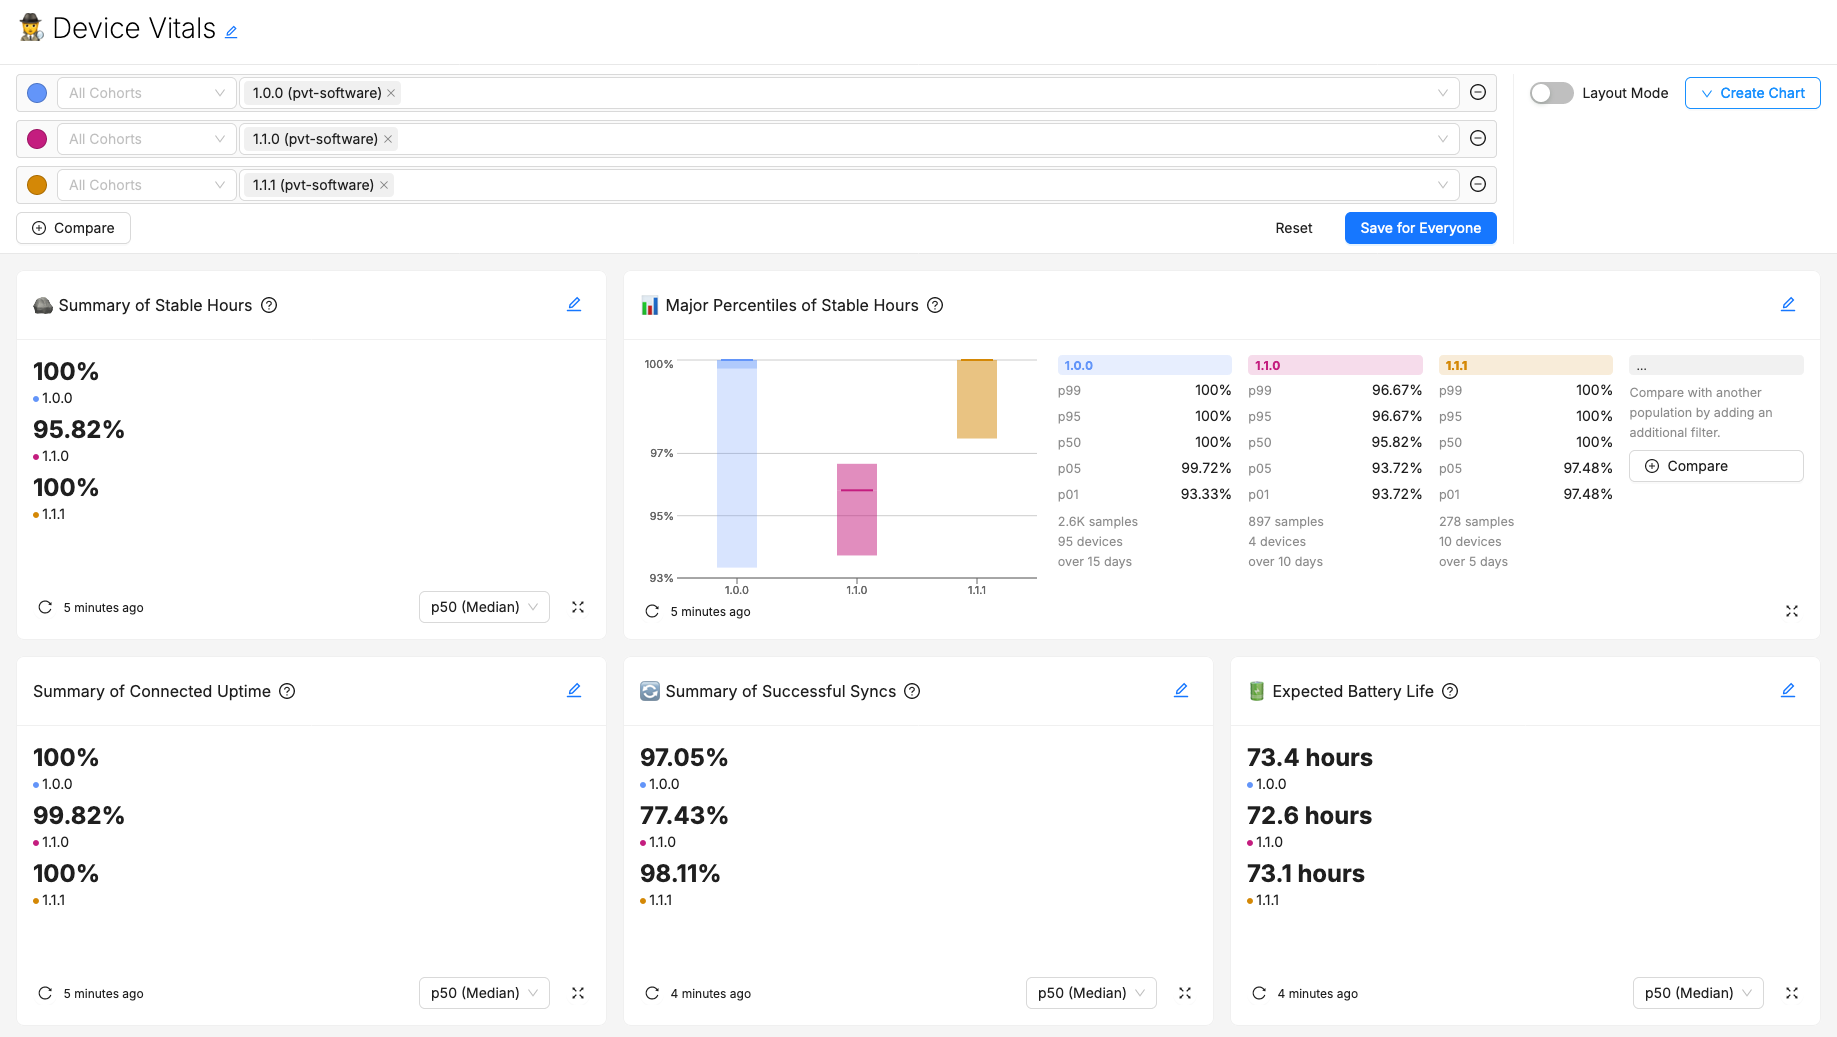
Once data is being collected, Memfault's servers will automatically process these metrics to provide a set of key insights ("Device Vitals") across your fleet. Each of the Device Vitals insights can be visualized in special pre-configured dashboard cards, which can be added to dashboards.
Required SDK Version
The appropriate SDK version needs to be integrated before these metrics can be used. See the guides linked from each platform's section for getting Memfault up and running on your devices.
| Platform | Required SDK Version |
|---|---|
| Android | >= 4.13 |
| Linux | >= 1.9 |
| MCU | >= 1.5.0 |
A summary of the Memfault Core Metrics provided by the device SDKs:
| Category | Metric Keys | Automatically Collected on these SDKs |
| Battery Life | battery_soc_pct_drop | Android |
battery_discharge_duration_ms | ||
battery_soc_pct | ||
| Stable Hours | operational_hours | Android, Linux, MCU |
operational_crashfree_hours | ||
| Stable Sessions | operational_crashes | Android, Linux |
Periodic Connectivity (custom) | sync_successful | |
sync_failure | ||
Periodic Connectivity (Memfault) | sync_memfault_successful | Android, Linux |
sync_memfault_failure | ||
| Always On Connectivity | connectivity_connected_time | Android |
connectivity_expected_time |
Battery Life
For background and principles around these metrics, see the following docs:
- Using Device Vitals to Create Useful and Powerful Dashboards
- Debugging Android Battery Life with Memfault
The Battery Life core metrics are:
battery_soc_pct: The battery's State of Charge (SoC) at the end of the Heartbeat interval, reported as a percentage from 0-100.battery_soc_pct_drop: The drop in the battery's State of Charge (SoC) during the Heartbeat interval, reported as a percentage drop from 0-100.battery_discharge_duration_ms: The time spent discharging the battery during the Heartbeat interval, in milliseconds.
SDK Collection
These metrics are standardized and supported across all Memfault SDKs, but collection varies by platform:
- Android
- Linux
- MCU
Battery metrics are collected automatically on devices running the Memfault Android SDK.
To enable battery monitoring on Linux, you can either call the SDK whenever the battery status changes, or tell the SDK how to periodically poll the battery status.
Event based battery monitoring
You can notify Memfault SDK of changes in the battery status by calling memfaultctl add-battery-reading.
Periodic battery based monitoring
memfaultd can also poll the battery status periodically. See battery_monitor
in memfaultd.conf for more details.
These instructions explain how to collect the core battery metrics in Heartbeats. To collect battery life metrics in Sessions, see the Sessions documentation.
To enable collection in the Memfault Firmware SDK, the following flag must be set:
- Zephyr
- ESP-IDF
- Other
CONFIG_MEMFAULT_METRICS_BATTERY_ENABLE=y
CONFIG_MEMFAULT_METRICS_BATTERY_ENABLE=y
#define MEMFAULT_METRICS_BATTERY_ENABLE 1
Additionally, set the scale value flag:
// Use .01 state-of-charge percentage resolution
#define MEMFAULT_METRICS_BATTERY_SOC_PCT_SCALE_VALUE 100
This scaling allows fractional percentages to be reported without using floating-point math. Several example mappings are:
| Battery % | Scale Value | Precision | battery_soc_pct in Memfault |
|---|---|---|---|
| 85% | 1 | 1% | 85 |
| 85.3% | 10 | 0.1% | 85.3 |
| 85.37% | 100 | 0.01% | 85.37 |
Use the maximum number of decimal places that your battery gauge supports to ensure the most accurate battery life estimation.
The boot function memfault_metrics_battery_boot() should be called once the
battery state-of-charge reading is available on boot.
- Zephyr
- Other
On Zephyr, memfault_metrics_battery_boot() is called by default when booting
Memfault. To control when this function is called, set
CONFIG_MEMFAULT_BATTERY_METRICS_BOOT_ON_SYSTEM_INIT=n.
On all other platforms, memfault_metrics_battery_boot() should be called by
the user. For example:
#include "memfault/metrics/battery.h"

// called by the user on system boot, once the battery state-of-charge reading is available
void memfault_platform_battery_boot(void) {
  memfault_metrics_battery_boot();
}
The SDK will automatically record the battery metrics at the end of each Heartbeat interval using the following platform function. This function must be implemented:
loading...
The value returned in sMfltPlatformBatterySoc.soc from your
memfault_platform_get_stateofcharge() implementation must be scaled according
to the MEMFAULT_METRICS_BATTERY_SOC_PCT_SCALE_VALUE configuration (default:
1).
This scale value determines how the battery percentage is represented as an
integer. The valid range for .soc is 0 to (100 *
MEMFAULT_METRICS_BATTERY_SOC_PCT_SCALE_VALUE). Using the same example mappings
as before, the associated .soc values are:
| Battery % | Scale Value | .soc Value | Precision | battery_soc_pct in Memfault |
|---|---|---|---|---|
| 85% | 1 | 85 | 1% | 85 |
| 85.3% | 10 | 853 | 0.1% | 85.3 |
| 85.37% | 100 | 8537 | 0.01% | 85.37 |
For rechargeable batteries, this function should be called when the battery stops discharging (for example, when the charger is connected or the battery is removed):
loading...
A typical implementation of those platform dependencies would look like this:
// note: tracking battery state via a static variable is not required. It is
// added here to demonstrate that battery_charge_state_changed_callback() is
// edge-triggered
static bool s_battery_is_discharging = false;

// This function is called on system initialization, to set the initial
// discharging state
void battery_set_initial_discharging_state(void) {
  s_battery_is_discharging = battery_is_discharging();
}

// This function is called by when the battery discharging state changes, i.e.:
// CHARGING → DISCHARGING or DISCHARGING → CHARGING
void battery_charge_state_changed_callback(void) {
  const bool discharging = battery_is_discharging();
  if (discharging != s_battery_is_discharging) {
    // update the state of the battery
    s_battery_is_discharging = discharging;

    if(!discharging) {
      // signal the Memfault SDK that the battery has stopped discharging
      memfault_metrics_battery_stopped_discharging();
    }
  }
}

// This function is called by the Memfault SDK at each Heartbeat interval end,
// to get the current battery state-of-charge and discharging state.
int memfault_platform_get_stateofcharge(sMfltPlatformBatterySoc *soc) {
  float soc_percentage;

  // get the battery level
  int err = battery_get_soc_percent(&soc_percentage);
  if (err) {
    MEMFAULT_LOG_ERROR("Failed to get battery level: %d", err);
    return -1;
  }

  // for rechargeable batteries, check if the battery is discharging (i.e. not
  // charging)
  const bool discharging = battery_is_discharging();

  // set the output data
  *soc = (sMfltPlatformBatterySoc){
    // scale up the floating-point percentage to be an integer with 2 decimal
    // places of precision, matching the selection of MEMFAULT_METRICS_BATTERY_SOC_PCT_SCALE_VALUE
    .soc = soc_percentage * 100f,
    .discharging = discharging,
  };
  return 0;
}
Calculation
The Memfault cloud will aggregate the average drop in the battery state of charge over time for a given device, and use that to give it an expected battery life:
For our calculations below, we'll assume that all Heartbeat intervals are one hour.
Insights
Add an Expected Battery Life card to your dashboard to see these insights.
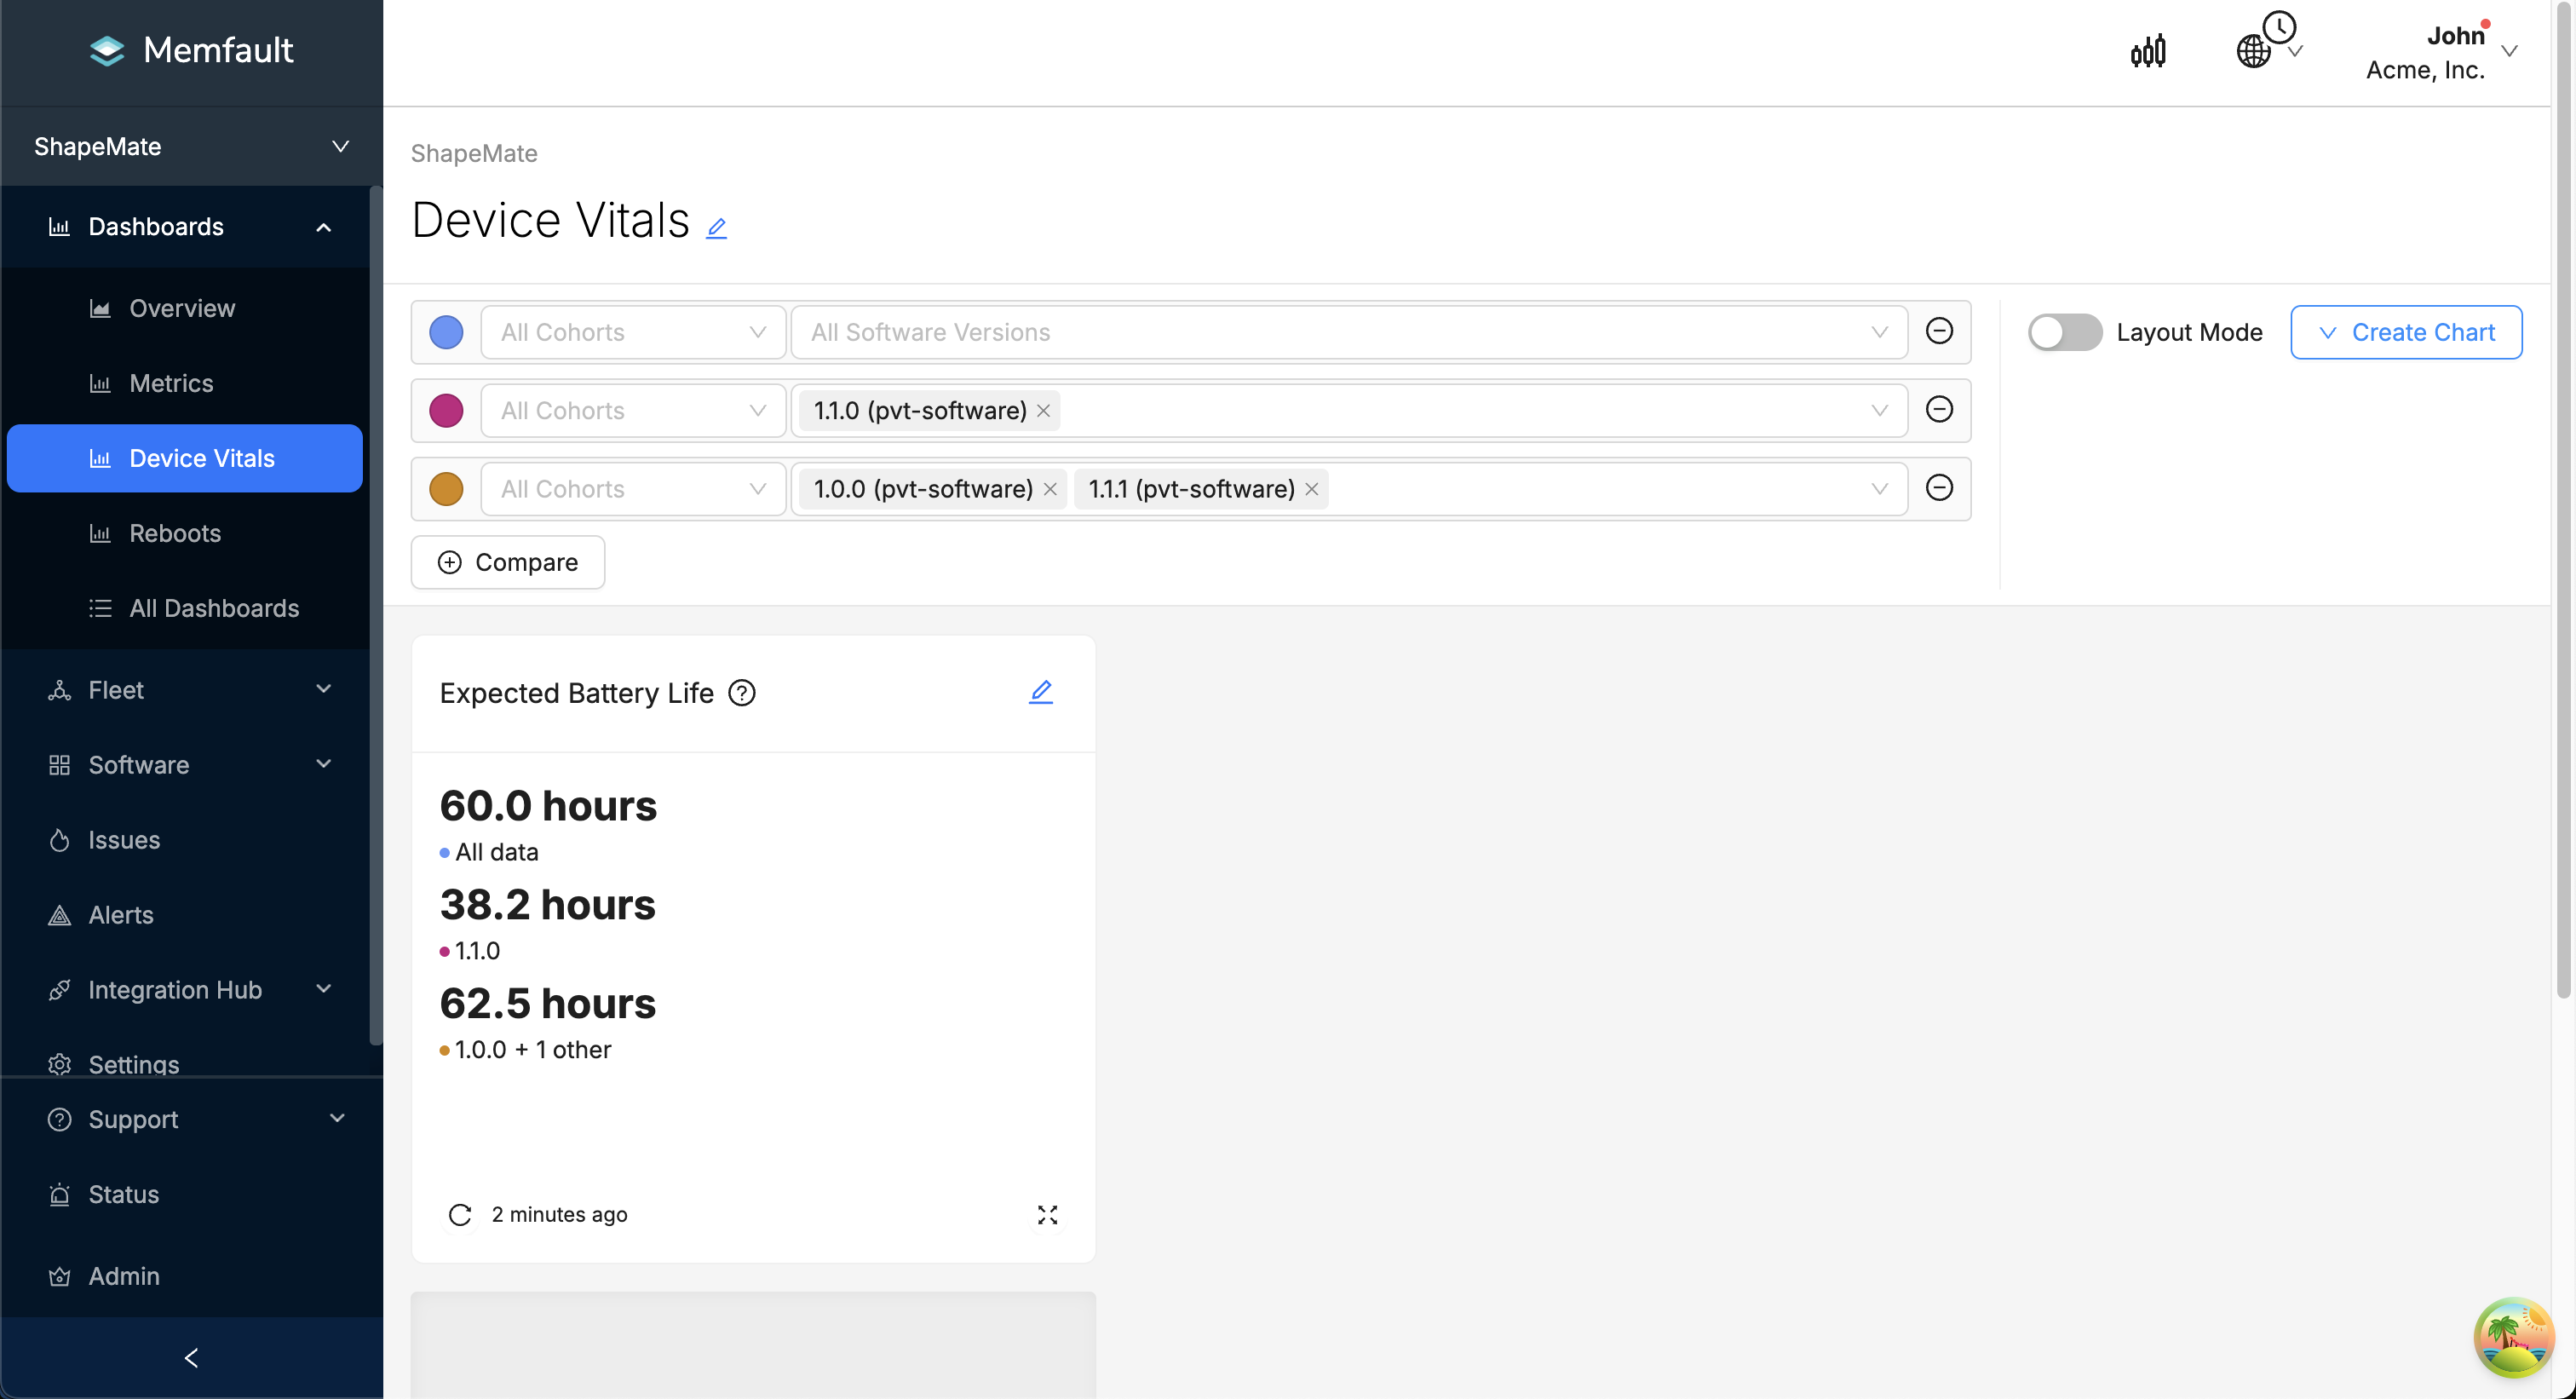
Version 1.1.0 has a worse battery life than 1.0.0.
Stable Hours
For background and principles around these metrics, see the following docs:
- Using Device Vitals to Create Useful and Powerful Dashboards
- Interrupt Article: Counting Crashes to Improve Device Reliability
The Stable Hours core metrics are:
operational_hours: The number of hours the device has been operational, since the last collection of this metric.operational_crashfree_hours: The number of hours the device has been operational without a crash, since the last collection of this metric.
The goal of these metrics is to provide a straightforward aggregate metric, "% of operational hours without crashes", that can be used to track the reliability of a fleet of devices over time and compare reliability across firmware releases.
These metrics are collected automatically by all Memfault SDKs.
On MCU, a "crash" is counted when the device restarts unexpectedly (aka "Unexpected" reboot type). On Android and Linux, a "crash" is counted when a process crashes and a trace is captured by the Memfault SDK.
These metric values increment only on continuous hours of operation. The stable hours measurement will work best when the devices regularly exceeds one hour of continuous operation. Therefore, this chart can only be used with periodic heartbeat reports.
If your device operates on sub-hour intervals (i.e. no uptime counter is maintained between sessions, or the device restarts often), Memfault recommends using "Stable Sessions" instead of "Stable Hours" to measure reliability.
Low Power Modes and Operational Hours
Devices in low power modes usually advance the necessary time value for the Memfault SDK to capture continuous operational hours through low power modes, but this is device and platform-specific:
- Android
- Linux
- MCU
On Android, the operational_hours and operational_crashfree_hours metrics
will advance through device low-power modes, and will reset if the device
restarts.
The crashfree hours algorithm currently considers ANRs, Tombstones, non-WTF Exceptions, and all Kernel Oops as crashes.
On Linux, the operational_hours and operational_crashfree_hours metrics are
paused if the device enters a suspend mode, and will reset if the device
restarts.
On MCU, the operational_hours and operational_crashfree_hours metrics will
reset on a device restart.
The Memfault SDK uses the platform-specific
memfault_platform_get_time_since_boot_ms() implementation to compute the
values for those metrics (this is implemented for you on
FreeRTOS/Zephyr/ESP-IDF). If the time returned by that function is not advancing
during low power modes, the metrics will not advance either.
Insights
Add a Stable Hours card to your dashboard to see these insights.
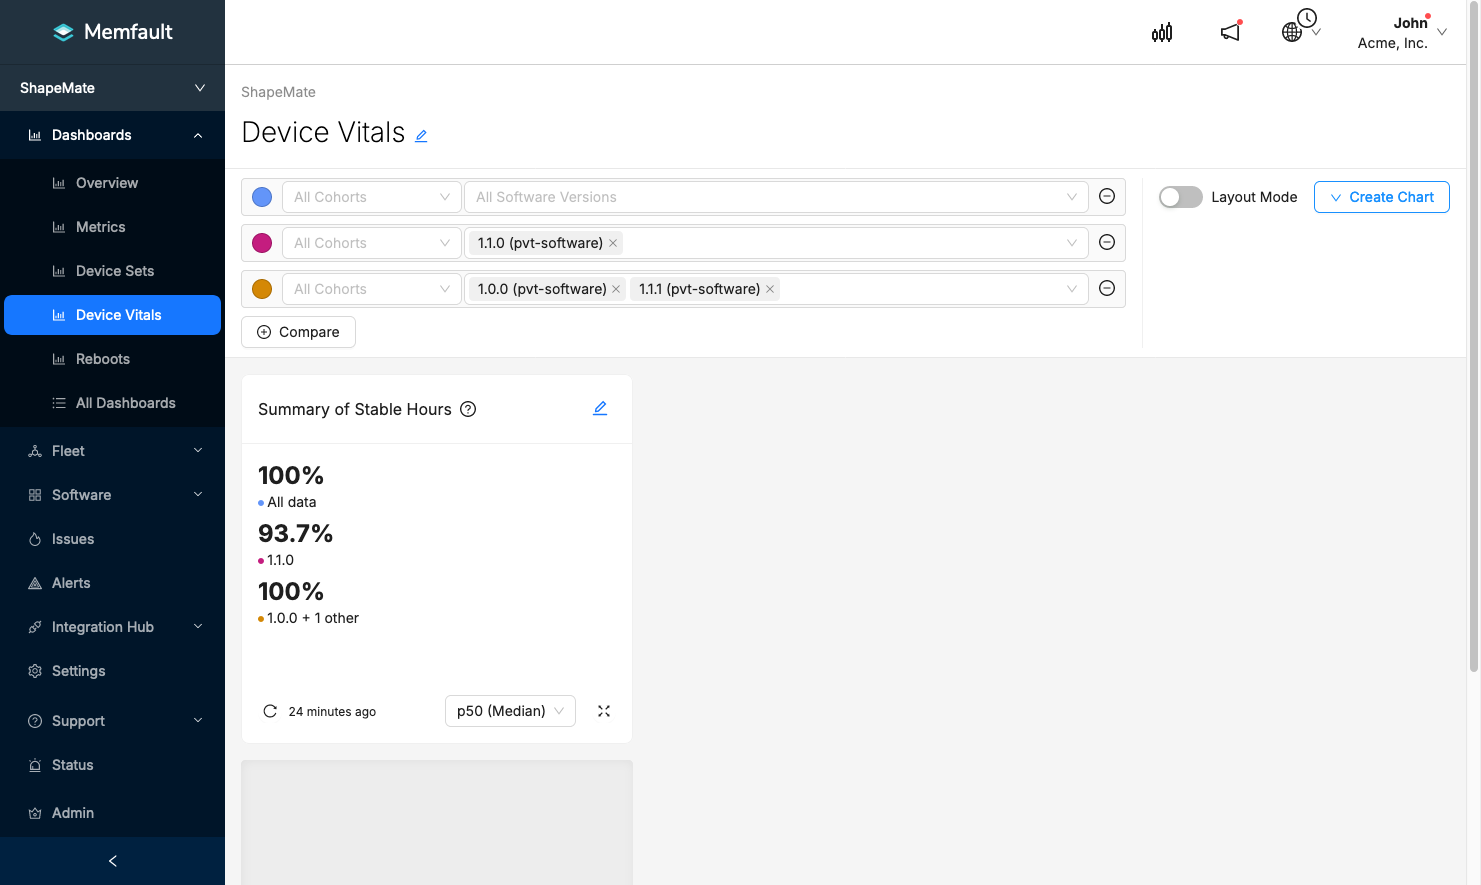
Version 1.1.0 crashes more often than other versions.
Stable Sessions
This device vital is similar to Stable Hours, except it is measuring stability in terms of sessions instead of hours. Therefore, this chart can only be used with session report types.
The Stable Sessions core metric is:
operational_crashes: The number of crashes that have occurred in the current session.
This metric is automatically collected by Linux & Android SDKs.
Insights
Add a Stable Sessions card to your dashboard to see these insights.
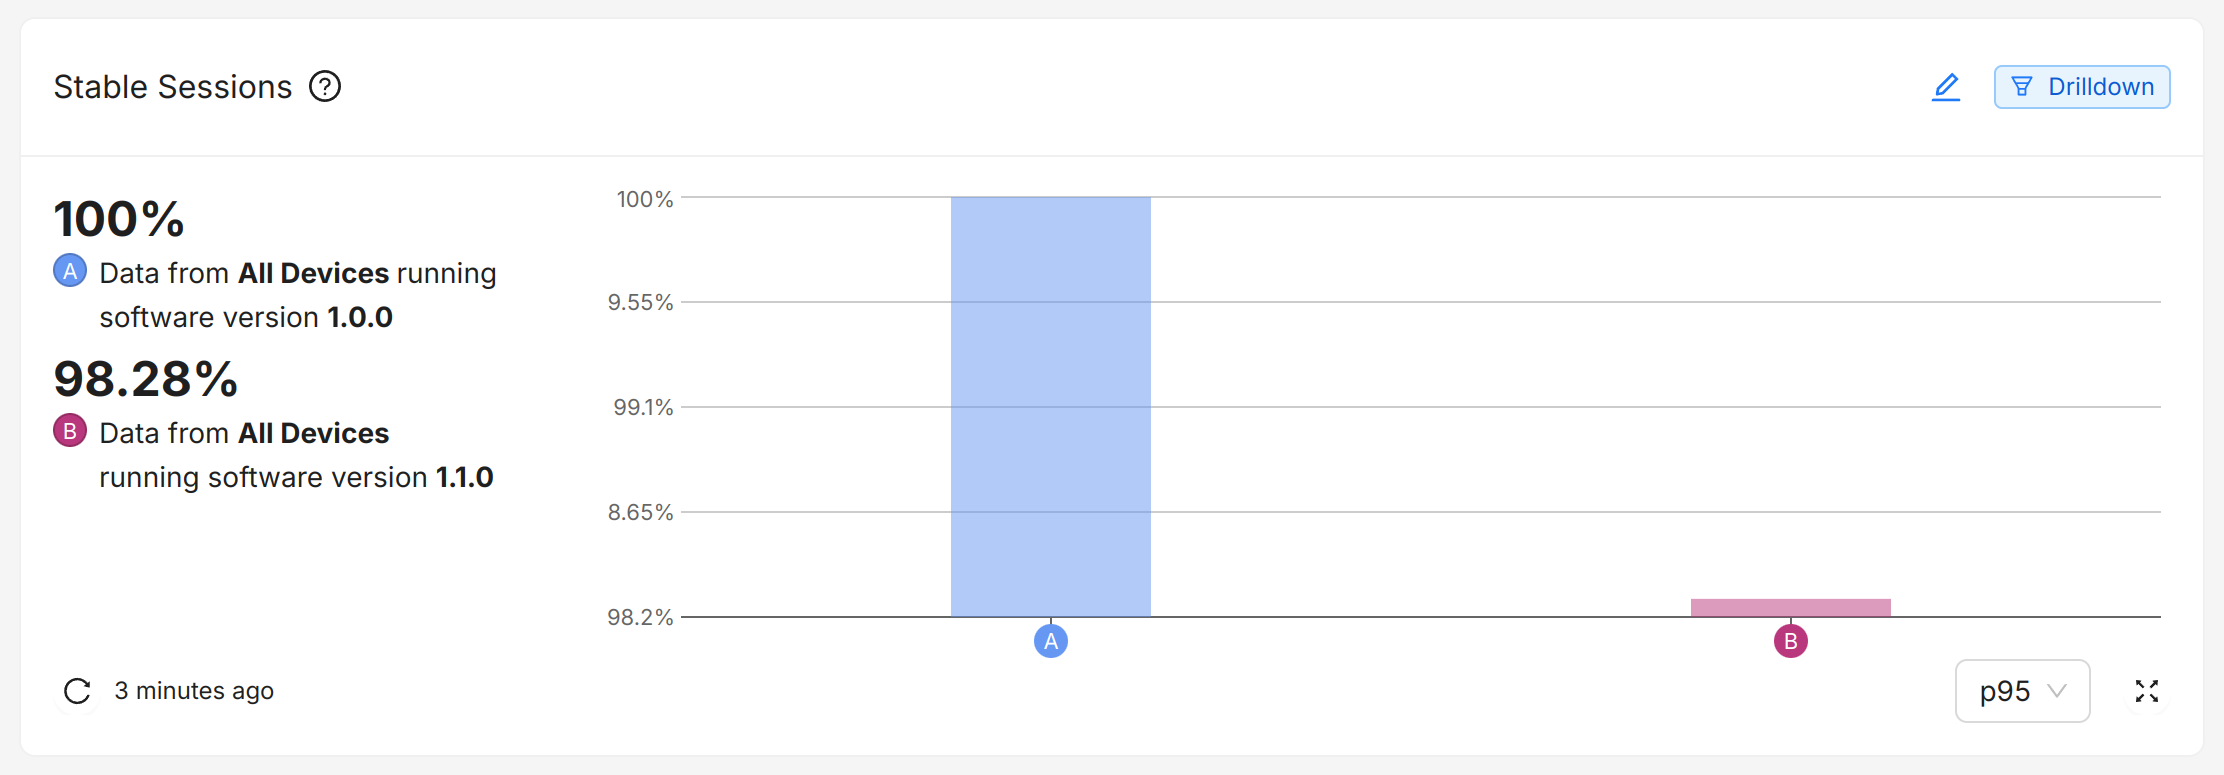
Version 1.1.0 crashes more often than 1.0.0.
Connectivity
Connectivity metrics are split into two categories:
- Periodic Connectivity: Metrics that track the success or failure of individual data sync sessions
- Always-On Connectivity: Metrics that track the uptime of the device's connectivity
Both variants of the connectivity metrics provide a similar aggregate analysis as stable hours, where Memfault can show "% of successful data syncs" or "% of connectivity uptime" for groups of devices.
Periodic Connectivity
These metrics are used to report sync success or failure for a single data sync operation:
sync_successful: The number of successful syncssync_failure: The number of failed syncssync_memfault_successful: The number of successful syncs to Memfaultsync_memfault_failure: The number of failed syncs to Memfault
The sync_successful and sync_failure metrics need to be explicitly recorded
when the device performs its data sync operation. It's up to the device to
define what data sync should be used for these metrics. For example, syncing
user configuration data for a BLE connected bird feeder might be considered a
data sync. Memfault will use these metrics to compute the success rate of the
fleet's data syncs, as follows:
SDK Collection
The SDK API for collecting these metrics varies by platform:
- Android
- Linux
- MCU
There are several options for recording successful and failed attempts for synchronizations with your backend (or any other criteria you'd like to use for connectivity).
The Kotlin reporting-lib has built-in support for syncs using the
Reporting.report().sync() API on versions 1.4+.
If the Kotlin library is not available, a Counter metric with the special
metric names sync_successful and sync_failure for success and failure
events, with sumInReport = true, can be used as well.
To record successful and failed attempts to synchronize with your backend, call
memfaultctl report-sync-success and memfaultctl report-sync-failure
respectively.
Periodic connectivity metrics must be enabled by setting the following flag in
memfault_platform_config.h:
// Enable the sync_* metrics
#define MEMFAULT_METRICS_SYNC_SUCCESS 1
The API for collecting these metrics is:
loading...
For example, to record a successful sync:
void my_data_sync_complete_callback(bool success) {
  if (success) {
    memfault_metrics_connectivity_record_sync_success();
  } else {
    memfault_metrics_connectivity_record_sync_failure();
  }
}
Synchronization to Memfault
- Android
- Linux
- MCU
The sync_memfault_* metrics are automatically collected by the Android SDK.
The sync_memfault_* metrics are automatically collected by the Linux SDK.
On MCU, these metrics are automatically enabled on HTTP-enabled projects using Zephyr RTOS (including the nRF-Connect SDK) and the ESP-IDF SDK; other platforms can manually record those metrics by enabling the API and calling it directly when syncing Memfault data:
// Enable the sync_memfault_* metrics
#define MEMFAULT_METRICS_MEMFAULT_SYNC_SUCCESS 1
loading...
Always-On Connectivity
Devices with continuous connectivity can use these metrics to track the relative uptime of their connectivity:
connectivity_connected_time_ms: The time spent connected, in millisecondsconnectivity_expected_time_ms: The time expected to be connected, in milliseconds
Examples of devices with continuous connectivity include:
- Mains powered Wi-Fi connected devices
- Cellular connected devices
- Ethernet connected devices
- Mains powered Zigbee/802.15.4/Thread devices
This connectivity metric is used by Memfault to compute relative uptime, as follows:
SDK Collection
Always On Connectivity Metrics collection varies by platform:
- Android
- Linux
- MCU
Automatically collected on Android.
For the purpose of computing connectivity_expected_time_ms versus
connectivity_connected_time_ms, the Android SDK expects that the device should
always be connected to a network while it is online, and computes how long it
was not connected to any Network according to ConnectivityManager's
Network Capability
(Wi-Fi, Ethernet, Cellular, etc) checks.
Connectivity does not currently account for Internet connectivity (so the device can be connected to a Wi-Fi network with no Internet access), only network connectivity.
Connectivity monitoring is not enabled by default. To turn it on, add the
following block to your /etc/memfaultd.conf:
{
  "connectivity_monitor": {
    "interval_seconds": 10,
    "targets": [{ "host": "8.8.8.8", "port": 443, "protocol": "tcp" }]
  }
}
On the interval, memfaultd will attempt a connection to the listed targets in
order. If at least one connection is successful, memfaultd will consider the
device connected to the network the target(s) are on.
For the purpose of computing connectivity_expected_time_ms, memfaultd will
consider that the device is always expected to be connected to the specified
network when the connectivity_monitor is enabled.
For devices with multiple connectivity pathways (Ethernet/Wi-Fi/LTE, for example), Memfault recommends tracking the high-level system connectivity of the device, independent of physical transport: the device is considered connected if the external network is reachable.
Always-on connectivity metrics must be enabled by setting the following flag in
memfault_platform_config.h:
#define MEMFAULT_METRICS_CONNECTIVITY_CONNECTED_TIME 1
To implement the metric, the Memfault Firmware SDK provides the following API for recording connectivity state changes:
loading...
For example:
void connectivity_state_changed_callback(bool connected) {
  if (connected) {
    memfault_metrics_connectivity_connected_state_change(
      kMemfaultMetricsConnectivityState_Connected);

  } else {
    memfault_metrics_connectivity_connected_state_change(
      kMemfaultMetricsConnectivityState_ConnectionLost);
  }
}
Insights
Add Connectivity cards to your dashboard to see these insights.
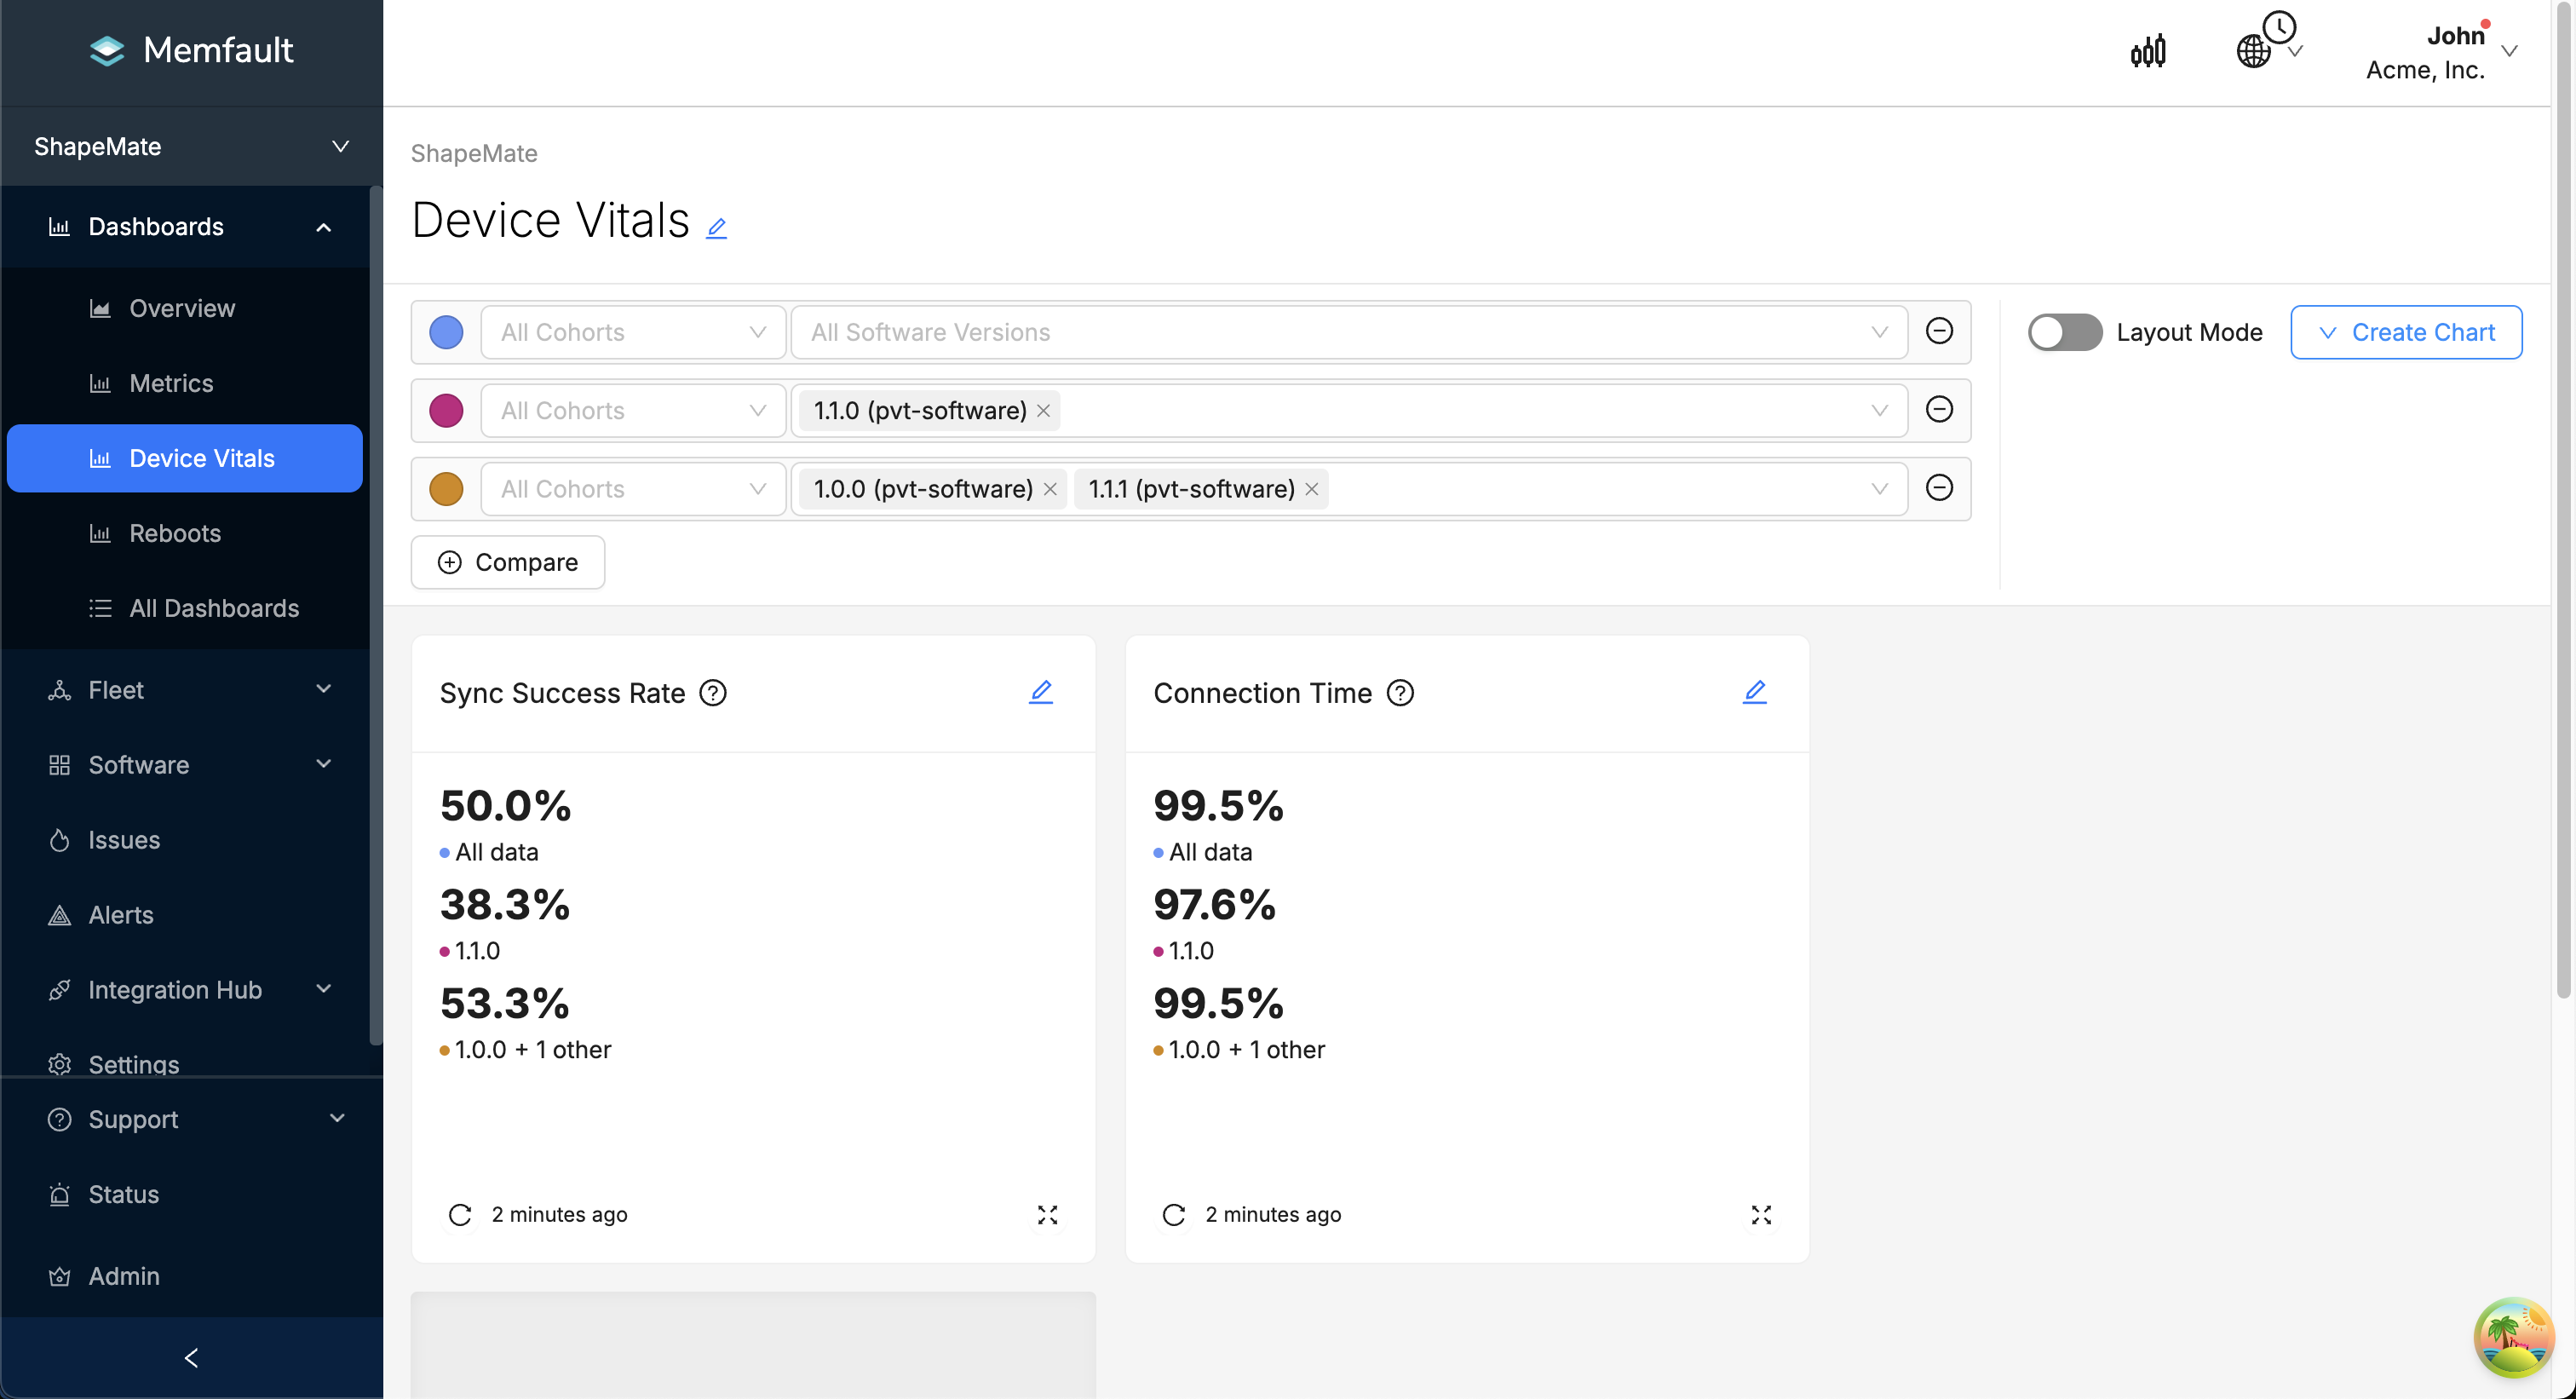
Version 1.1.0 experiences more connection difficulties than other versions.
Flash Wear
Flash wear metrics are used to provide flash lifetime estimations so you can detect regressions across releases.
The following metrics are used to report flash usage:
- Android
- Linux
- MCU
Contact us for more information!
Contact us for more information!
flash_(device_)?erase_bytes: The number of bytes erasedflash_(device_)?write_bytes: The number of bytes writtenflash_(device_)?lifetime_remaining_pct: JEDEC lifetime %, 0-100 (typically used for eMMC devices)
The device specifier correlates to the type of flash (e.g. internal, spi,
sd, emmc, and nand). It is optional and user-defined, Memfault will accept
any metric matching this regex:
flash_(?:(?<device>.*)_)?lifetime_remaining_pct.
Memfault will use these metrics to compute the fleet's wear rate in years, as follows:
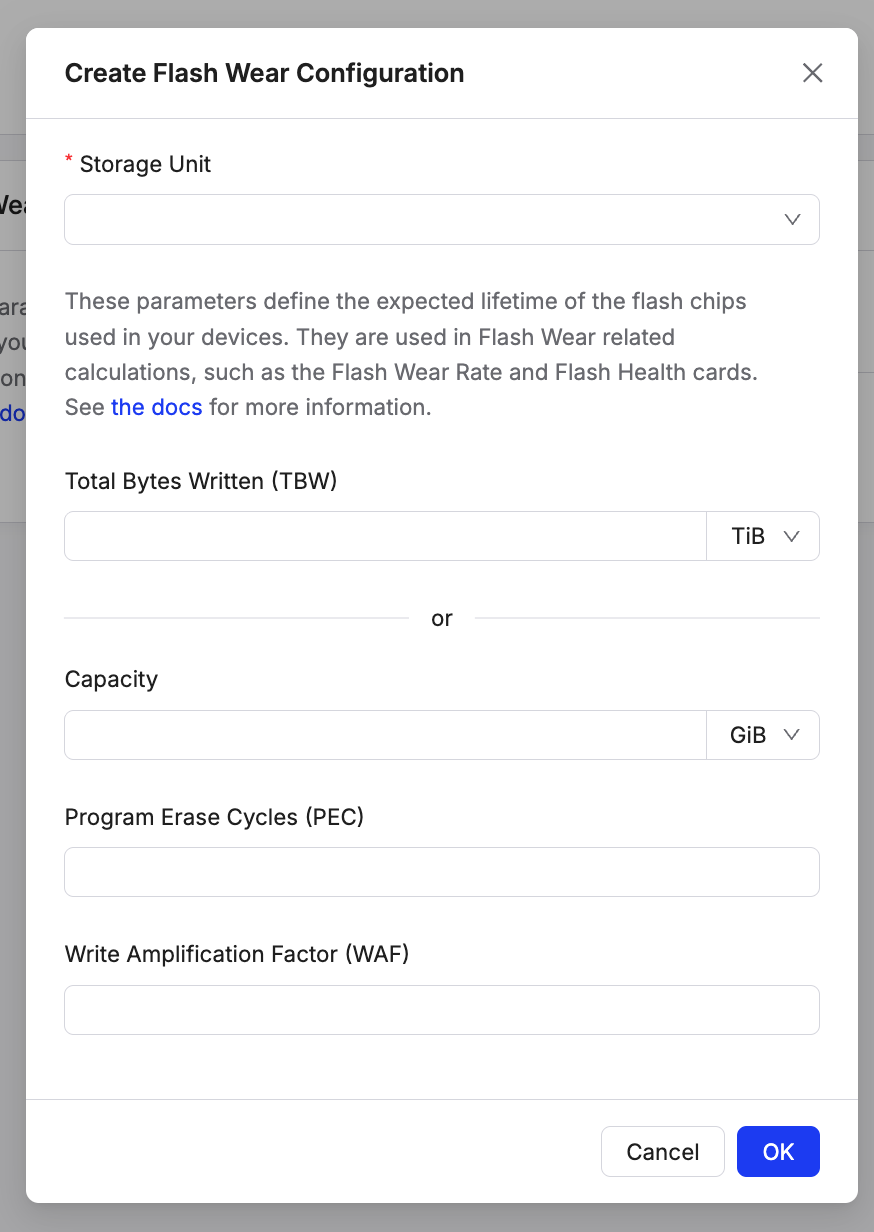
Flash Wear Configuration
Total Bytes Written (TBW) can either be provided directly or Memfault can calculate it as follows:
Provide either TBW or Capacity, PEC, and WAF in the Flash Wear configuration page in your Project Settings:
SDK Collection
The SDK API for collecting these metrics varies by platform:
- Android
- Linux
- MCU
Contact us for more information on tracking flash wear on Android!
Contact us for more information on tracking flash wear on Linux!
First, define these metrics in your heartbeat configuration file, e.g. for a eMMC device:
// Define flash wear counters
MEMFAULT_METRICS_KEY_DEFINE(flash_emmc_write_bytes, kMemfaultMetricType_Unsigned)
MEMFAULT_METRICS_KEY_DEFINE(flash_emmc_erase_bytes, kMemfaultMetricType_Unsigned)
// Optionally, lifetime remaining percentage (for devices that support this)
MEMFAULT_METRICS_KEY_DEFINE(flash_emmc_lifetime_remaining_pct, kMemfaultMetricType_Unsigned)
Then, instrument your platform's flash write and erase functions to increment
the corresponding Memfault metrics throughout the heartbeat, or set once at the
end of the heartbeat in
memfault_metrics_heartbeat_collect_data().
See the
MCU Metrics API for
more detail. Contact us if you need support
with instrumentation!
Insights
Add Flash Wear cards to your dashboard to see these insights.
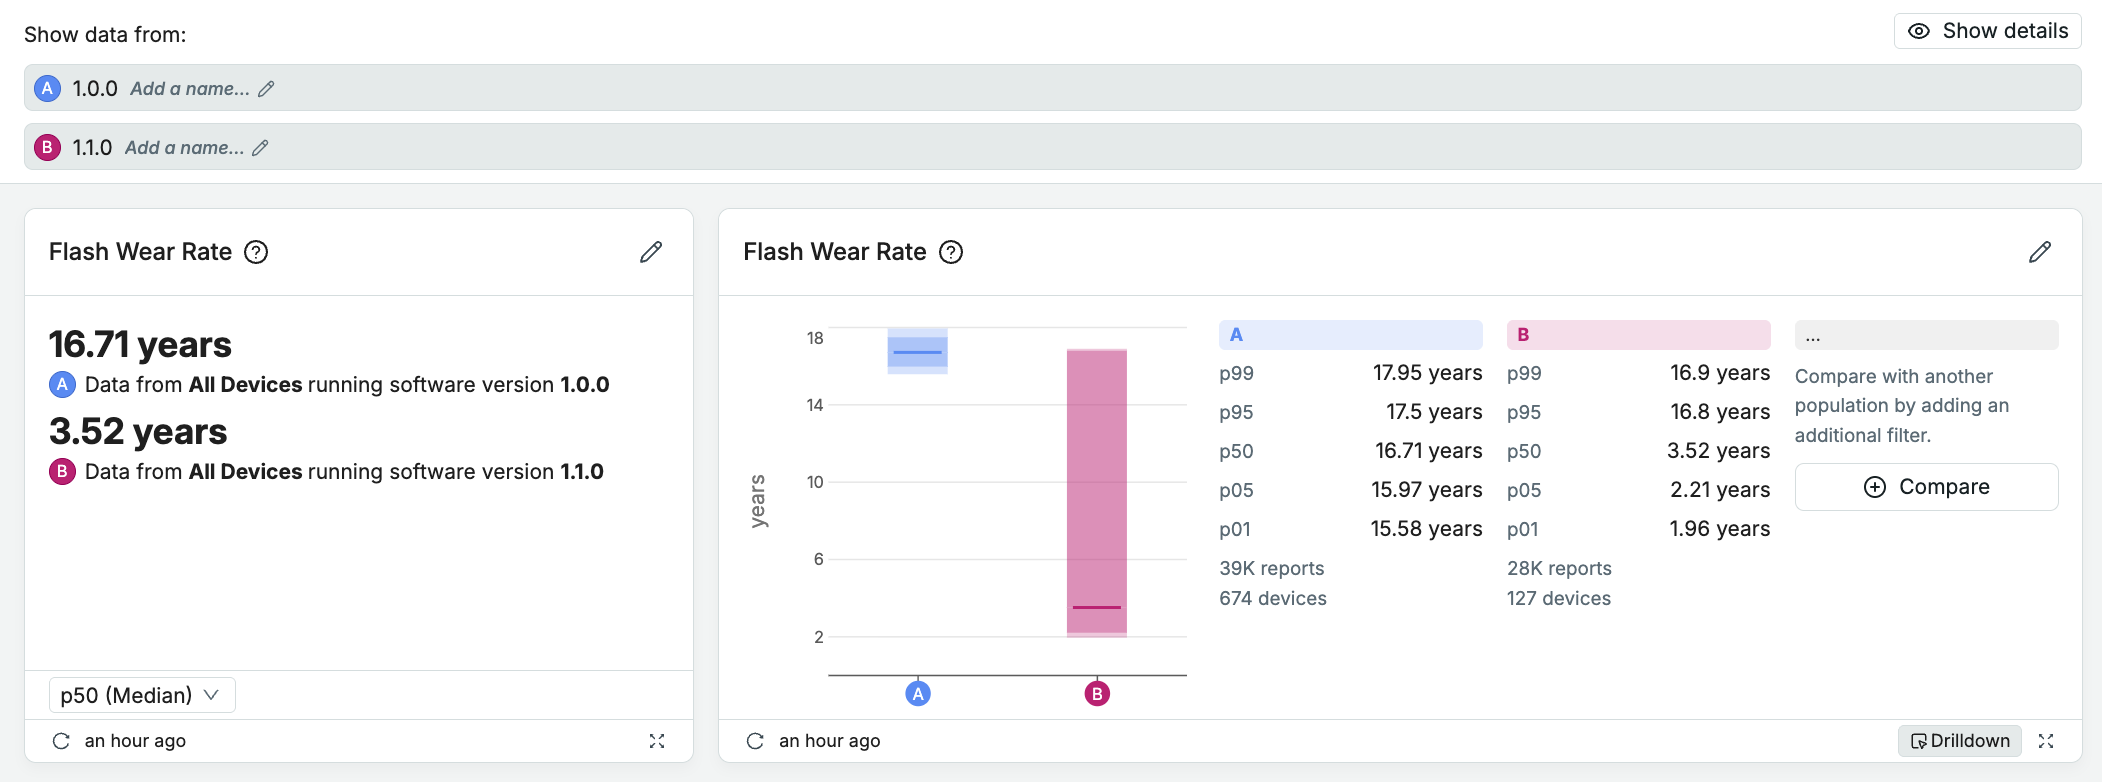
Version 1.1.0 experiences a more aggressive flash wear rate than other versions.