December 2022
Fleet Sampling
As your fleet grows, it becomes more costly to send, process and store the data from all devices in growing fleets. With the Fleet Sampling feature, Memfault helps manage the costs for your device data bandwidth by only collecting diagnostics and performance data from a smaller, yet statistically significant, subset of a fleet that you can control at any time.
Thanks to Chart Normalization, all insights to understand issues occurring across your fleet will still be at your disposal even when a only smaller number of devices are reporting from the field. For more information, please refer to the Fleet Sampling documentation.
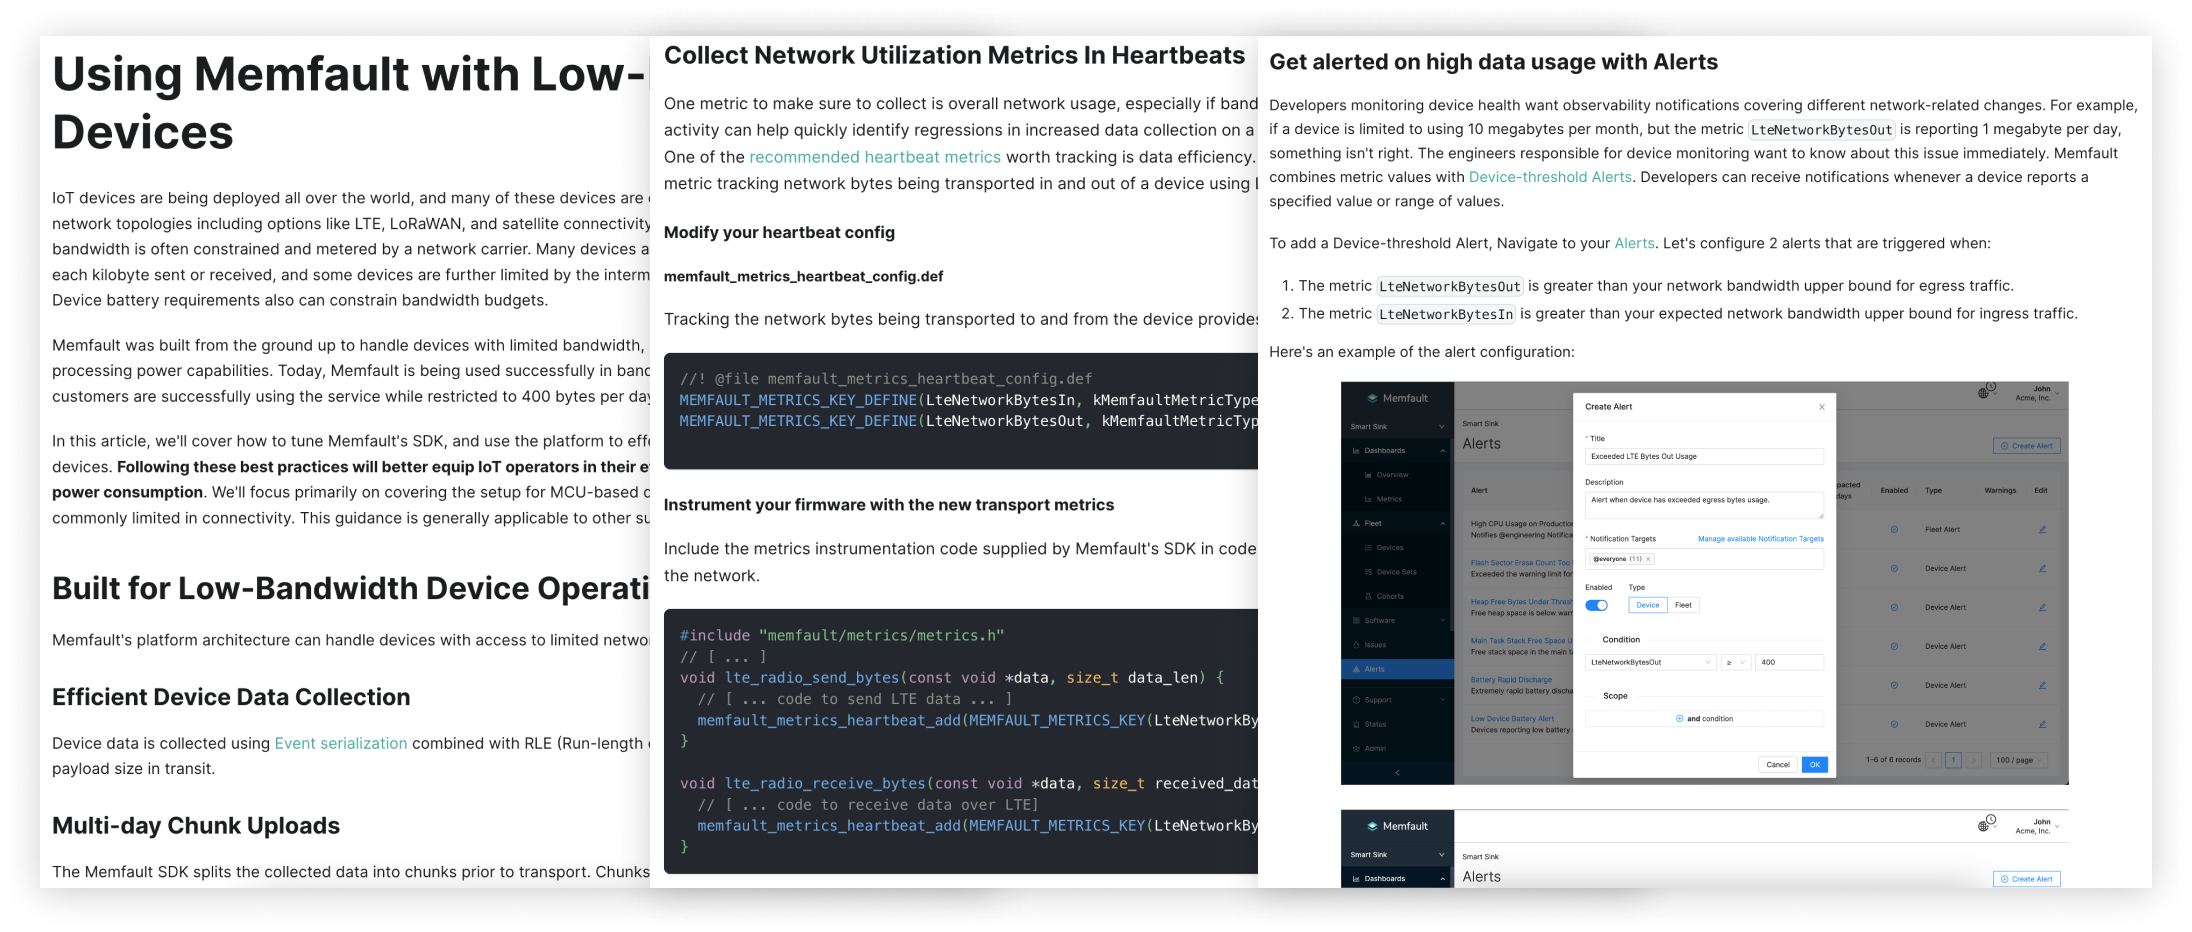
Best Practices: Low-Bandwidth Devices
Memfault was built from the ground up to handle devices with limited bandwidth, intermittent connectivity, and minimal processing power capabilities. Following the guidelines and code examples in the recently published Using Memfault with Low-Bandwidth Devices article, IoT operators can save on network costs and lower the power consumption of their devices.