June 2022
Normalized Charts
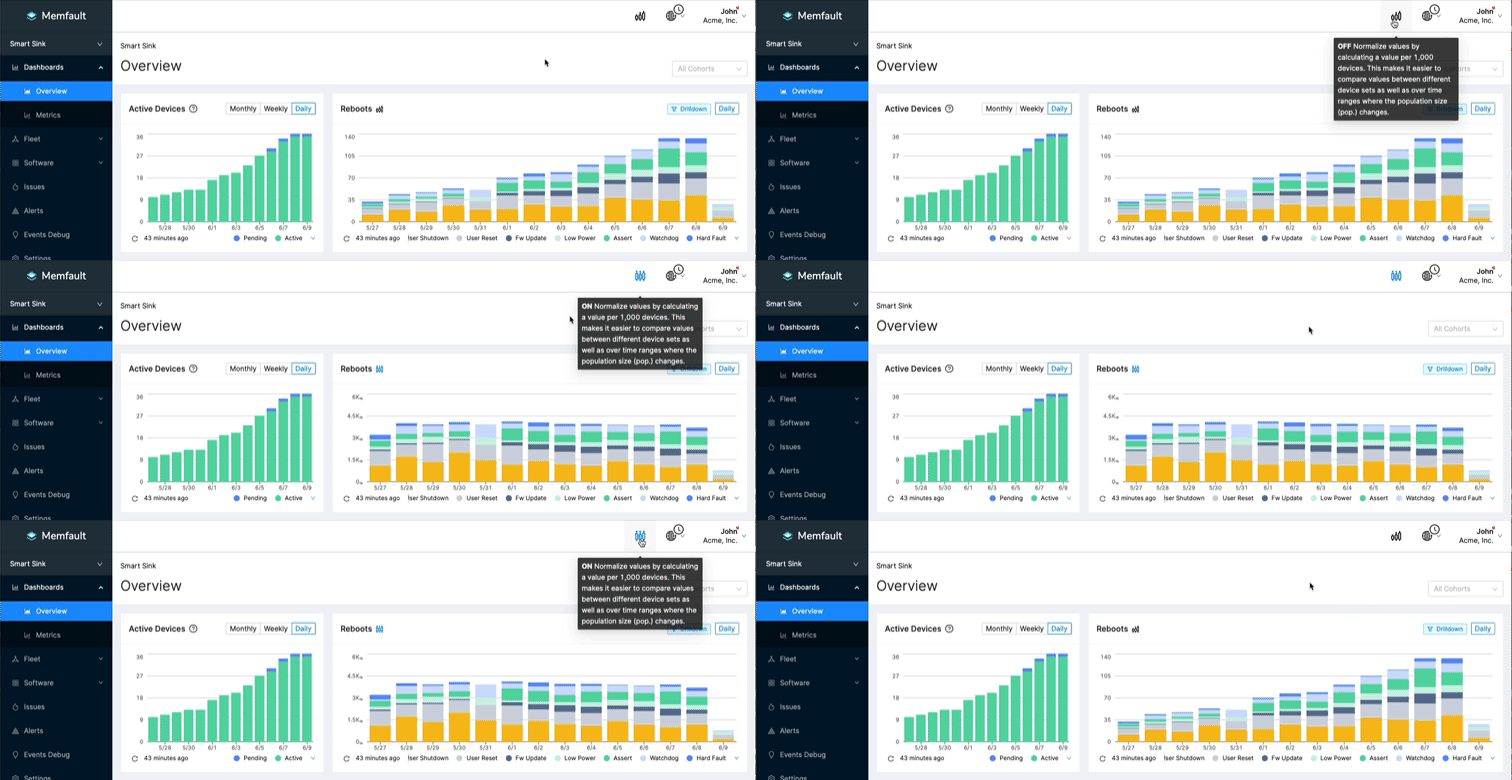
Memfault's charts can now be normalized to convert absolute values such as "number of incidents", sums, and counts to corresponding relative values "per 1,000 devices". This helps in understanding real trends when you are looking at values over time or when comparing values between populations of different sizes.

This feature also works with custom metric charts for any custom metric. It is particularly helpful to measure the success of an ongoing OTA update by comparing devices from large production Cohort "Default" against those from a smaller test Cohort "Beta". Chart normalization is also generally useful when the population size changes over time (e.g. new devices being activated continuously).
Notification Targets
Memfault improved its
notification system and how notifications will be sent
on Alerts. For each individual Alert, you can now
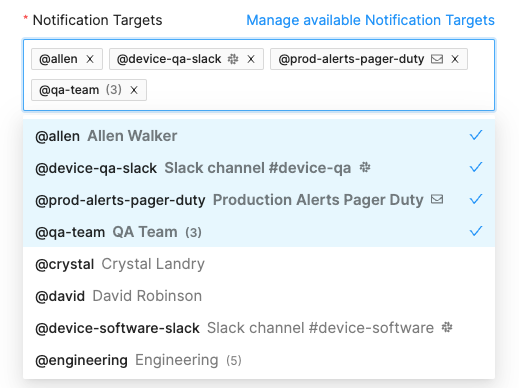
decide which team members, external systems, or groups thereof should receive an
email. All members of @team-maintenance may want to receive notifications
about devices with an abnormal battery discharge rate while a spike in
connectivity issues on the "Beta" Cohort may only be relevant in the
#beta-release Slack channel.

At
Settings → Notifications,
there are extensive options to customize the @userhandle for any team member
to connect Memfault to dedicated Slack channels or any other external system
(e.g. PagerDuty, Opsgenie) by registering external email addresses. Any
combination of these
User Handles and External Targets can be added to a Notification Group
and used to control how to notify per Alert.
General
- Added: Device Search allows searching for devices "First Seen" in a given time range
- Improved: Device Search result list on narrow screens
- Improved: Descriptions for several entries at Settings → Quotas
- Improved: Single Sign-on UI behavior and text
- Improved: UI tooltip for device with unknown software version
- Fixed: Custom Metric charts show same numbers of daily vs. weekly
- Fixed: UI glitches in different lists with very long custom reboot reasons
MCU
- Improved: Default filter range for traces list on device details include traces "in the future"
- Improved: Metric chart on device details allows 30-day window to start up to 90 days in the past
- Improved: HTTP handling of port for RT1060 MCUXpresso
- Improved: Backtrace recovery when writable ELF sections are marked as read-only
- SDK versions
0.31.0,
0.31.1,
and
0.31.2
were released. Some highlights:
- Added: Reference port for CAT1A (PSoC™️ 6) based MCUs using the ModusToolbox™️
- Added: Convenience function
memfault_http_client_post_chunkfor posting chunks via Memfault HTTP client - Added: Support for Zephyr fault handler to run after Memfault handler (see ports/zephyr/include/memfault/ports/zephyr/coredump.h)
- Improved: Quality of stack traces for
MEMFAULT_ASSERTon TI ARM Clang compiler - Improved: Support for NCS v2.0.0 and support for custom device IDs
- Fixed: HTTP implementation of Zephyr port (to not leak socket file descriptor)
Android
- Improved: Documentation of Bort's automatically collected built-in metrics
- Fixed: Mini charts for "number of bug reports" on device details page not visible
- No new version of
the Android Bort AOSP SDK was released in
June, but there is a noteworthy improvement on the
4.2-RC1 branch:
- Added: Support for non-interactive OTA installations via build settings + via SDK settings
Linux
- Added: Integration Guide for Linux + SWUpdate + hawkBit
- Improved: Automatically add Memfault Hardware Version to Memfault when first reported via hawkBit DDI
- Improved: Ability to configure hawkBit polling interval via Cohort settings (also applies random jitter)
- Improved: Expose SHA1 and SHA256 hashes for OTA payload
- Fixed: Various edge-cases when using SWUpdate