Trace Details
To get a deeper understanding of an Issue, one can view the details of a Trace under the "Details" tab of an Issue:
Depending on the configuration of the Memfault SDK and what is available on each platform, the Trace Details tab shows the following tabs:
| MCU | Android | Linux | |
|---|---|---|---|
| Threads (backtraces) | ✅ | ✅ | ✅ |
| Exceptions Info | ✅ | ✅ | ✅ |
| Logs | ✅ | ✅ | |
| Registers & Locals (variables) | ✅ | ✅ | |
| Memory Viewer | ✅ | ||
| Globals & Statics (variables) | ✅ | ||
| Heap analysis | ✅ | ||
| ISR analysis | ✅ | ||
| MPU analysis | ✅ |
If a Trace is created with missing symbols, the set of available tabs and information is limited. For example, the Globals & Statics tab only displays a warning badge indicating that these details are not available. Similarly, the Registers & Locals tab displays only registers, and the Threads tab only displays frame addresses.
Threads & Backtraces
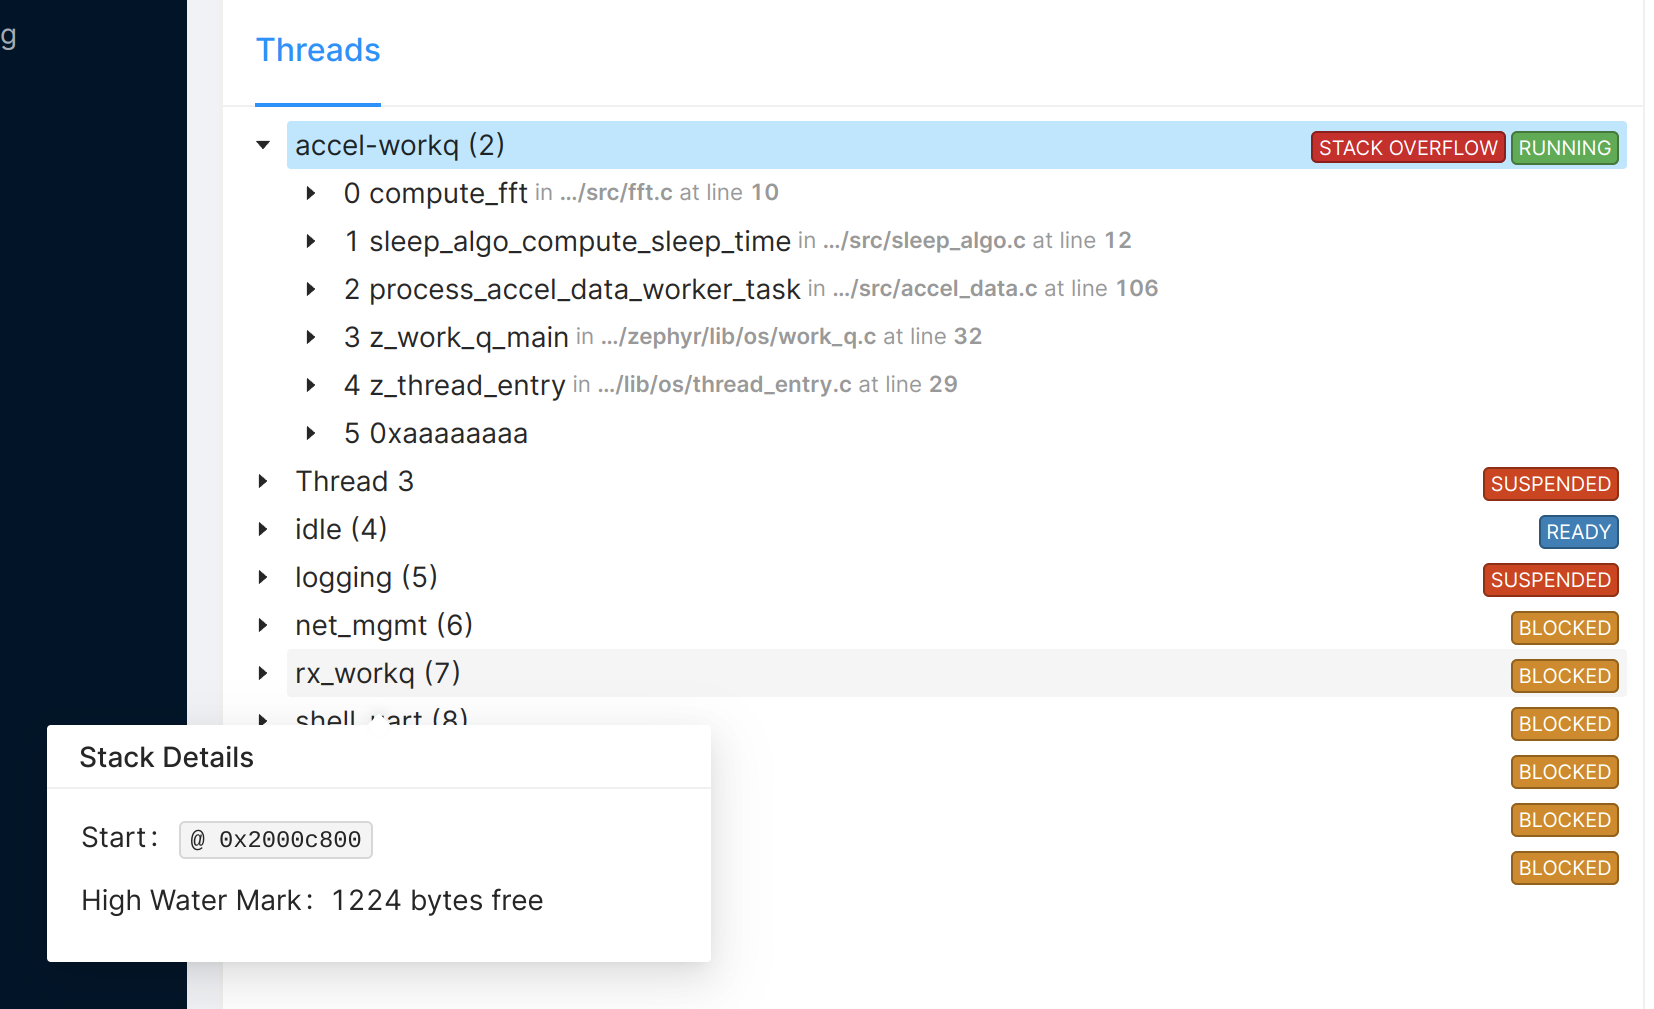
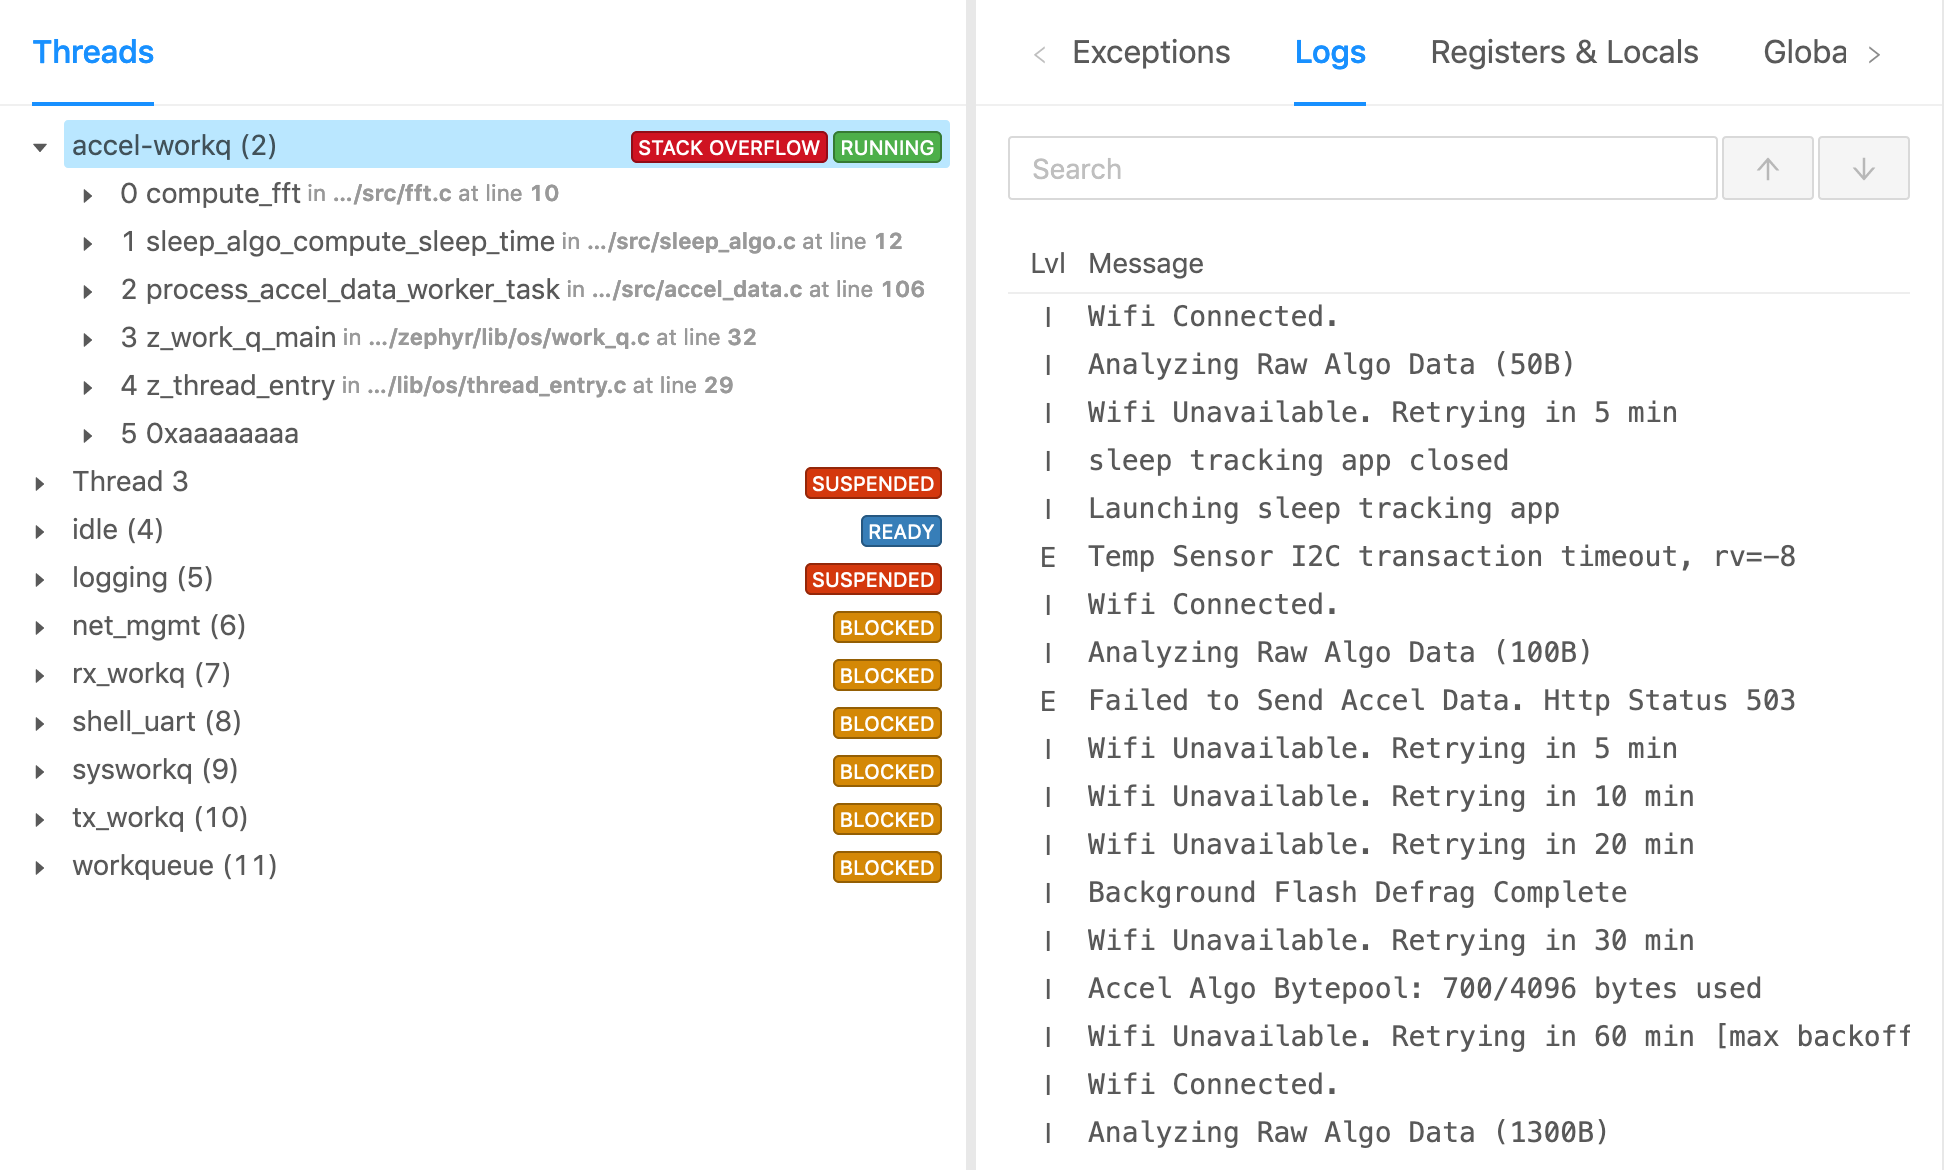
The Threads tab will display information about the threads that were running when the Trace was captured.
The first thread in the list is always the thread that caused the Trace to be captured. The chevron in front of the thread name can be clicked to reveal the backtrace, consisting of the stack frames (function calls) that lead up to the state of the thread. Each stack frame also has a chevron to reveal more metadata on the frame, such as the full source file path, line/column numbers, frame size, PC address, and more.
Clicking a stack frame will cause the "Registers & Locals" tab (if available) to be updated to the registers and local variables of the frame.
The extent of the information available varies a bit from platform to platform. For example, only for FreeRTOS and Zephyr MCU projects, the Threads tab will show the status and stack usage of each thread.
For MCU projects, please refer to this document to learn more about the configuration needed to collect thread information.
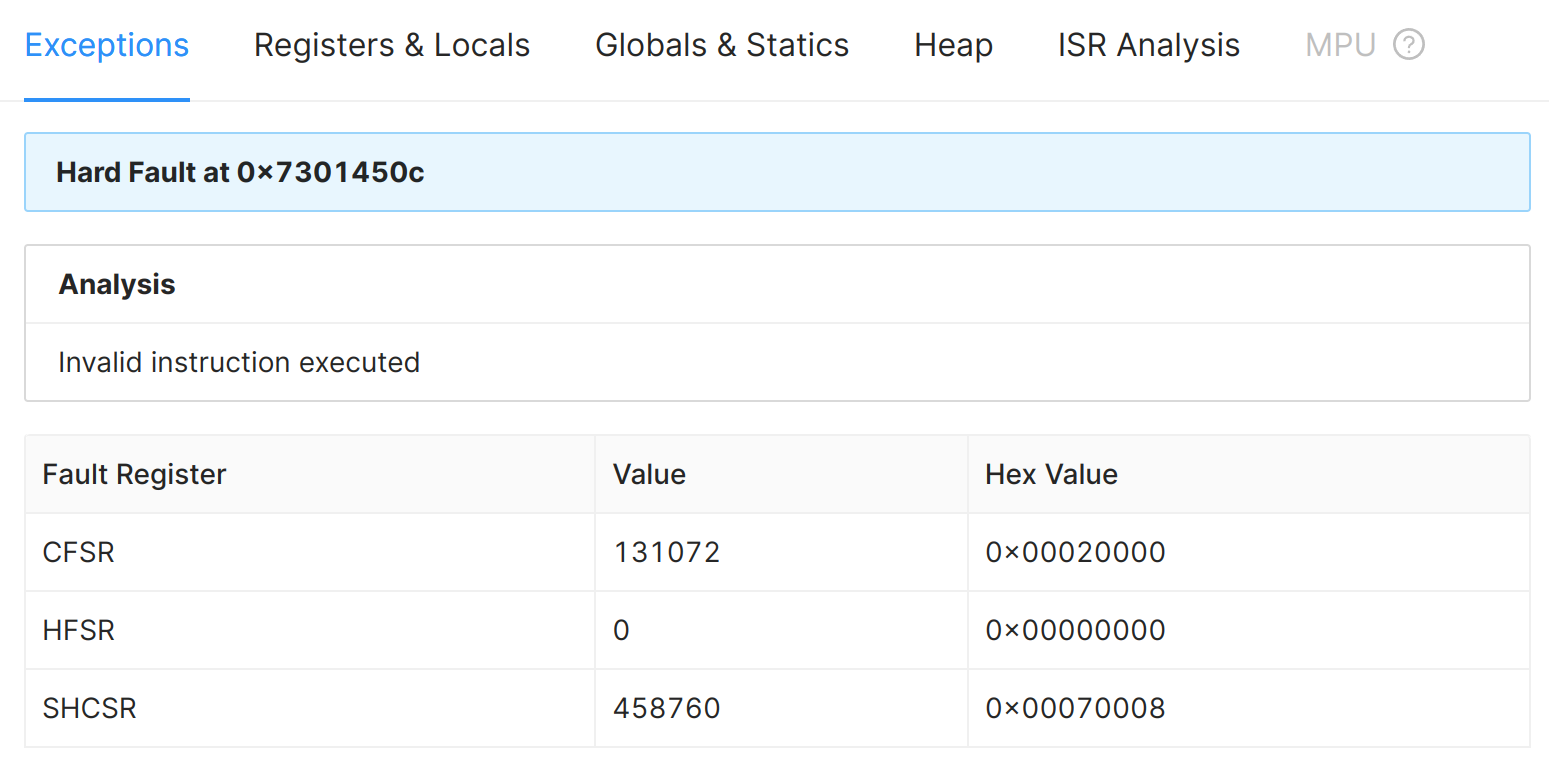
Exceptions Info
The Exceptions tab shows an analysis of the exception that occurred. For example, for MCU projects on an ARM microcontroller, the fault registers are decoded by Memfault and presented in a human-readable way:
Logs
The Logs tab will display logs that are pertinent to the Trace. See these guides for more information on how to configure the Memfault SDK to collect logs:
Registers & Local variables
This tab shows the registers and local variables of the currently selected stack frame in the Threads panel. The registers and local variables are shown in a table:
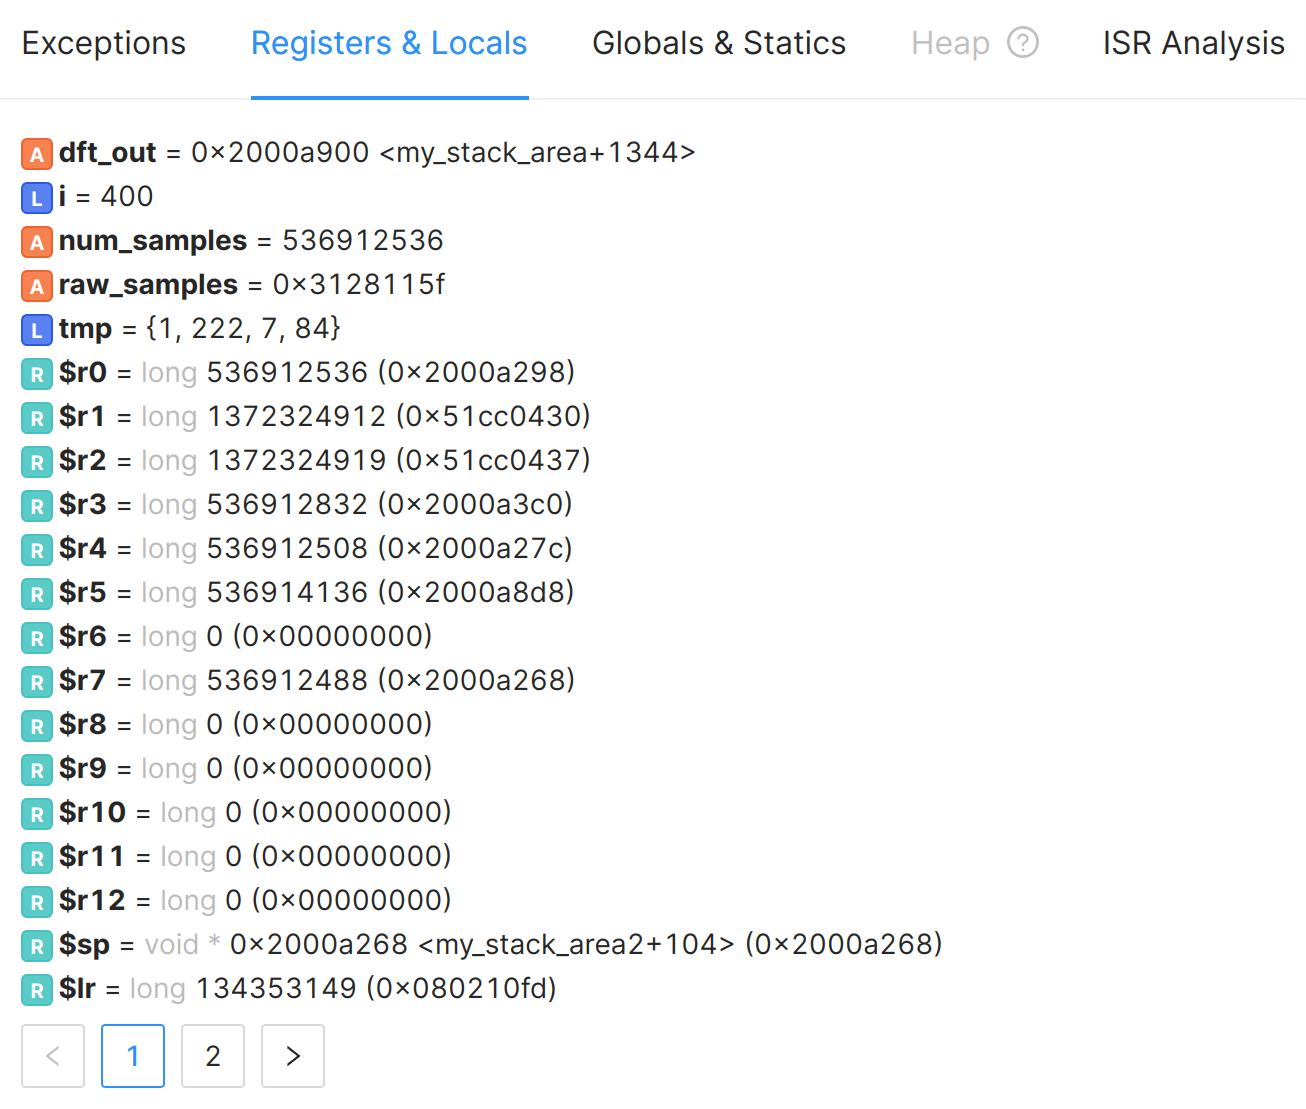
The colored letter in front of the name indicates the type of variable:
- A => function argument
- L => local variable
- R => CPU register
If variables/registers are not shown, it means that they were either optimized away by the compiler or that the information is not available in the coredump.
Memory Viewer
The Memory Viewer is a low-level view of the memory of the device at the time the coredump was captured:
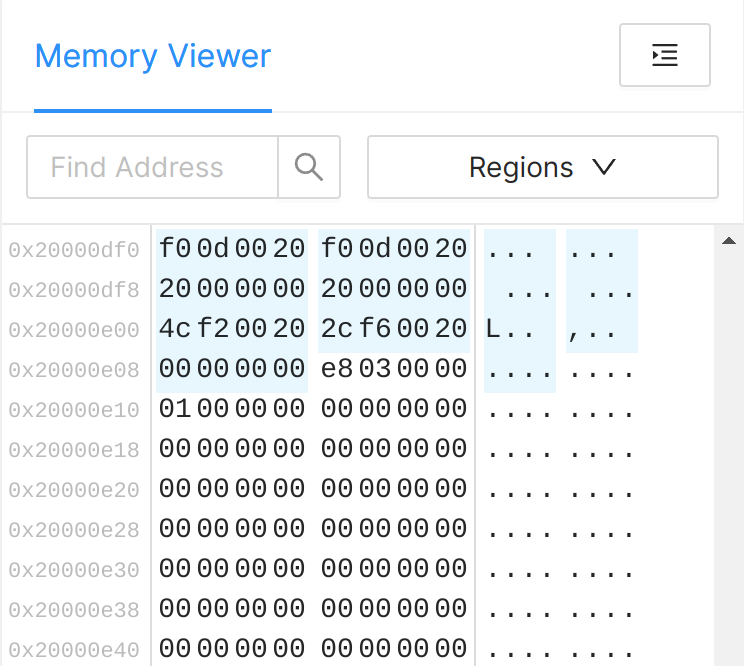
Navigating the Memory Viewer
To jump to an address, enter the address in either decimal or hexadecimal notation in the "Find Address" search box.
You can also jump to an address by clicking on an address from the "Globals & Statics" tab.
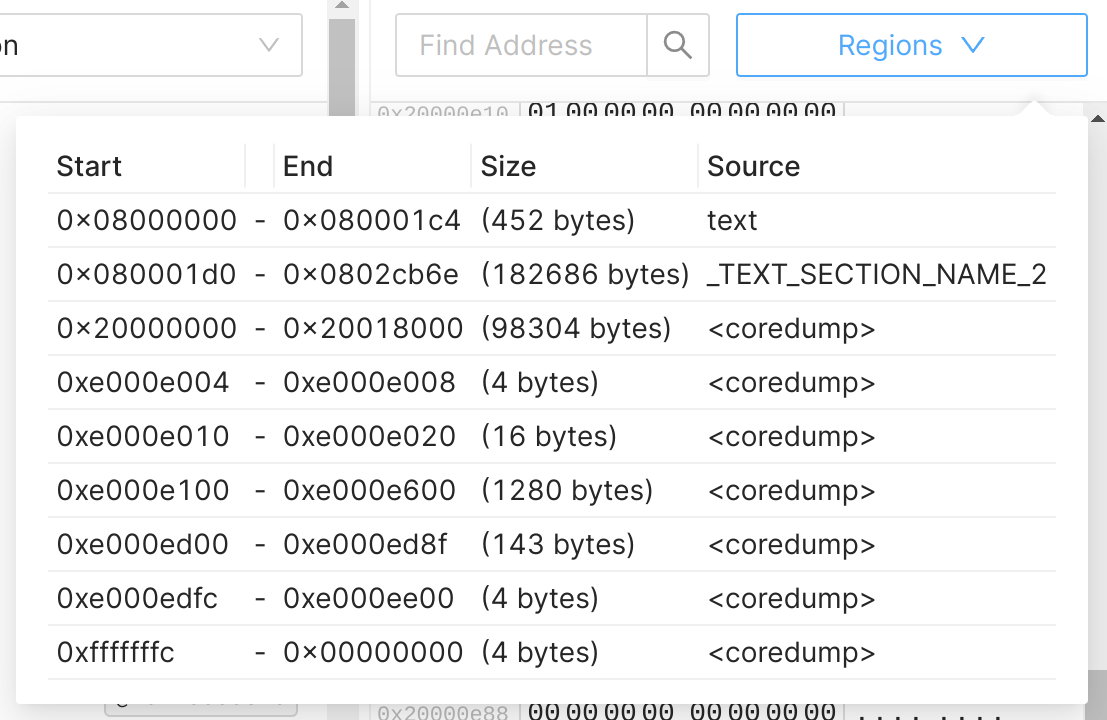
Inspecting Memory Regions
In the "Regions" dropdown menu, the regions of memory that have been captured in
the coredump are listed. Note that certain sections from the binary (Symbol
File) are also shown. For example .text are normally not captured in the
coredump, but they will appear in the Memory Viewer.
If a region of memory is present in the coredump, it will always use this data, but if it is missing, it may fall back to the data from the Symbol File. The Regions menu shows where the data is coming from:
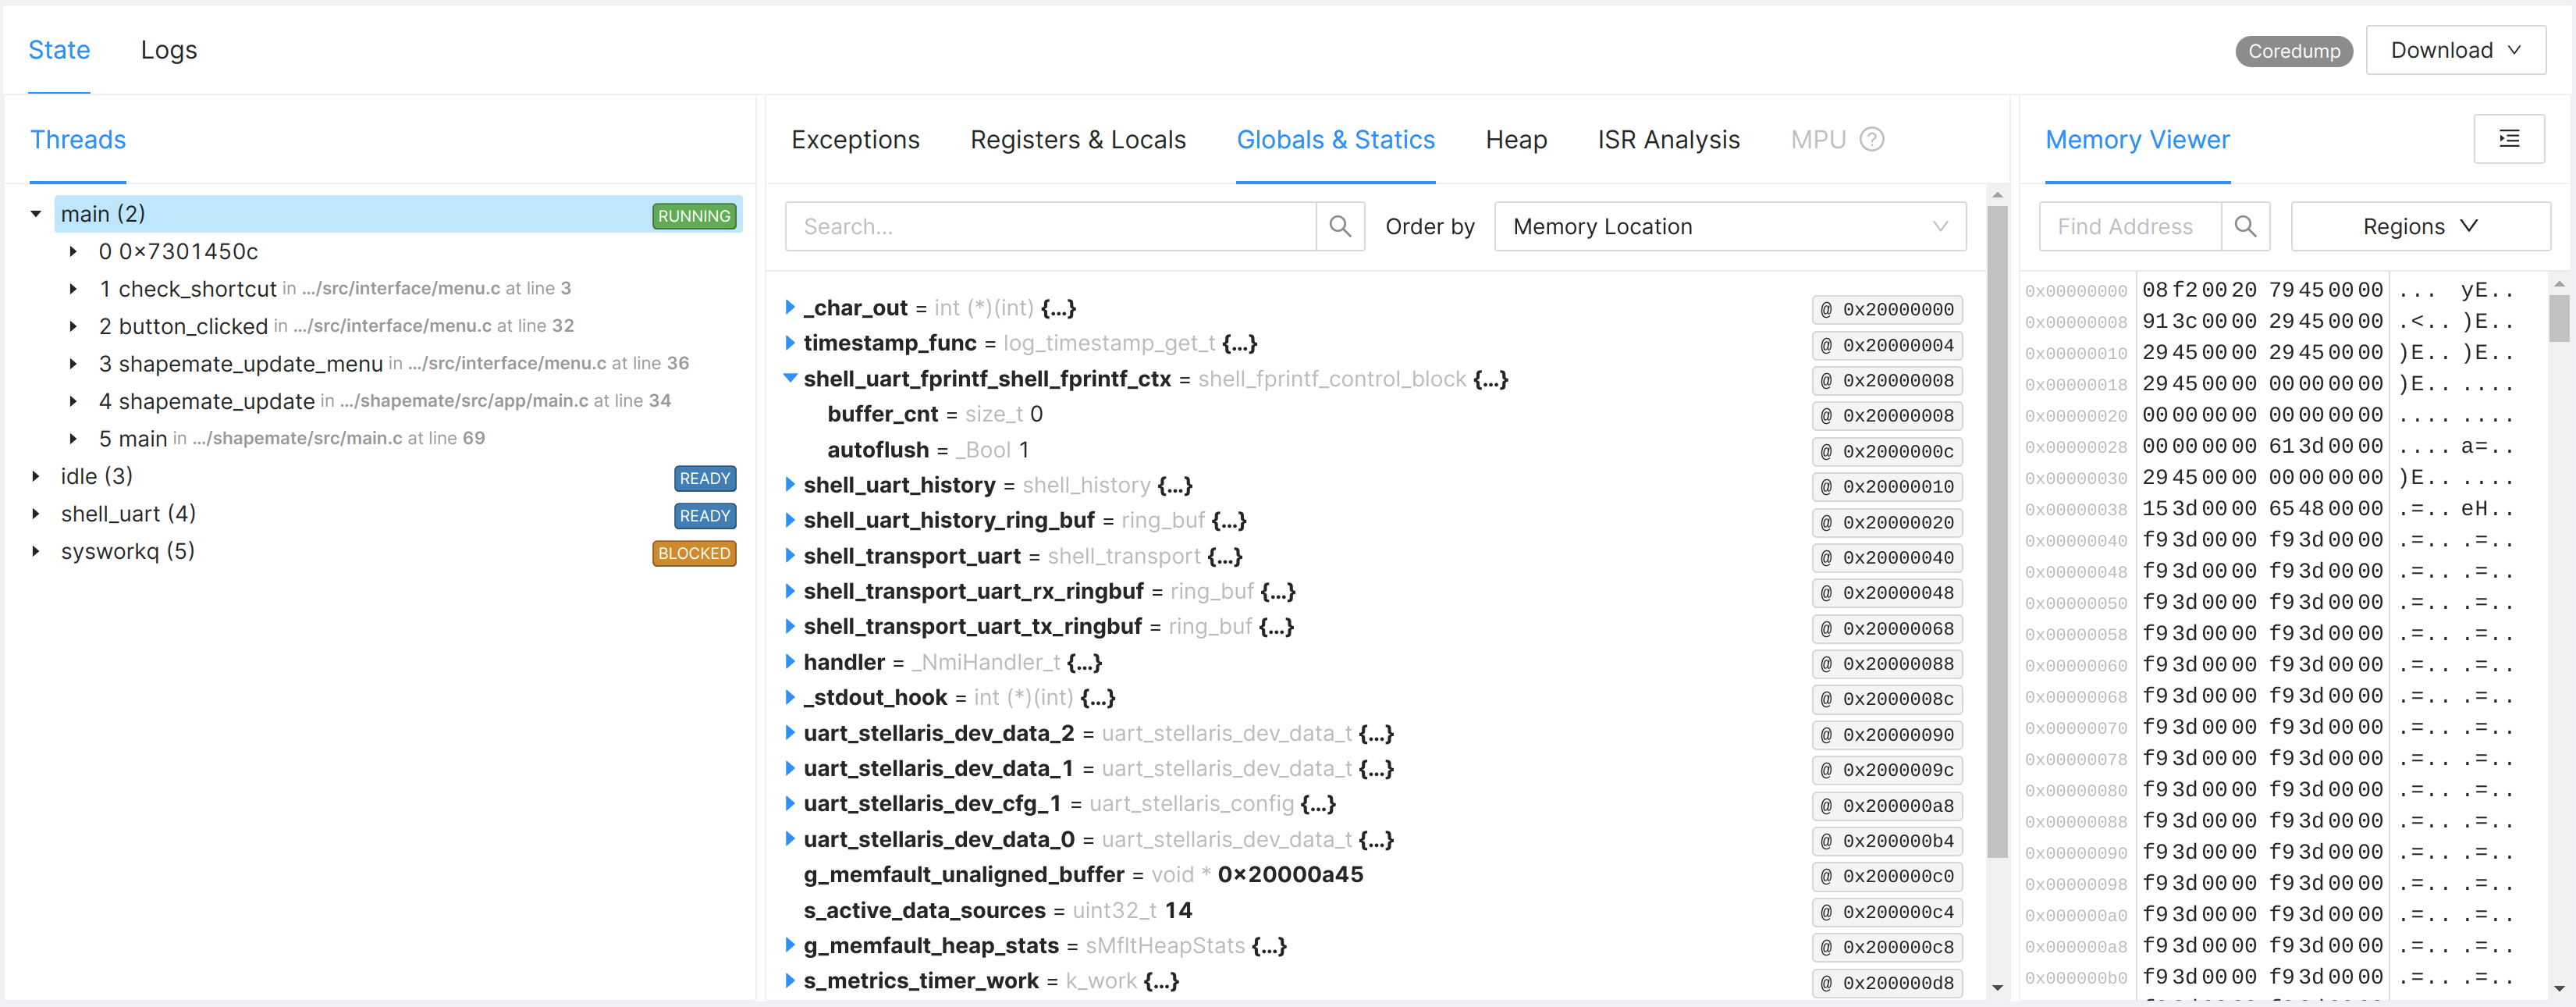
Global & Static variables
The Globals & Statics tab can be used to inspect global and static variables at the time the coredump was captured:
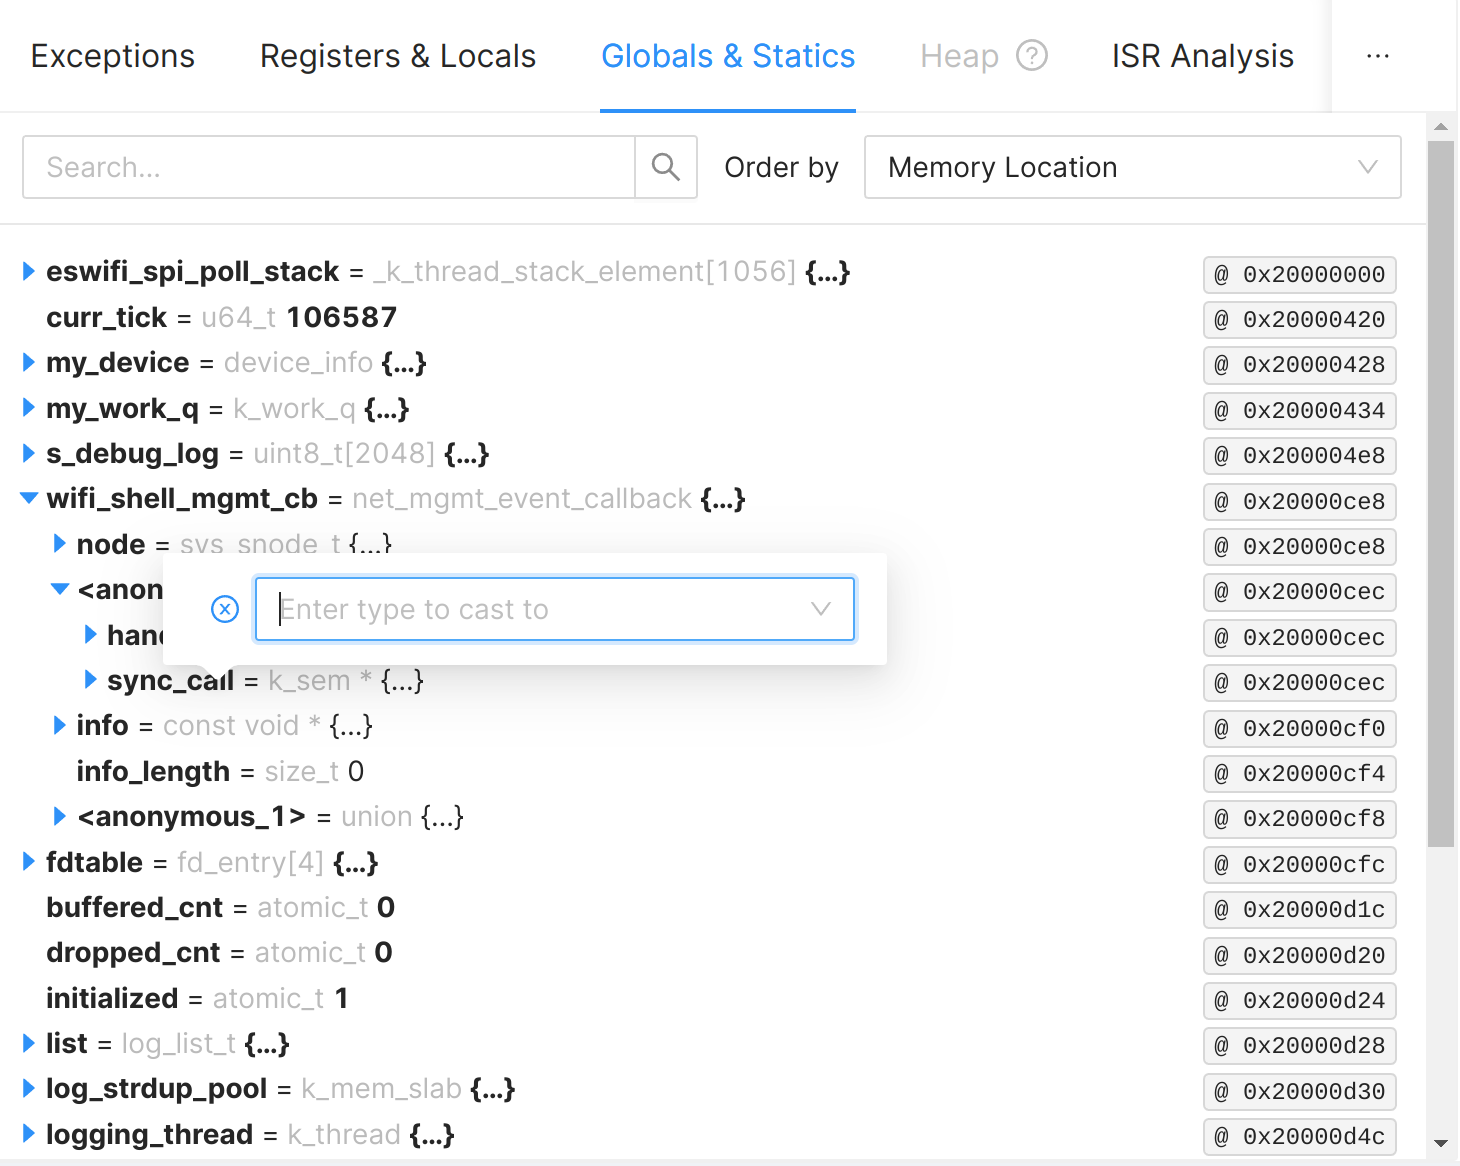
Type Casting
In some languages, it's possible to use pointer to unknown types. For example,
in C/C++ one can use the void * type to point to arbitrary memory. As a
programmer, you often know what type the pointer is pointing to, by inspecting
the state of the program. The UI offers a way to cast variables to a different
type.
To cast a variable to a different type, click the variable's type name (grey). A
popover will appear, prompting you to "Enter type to cast to". Start typing to
reduce the list of types and then select the type you want to cast to. By
default, single-level pointers are shown in the list. If you need double or
triple pointers, suffix your search query with ** or ***.
Downloading a variable's data
Sometimes you may want to download the raw binary data of a variable. For example, if the coredump contains a buffer that you wish to process further on your computer. To do this, hover over the variable's value and click the magnifying glass that appears on the right side. A modal will appear displaying the entire contents of the variable, as well as a "Download Binary" button to download the contents to a file.
Note: this feature only works for fixed-size variables/arrays.
"Hex-dumping" a variable
By clicking the address on the right side of a variable, the Memory Viewer will navigate the hex dump view to the memory where the variable is stored and highlight the bytes occupied by the variable.
Limitations
- This feature is currently only supported for MCU coredumps.
- It only works for C/C++ code. If you need support for another language, please let us know!
- When using type casting, the type has to be used in the source code of the program when it was compiled (it needs to exist in the debug info of the program). In other words, it is not possible to define a type layout on the fly in the web application.
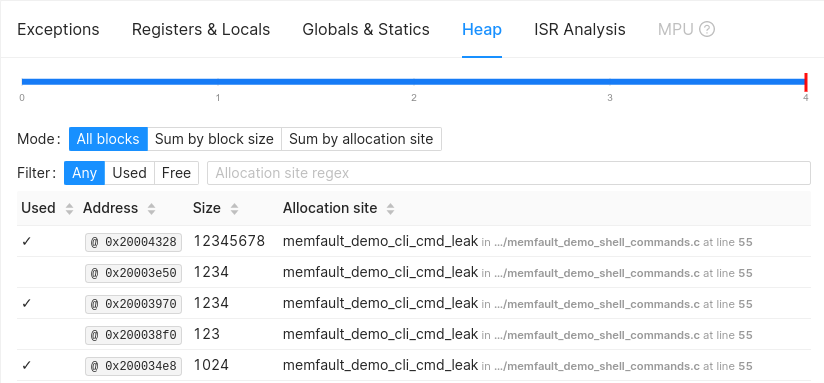
Heap Analysis
This view provides insight into heap allocations. This optional debugging feature tags all heap allocations with their respective size, address, and location of code that allocated it. Use it to understand memory distribution, heap fragmentation, or to find memory leaks in an out-of-memory situation in the field.
This view is only available for MCU coredumps. Please refer to the guide on heap allocation tracking for more information on how to enable this feature in the MCU SDK.
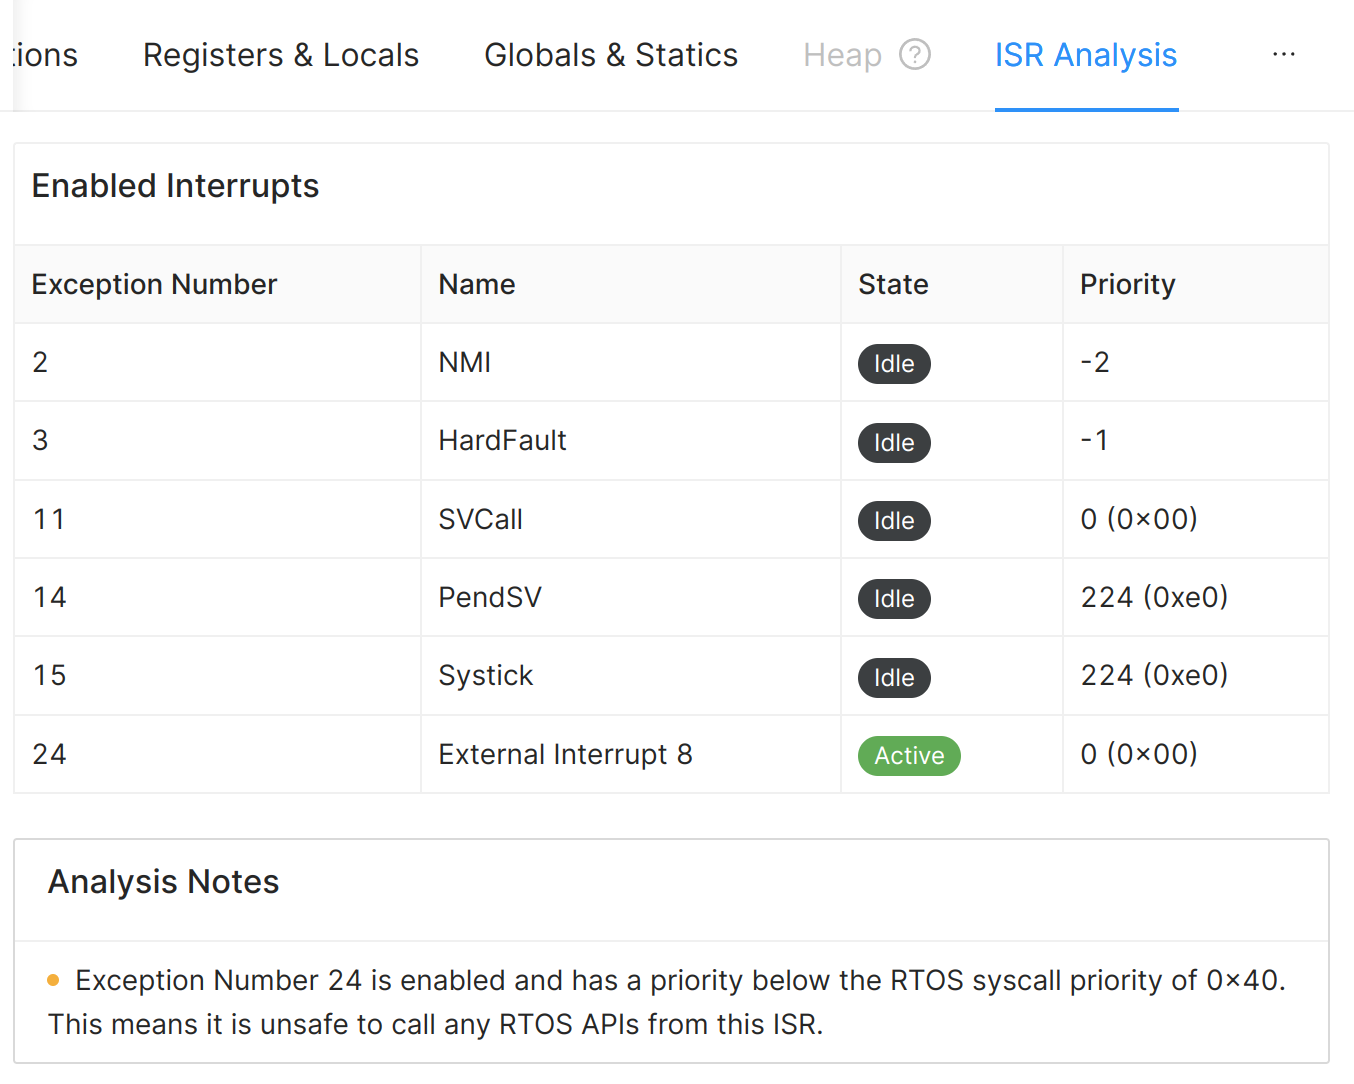
ISR Analysis
This tab shows the analysis of the Interrupt Status Registers. This currently only works for ARM MCUs.
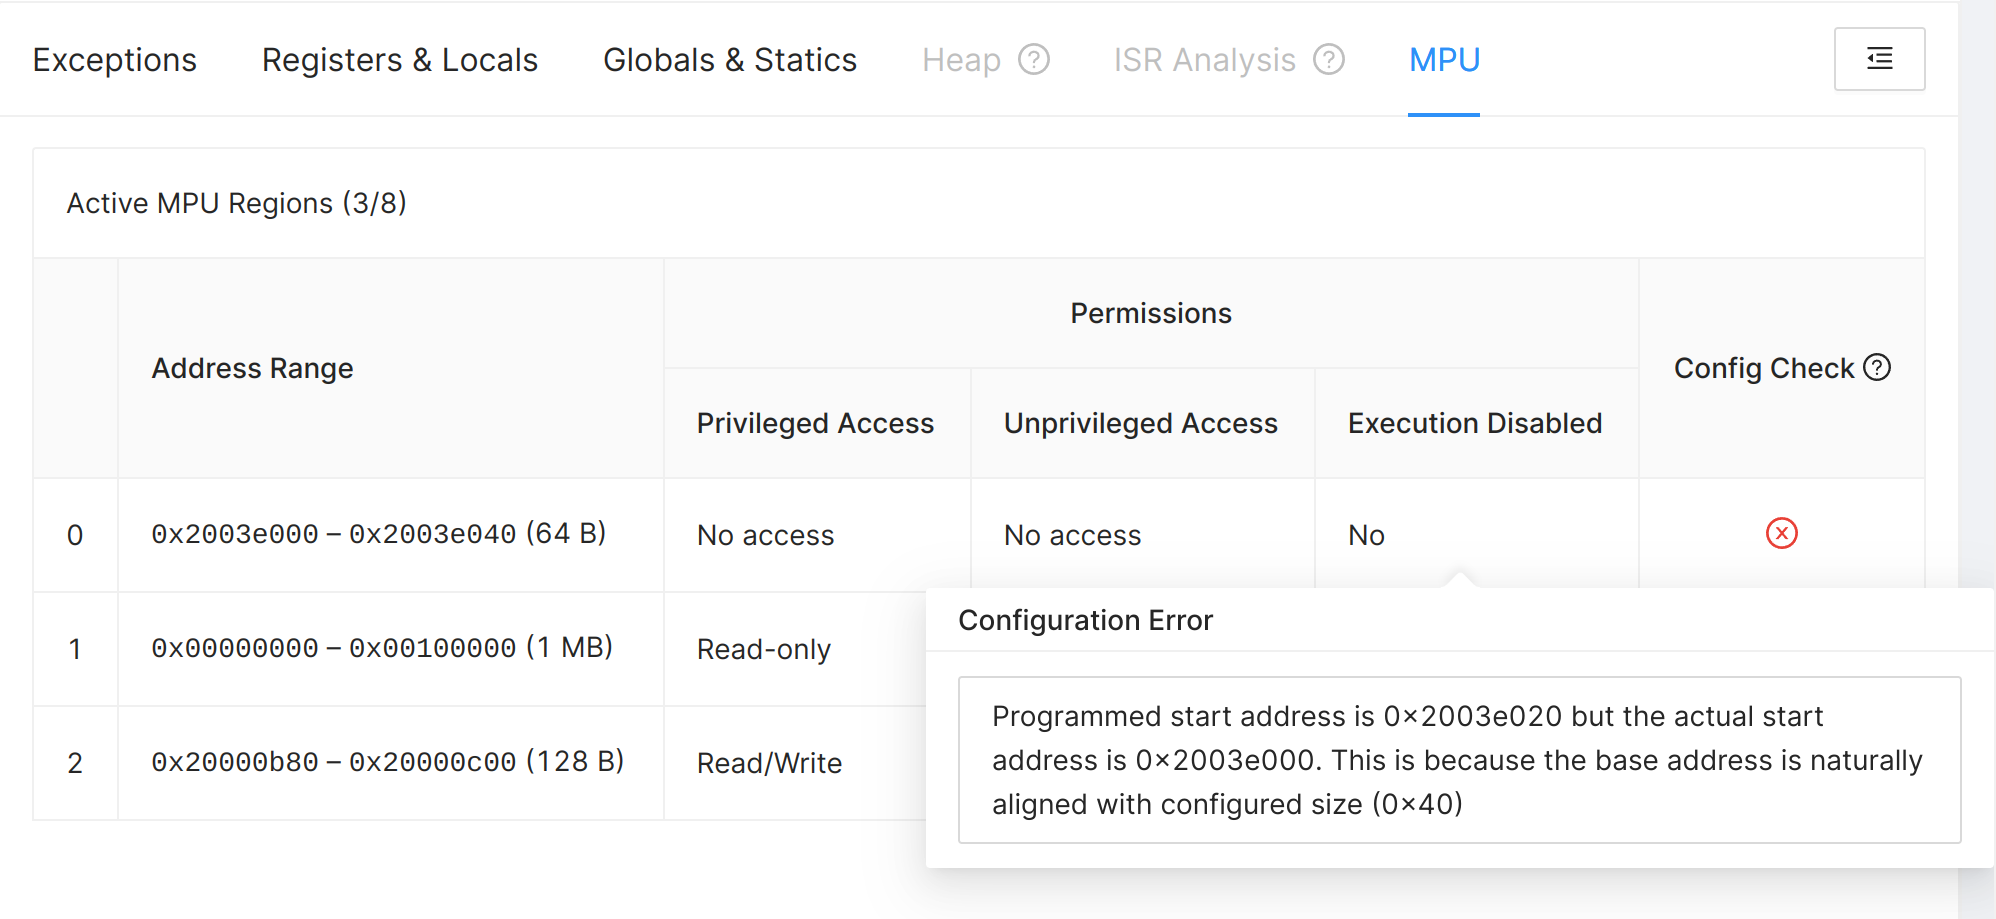
MPU Analysis
The MPU Analysis tab shows the analysis of the Memory Protection Unit (MPU) registers. Here, we tell you if the MPU is configured correctly or not, and provide guidance on how to fix any issues we find.
This currently only works for ARM MCUs that have support for an MPU. For a detailed explanation of the MPU and how to configure it, please refer to this blog article.