Memfault RTOS Support
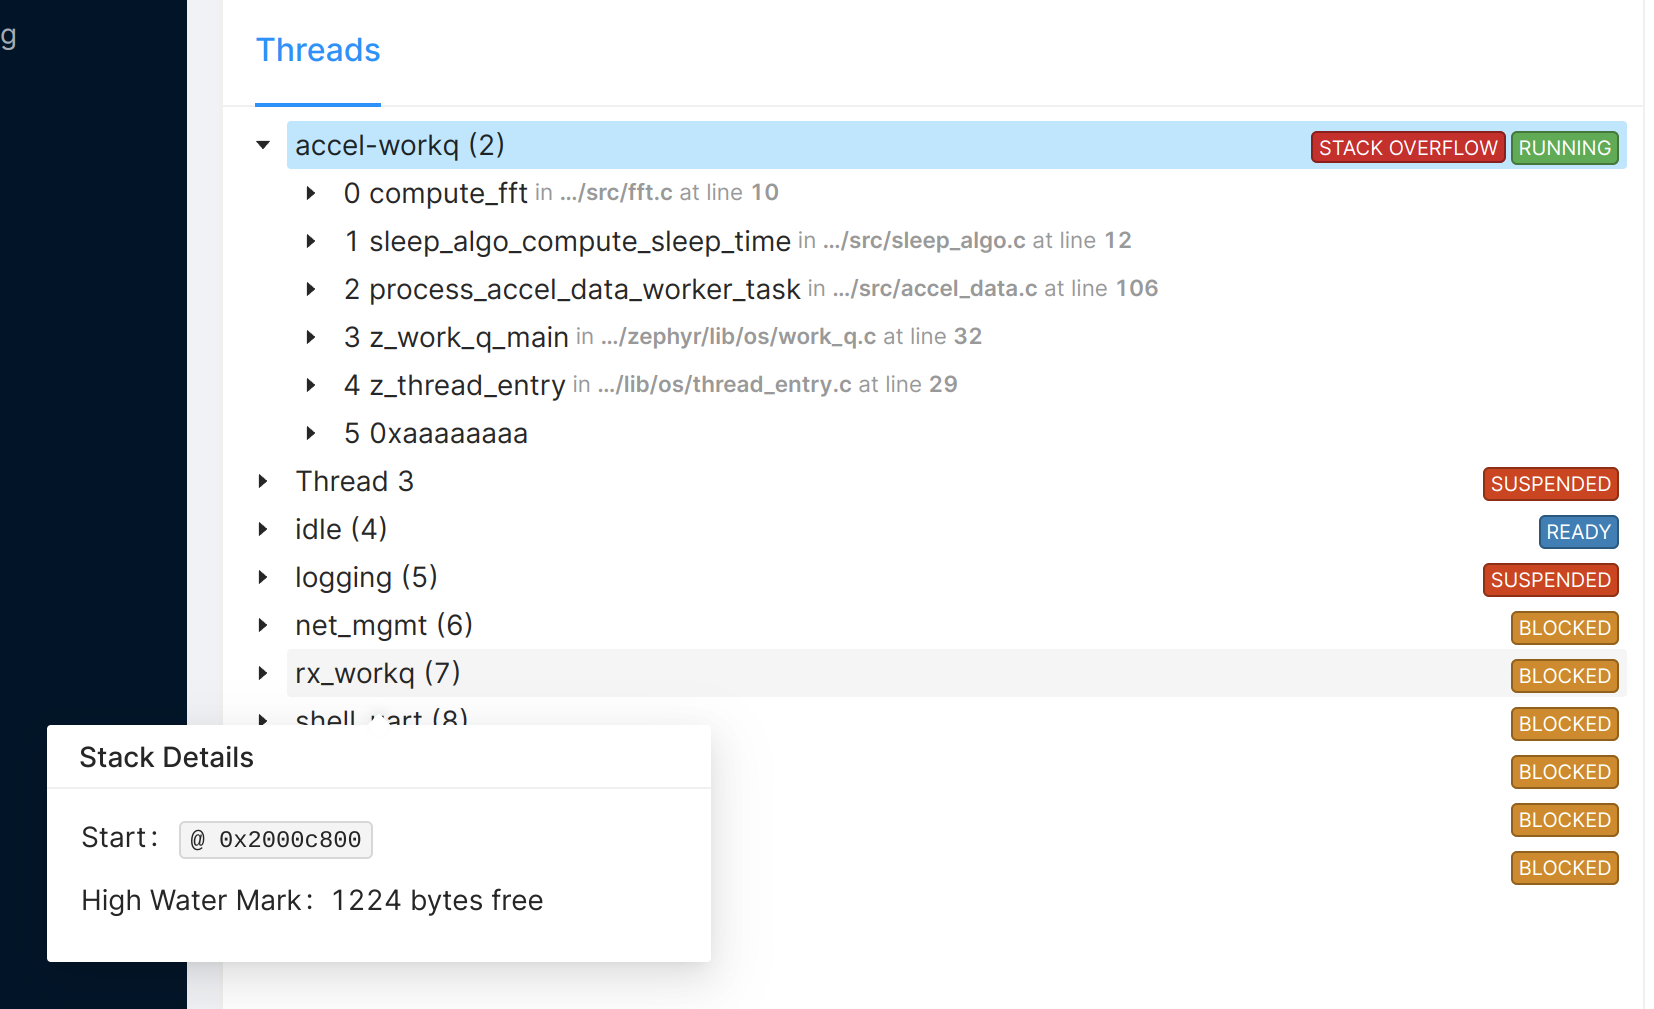
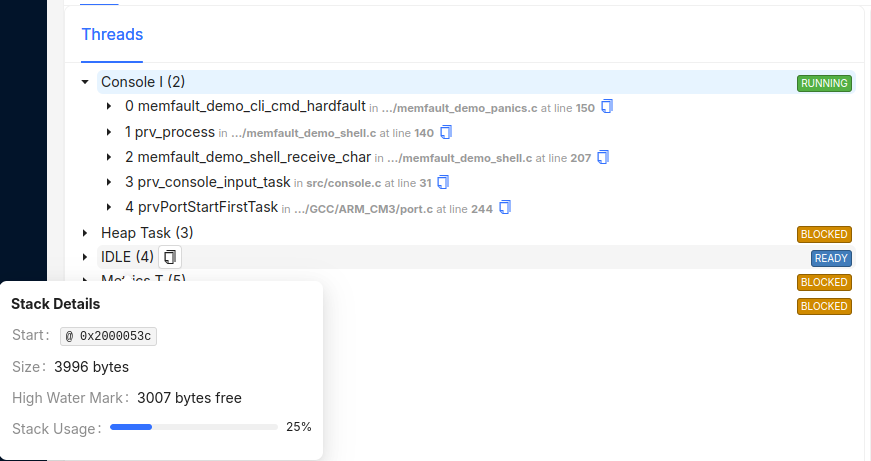
Memfault automatically detects what RTOS your system is running. For uploaded coredumps, it will attempt to extract backtraces for all threads in the system and optionally determine what state each thread is in and the stack usage high water mark, or the amount of stack that remained unused when the task stack was at its greatest (deepest) value 1.
In order for this to work correctly, the coredump must capture the RTOS' thread state variables, all thread control blocks as well as the stack memory of each thread. The following sections list for each RTOS what needs to be captured. See the documentation on Coredump Collection for details on how to set up additional coredump capturing regions.
FreeRTOS
Required
These variables must be captured in the coredump. On top of this, the memory of
all task control blocks (TCB_t) must be captured. Because FreeRTOS TCBs double
as linked list nodes, all TCBs must be captured.
uxCurrentNumberOfTaskspxCurrentTCBpxReadyTasksListsxDelayedTaskList1xDelayedTaskList2xPendingReadyListuxTopReadyPriorityxSchedulerRunning
There were several releases of FreeRTOS that did not include
uxTopUsedPriority, see this GitHub issue:
https://github.com/FreeRTOS/FreeRTOS-Kernel/issues/33#issue-583304006
If the version of FreeRTOS in use doesn't include the fix, add the sample file (for example, this copy) and relevant linker flags.
Optional
xTasksWaitingTerminationxSuspendedTaskList
Stack Overflow Checking
Set the following configurations to ensure Memfault collects a coredump when the FreeRTOS kernel detects a stack overflow, depending on how the FreeRTOS kernel is included in your project:
- FreeRTOS (Standard)
- ESP-IDF
Set configCHECK_FOR_STACK_OVERFLOW != 0. configCHECK_FOR_STACK_OVERFLOW = 2
is recommended for the most robust stack protection. See the
FreeRTOS documentation
for all possible values of configCHECK_FOR_STACK_OVERFLOW.
Choose an option for the Kconfig symbol CONFIG_FREERTOS_CHECK_STACKOVERFLOW !=
CONFIG_FREERTOS_CHECK_STACKOVERFLOW_NONE.
CONFIG_FREERTOS_CHECK_STACKOVERFLOW_CANARY=y is recommended for the most
robust stack protection. See the
Espressif documentation
for all possible choices for CONFIG_FREERTOS_CHECK_STACKOVERFLOW.
How to Capture the Required Variables
The
memfault_freertos_ram_regions.c
file contains details on selectively capturing the required variables.
Note that this is only necessary if all of RAM is not captured as part of the coredump (i.e. when coredump storage and bandwidth is limited).
The strategy has 3 parts:
- Update linker script to enclose the needed variables in a known region
- Update
memfault_platform_coredump_get_regions()to include that region's data in a coredump region - Use the FreeRTOS
traceTASK_CREATE/DELETE()macros to track tasks during runtime
See example implementations below.
- GCC
- IAR
Update the linker script (typically a file that ends with the .ld extension)
to enclose the necessary .bss symbols with some exported symbols:
.bss (NOLOAD) :
{
    _sbss = . ;
    __bss_start__ = _sbss;
    __memfault_capture_bss_start = .;
    /* Place all objects from the FreeRTOS timers and tasks modules here.
       Note that some build systems will use 'timers.o' as the object
       file name, and some may use variations of 'timers.c.o' or
       'timers.obj' etc. This pattern should capture all of them. */
     *tasks*.o*(.bss COMMON .bss*)
     *timers*.o*(.bss COMMON .bss*)
    __memfault_capture_bss_end = .;
And then update memfault_platform_coredump_get_regions() to include those
variables:
const sMfltCoredumpRegion *memfault_platform_coredump_get_regions(
    const sCoredumpCrashInfo *crash_info, size_t *num_regions) {
  int region_idx = 0;

  // any higher priority regions would go here, i.e. active stack

  // collect the FreeRTOS timer and task variables required for RTOS decode
  extern uint32_t __memfault_capture_bss_start;
  extern uint32_t __memfault_capture_bss_end;
  const size_t memfault_region_size = (uint32_t)&__memfault_capture_bss_end -
      (uint32_t)&__memfault_capture_bss_start;

  s_coredump_regions[region_idx] = MEMFAULT_COREDUMP_MEMORY_REGION_INIT(
    &__memfault_capture_bss_start, memfault_region_size);
  region_idx++;

  // remaining regions would go here. typically the
  // 'memfault_freertos_get_task_regions()' helper would be used to capture the
  // task data.
  region_idx += memfault_freertos_get_task_regions(&s_coredump_regions[region_idx],
      MEMFAULT_ARRAY_SIZE(s_coredump_regions) - region_idx);
  // remaining regions
Update the linker script (typically a file with a .icf extension) to include
this line:
define block memfault_freertos { section .bss* object *tasks*.o*, section .bss* object *timers*.o* };
And then update memfault_platform_coredump_get_regions() to include that
block:
// In the source file where memfault_platform_coredump_get_regions is defined add the following snippet
// Be sure to include additional sMfltCoredumpRegion entries in your regions array for the FreeRTOS regions
// created by the linker script and helper function
const sMfltCoredumpRegion *memfault_platform_coredump_get_regions(
    const sCoredumpCrashInfo *crash_info, size_t *num_regions) {
  int region_idx = 0;

  // any higher priority regions would go here, i.e. active stack

  // collect the block defined in the linker script
  const void *memfault_freertos_region_start = __section_begin("memfault_freertos");
  const size_t memfault_freertos_region_size = __section_size("memfault_freertos");
  s_coredump_regions[region_idx] = MEMFAULT_COREDUMP_MEMORY_REGION_INIT(
     memfault_freertos_region_start, memfault_freertos_region_size);
  region_idx++;

  // remaining regions would go here. typically the
  // 'memfault_freertos_get_task_regions()' helper would be used to capture the
  // task data.
  region_idx += memfault_freertos_get_task_regions(&s_coredump_regions[region_idx],
      MEMFAULT_ARRAY_SIZE(s_coredump_regions) - region_idx);
  // remaining regions
Finally, modify your FreeRTOSConfig.h to include this following snippet:
//! @file FreeRTOSConfig.h
#pragma once

#include "memfault/ports/freertos_trace.h"
To have enough space for the FreeRTOS variables, you may need to increase the
size of your coredump storage. Use the
memfault_coredump_storage_check_size()
utility to determine the exact size required to save a coredump on your system
after making the modifications above
Built-in FreeRTOS Metrics
The Memfault SDK provides built-in FreeRTOS metrics including CPU usage and timer task stack free bytes.
To enable these metrics, add the Memfault FreeRTOS port files from
ports/freertos/
to your project and include the built-in metric definitions in your heartbeat
config:
#include "ports/freertos/config/memfault_metrics_heartbeat_freertos_config.def"
See the MCU Built-in Metrics - FreeRTOS reference for the full list.
Tracking Thread Stack Usage
The Memfault SDK has built-in support for tracking FreeRTOS thread stack usage, by registering thread names and stack usage metric keys.
By default, the IDLE and Tmr Svc tasks are monitored. To track other tasks,
override the list of tracked tasks by adding the following to your project:
//! Set the list of threads to monitor for stack usage. The metric keys must
//! be defined in memfault_metrics_heartbeat_config.def, ex:
//!
//! MEMFAULT_METRICS_KEY_DEFINE_WITH_SCALE_VALUE(
//!   memory_main_pct_max, kMemfaultMetricType_Unsigned,
//!   CONFIG_MEMFAULT_METRICS_THREADS_MEMORY_SCALE_FACTOR
//! )
//! MEMFAULT_METRICS_KEY_DEFINE_WITH_SCALE_VALUE(
//!   memory_shell_uart_pct_max, kMemfaultMetricType_Unsigned,
//!   CONFIG_MEMFAULT_METRICS_THREADS_MEMORY_SCALE_FACTOR
//! )
#include "memfault/ports/zephyr/thread_metrics.h"

MEMFAULT_METRICS_DEFINE_THREAD_METRICS (
  // monitor the main thread stack usage
  {
    .thread_name = "main",
    .stack_usage_metric_key = MEMFAULT_METRICS_KEY(memory_main_pct_max),
  },
  // monitor the shell_uart thread stack usage
  {
    .thread_name = "shell_uart",
    .stack_usage_metric_key = MEMFAULT_METRICS_KEY(memory_shell_uart_pct_max),
  },
  // track the Timer thread stack usage. note that this metric doesn't need to
  // be defined by the user- it's built in to the SDK
  {
    .thread_name = "Tmr Svc",
    .stack_usage_metric_key = MEMFAULT_METRICS_KEY(memory_tmr_svc_pct_max),
  });
On some platforms, such as ESP-IDF, it's necessary to set the following to disable the default task list:
#define MEMFAULT_METRICS_THREADS_DEFAULTS_INDEX 0
Optionally, instead of using a thread name to tag threads, a callback can be used that returns the thread handle. Example:
#include "memfault/ports/zephyr/thread_metrics.h"

static TaskHandle_t prv_get_shell_uart_task_handle(void) {
  // task handle for shell_uart task
  extern TaskHandle_t shell_uart_task_handle;
  return shell_uart_task_handle;
}

MEMFAULT_METRICS_DEFINE_THREAD_METRICS (
  // monitor the main thread stack usage
  {
    .thread_name = "main",
    .stack_usage_metric_key = MEMFAULT_METRICS_KEY(memory_main_pct_max),
  },
  // monitor the shell_uart thread stack usage, using the task handle callback
  // to provide the task handle instead of the thread name string
  {
    .get_task_handle = prv_get_shell_uart_task_handle,
    .stack_usage_metric_key = MEMFAULT_METRICS_KEY(memory_shell_uart_pct_max),
  });
Coredump Stack High Watermark
Memfault will automatically compute stack high watermarks (represented as
High Water Mark: x Bytes Free) for each task captured in a coredump.
Memfault has two ways of computing the high watermarks:
- If a task's entire stack region is captured in the coredump, the watermark is
computed when the coredump is processed. This requires setting
#define configRECORD_STACK_HIGH_ADDRESS 1inFreeRTOSConfig.h. - If
#define MEMFAULT_COREDUMP_COMPUTE_THREAD_STACK_USAGE 1is set inmemfault_platform_config.h, the high watermark is computed when the coredump is captured. The full task stack does not need to be present in the coredump for Memfault to show the watermark. This also requires setting#define INCLUDE_uxTaskGetStackHighWaterMark 1inFreeRTOSConfig.h.
Zephyr
Required
These variables must be captured in the coredump:
_kernel_kernel_openocd_offsets_kernel_openocd_size_t_size
Tracking Thread Stack Usage
The Memfault SDK has built-in support for tracking thread stack usage using
Memfault Metrics. This is controlled with the Kconfig option
CONFIG_MEMFAULT_METRICS_THREADS, and is enabled by default.
Register threads for tracking by adding the following to your project:
//! Set the list of threads to monitor for stack usage. The metric keys must
//! be defined in memfault_metrics_heartbeat_config.def, ex:
//!
//! MEMFAULT_METRICS_KEY_DEFINE_WITH_SCALE_VALUE(
//!   memory_main_pct_max, kMemfaultMetricType_Unsigned,
//!   CONFIG_MEMFAULT_METRICS_THREADS_MEMORY_SCALE_FACTOR
//! )
//! MEMFAULT_METRICS_KEY_DEFINE_WITH_SCALE_VALUE(
//!   memory_shell_uart_pct_max, kMemfaultMetricType_Unsigned,
//!   CONFIG_MEMFAULT_METRICS_THREADS_MEMORY_SCALE_FACTOR
//! )
#include "memfault/ports/zephyr/thread_metrics.h"

MEMFAULT_METRICS_DEFINE_THREAD_METRICS (
  // monitor the main thread stack usage
  {
    .thread_name = "main",
    .stack_usage_metric_key = MEMFAULT_METRICS_KEY(memory_main_pct_max),
  },
  // monitor the shell_uart thread stack usage
  {
    .thread_name = "shell_uart",
    .stack_usage_metric_key = MEMFAULT_METRICS_KEY(memory_shell_uart_pct_max),
  },
  // most configurations will have idle and system work queue threads, include
  // them in the tracked list. note that these metrics don't need to be defined
  // by the user- they're built in to the SDK
  {
    .thread_name = "idle",
    .stack_usage_metric_key = MEMFAULT_METRICS_KEY(memory_idle_pct_max),
  },
  {
    .thread_name = "sysworkq",
    .stack_usage_metric_key = MEMFAULT_METRICS_KEY(memory_sysworkq_pct_max),
  });
Threads are identified by the thread name string. This requires threads to have valid (and unique) names.
- threads are statically created with
K_THREAD_DEFINE()always have a valid string name set - threads created using
k_thread_create()will need to have a name applied withk_thread_name_set()
Eclipse ThreadX RTOS
Required
These variables must be captured in the coredump:
_tx_thread_current_ptr_tx_thread_created_ptr_tx_thread_created_count_tx_thread_system_state
Capturing Threads
Memfault provides a helper function, memfault_threadx_get_thread_regions(),
that walks the ThreadX created-thread list and captures each thread's TCB and
stack memory in the coredump. In order to use this helper, the required kernel
variables must be placed in a known region of memory that can be captured in the
coredump.
This is done as follows:
-
Modify the linker script to place the required kernel variables in a specific region of
.bss:.bss (NOLOAD) :{_sbss = . ;__bss_start__ = _sbss;__memfault_capture_bss_start = .;/* Place ThreadX global thread state variables in a single span */*tx_thread_initialize.o*(.bss COMMON .bss*)__memfault_capture_bss_end = .;} -
Implement the
memfault_platform_coredump_get_regions()function to include the ThreadX kernel variables, by using the helpermemfault_threadx_get_thread_regions():// Sized for: 1 active stack + 1 optional ISR PSP stack// + 1 _tx_thread_system_state region// + 1 __memfault_capture_bss region// + per-thread regions from memfault_threadx_get_thread_regions()#define COREDUMP_MAX_REGIONS (4 + MEMFAULT_THREADX_MAX_TASK_REGIONS)static sMfltCoredumpRegion s_coredump_regions[COREDUMP_MAX_REGIONS];extern uint32_t __memfault_capture_bss_end;extern uint32_t __memfault_capture_bss_start;// ThreadX scheduler state (defined in tx_thread_initialize.c, in .data)extern ULONG _tx_thread_system_state;static uint32_t prv_read_psp_reg(void) {uint32_t reg_val;__asm volatile("mrs %0, psp" : "=r"(reg_val));return reg_val;}const sMfltCoredumpRegion *memfault_platform_coredump_get_regions(const sCoredumpCrashInfo *crash_info, size_t *num_regions) {int region_idx = 0;// 1. Capture active stack (MSP or PSP depending on where crash occurred)size_t stack_size_to_collect = memfault_platform_sanitize_address_range(crash_info->stack_address, MEMFAULT_PLATFORM_ACTIVE_STACK_SIZE_TO_COLLECT);s_coredump_regions[region_idx++] =MEMFAULT_COREDUMP_MEMORY_REGION_INIT(crash_info->stack_address, stack_size_to_collect);// 2. If crash was in ISR (MSP active), also collect the PSP (thread stack)const bool msp_was_active = (crash_info->exception_reg_state->exc_return & (1 << 2)) == 0;if (msp_was_active) {void *psp = (void *)prv_read_psp_reg();const uint32_t extra_stack_bytes = 256;stack_size_to_collect = memfault_platform_sanitize_address_range(psp, MEMFAULT_PLATFORM_ACTIVE_STACK_SIZE_TO_COLLECT + extra_stack_bytes);s_coredump_regions[region_idx++] =MEMFAULT_COREDUMP_MEMORY_REGION_INIT(psp, stack_size_to_collect);}// 3. Capture _tx_thread_system_state (.data, needed for RTOS decode)s_coredump_regions[region_idx++] =MEMFAULT_COREDUMP_MEMORY_REGION_INIT(&_tx_thread_system_state, sizeof(ULONG));// 4. Capture ThreadX kernel state BSS (_tx_thread_created_ptr, etc.)const size_t bss_capture_size =(uint32_t)&__memfault_capture_bss_end - (uint32_t)&__memfault_capture_bss_start;s_coredump_regions[region_idx++] =MEMFAULT_COREDUMP_MEMORY_REGION_INIT(&__memfault_capture_bss_start, bss_capture_size);// 5. Walk ThreadX created-thread list, capture each TCB + full stack, and// compute per-thread stack-usage watermarks into the sidecar region.region_idx += (int)memfault_threadx_get_thread_regions(&s_coredump_regions[region_idx],MEMFAULT_ARRAY_SIZE(s_coredump_regions) - (size_t)region_idx);*num_regions = (size_t)region_idx;return &s_coredump_regions[0];}
Coredump Stack Usage
When a coredump is captured with ThreadX thread regions included, Memfault will show per-thread stack usage data. Each thread in the coredump will include the following fields:
stack_size- total stack size in bytesstack_start- base address of the stackstack_unused- number of bytes that were unused at the time of the coredump
This data is automatically populated by the
memfault_threadx_get_thread_regions() helper when capturing thread regions in
the coredump.
Micrium OS (µC/OS-III)
See the memfault-micrium-sample repository for a complete working example of this integration.
Required
Micrium OS maintains a linked list of all task control blocks (TCBs) rooted at
OSTaskDbgListPtr. The following kernel globals must be captured in the
coredump:
OSTCBCurPtr- pointer to the currently-running TCBOSTaskDbgListPtr- head of the debug TCB list (requiresOS_CFG_DBG_EN == DEF_ENABLED)OSRunning- kernel running state
These are emitted by the os_core, os_task, and os_var translation units.
OS_CFG_DBG_EN must be set to DEF_ENABLED in os_cfg.h. Without it,
OSTaskDbgListPtr is not maintained and task enumeration is not possible.
On top of the kernel globals, all task control blocks (OS_TCB) and their
associated stack regions must be captured.
How to Capture
The strategy has two parts: a linker script change to group the kernel globals
into a single span, and an implementation of
memfault_platform_coredump_get_regions() that walks the TCB debug list.
1. Linker script (GCC .ld)
Enclose the Micrium OS kernel globals in a named span inside .bss:
.bss :
{
    . = ALIGN(4);
    _sbss = .;
    __bss_start__ = _sbss;
    /* Capture Micrium OS core state for coredump (OSTCBCurPtr, OSTaskDbgListPtr, etc.) */
    __memfault_capture_bss_start = .;
    *os_core*.o(.bss COMMON .bss*)
    *os_task*.o(.bss COMMON .bss*)
    *os_var*.o(.bss COMMON .bss*)
    __memfault_capture_bss_end = .;
    *(.bss*)
    *(COMMON)
    . = ALIGN(4);
    _ebss = .;
    __bss_end__ = _ebss;
} > RAM
2. memfault_platform_coredump_get_regions() implementation
#include "os.h"
#include "memfault/components.h"

// Sized to hold:
//   1 active stack + 1 optional ISR PSP stack
//   + 1 __memfault_capture_bss region
//   + per-task: TCB + stack (2 regions each)
#define COREDUMP_MAX_REGIONS (3 + 2 * 20)

static sMfltCoredumpRegion s_coredump_regions[COREDUMP_MAX_REGIONS];

extern uint32_t __memfault_capture_bss_start;
extern uint32_t __memfault_capture_bss_end;

static uint32_t prv_read_psp_reg(void) {
  uint32_t reg_val;
  __asm volatile("mrs %0, psp" : "=r"(reg_val));
  return reg_val;
}

const sMfltCoredumpRegion *memfault_platform_coredump_get_regions(
    const sCoredumpCrashInfo *crash_info, size_t *num_regions) {
  int region_idx = 0;

  // 1. Active stack (MSP or PSP depending on where the crash occurred)
  size_t stack_size = memfault_platform_sanitize_address_range(
    crash_info->stack_address, MEMFAULT_PLATFORM_ACTIVE_STACK_SIZE_TO_COLLECT);
  s_coredump_regions[region_idx++] =
    MEMFAULT_COREDUMP_MEMORY_REGION_INIT(crash_info->stack_address, stack_size);

  // 2. If crash was in an ISR (MSP active), also collect the PSP (task stack)
  const bool msp_was_active =
    (crash_info->exception_reg_state->exc_return & (1 << 2)) == 0;
  if (msp_was_active) {
    void *psp = (void *)prv_read_psp_reg();
    stack_size = memfault_platform_sanitize_address_range(
      psp, MEMFAULT_PLATFORM_ACTIVE_STACK_SIZE_TO_COLLECT);
    s_coredump_regions[region_idx++] =
      MEMFAULT_COREDUMP_MEMORY_REGION_INIT(psp, stack_size);
  }

  // 3. Micrium OS kernel state (OSTCBCurPtr, OSTaskDbgListPtr, OSRunning, ...)
  const size_t bss_size = (uint32_t)&__memfault_capture_bss_end -
                          (uint32_t)&__memfault_capture_bss_start;
  s_coredump_regions[region_idx++] =
    MEMFAULT_COREDUMP_MEMORY_REGION_INIT(&__memfault_capture_bss_start, bss_size);

  // 4. Walk the debug TCB list and capture each task's TCB + stack
#if (OS_CFG_DBG_EN == DEF_ENABLED)
  OS_TCB *tcb = OSTaskDbgListPtr;
  while (tcb != NULL) {
    if (memfault_platform_sanitize_address_range(tcb, sizeof(OS_TCB)) < sizeof(OS_TCB)) {
      break;
    }

    if (region_idx < (int)MEMFAULT_ARRAY_SIZE(s_coredump_regions)) {
      s_coredump_regions[region_idx++] =
        MEMFAULT_COREDUMP_MEMORY_REGION_INIT(tcb, sizeof(OS_TCB));
    }

    if (tcb->StkBasePtr != NULL && tcb->StkSize > 0 &&
        region_idx < (int)MEMFAULT_ARRAY_SIZE(s_coredump_regions)) {
      const size_t stk_bytes = (size_t)tcb->StkSize * sizeof(CPU_STK);
      const size_t sanitized =
        memfault_platform_sanitize_address_range(tcb->StkBasePtr, stk_bytes);
      if (sanitized > 0) {
        s_coredump_regions[region_idx++] =
          MEMFAULT_COREDUMP_MEMORY_REGION_INIT(tcb->StkBasePtr, sanitized);
      }
    }

    OS_TCB *next = tcb->DbgNextPtr;
    if (next != NULL &&
        memfault_platform_sanitize_address_range(next, sizeof(OS_TCB)) < sizeof(OS_TCB)) {
      break;
    }
    tcb = next;
  }
#endif

  *num_regions = (size_t)region_idx;
  return s_coredump_regions;
}
To confirm you have enough coredump storage for all tasks and their stacks, use
memfault_coredump_storage_check_size()
after making these changes.
Other RTOSs
Memfault also supports these other RTOSs: Argon, ChibiOS, Mynewt, NuttX, Quantum Platform, and Keil RTX5 / ARM mbedOS 2.