MCU Metrics
There are many system health vitals that are useful to track aside from crashes and reboots. The options are numerous, but you can expand the toggle to get a few examples.
- RTOS-related statistics
- Amount of time spent in each RTOS task per unit time. This can help you understand if one task is starving the system
- Heap high water marks
- Stack high water marks
- Time MCU was in different states
- Stop, Sleep, Run Mode
- Time each peripherals were active
- Battery life statistics
- Battery state of charge percent
- Battery state of charge percent drop per hour
- Connectivity metrics (LTE, WiFi, BLE, LoRa, etc.)
- Amount of time transport was connected
- Amount of connection attempts
- Number of bytes over transport per unit time.
In the Memfault UI, you can configure Alerts based on these metrics, as well as explore metrics collected for any device.
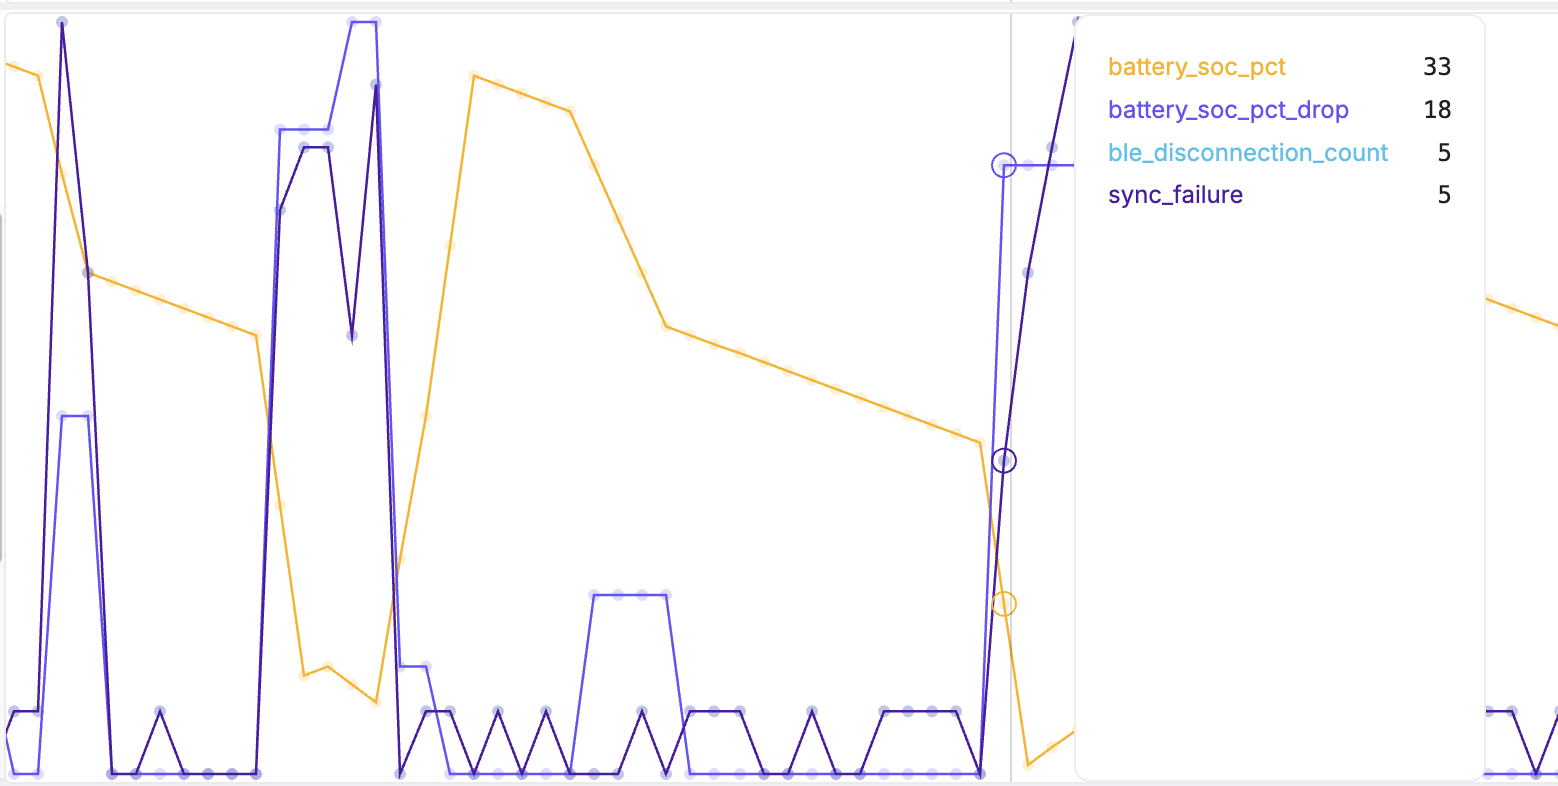
Here is an example: the number of Bluetooth disconnections, Bluetooth sync failures and the battery life were tracked. In Memfault's UI, the data that gets collected from each device over time is visualized in the metrics timeline so you can correlate metric values with each other. In this case, we see a high battery state of charge drop correlated with Bluetooth connection and sync failures.
The Memfault SDK includes a "metrics" component that makes it easy to collect this information on an embedded device. In the sections below, we will walk through how to get started with the component.
This guide assumes you have already completed the minimal integration of the Memfault SDK. If you have not, please complete the appropriate Getting Started guide.
Ingestion of Metrics may be rate-limited. Avoid sending data more than once per hour per device.
Memfault requires the symbol file to process
metrics sent from your device. Upload the <project_name>.elf file (sometimes
named <application.axf> or <application.out>, consult your build system
documentation if you are unsure, or contact us)
to Memfault by navigating to
Software → Symbol Files, and clicking the
"Upload Symbol File" button. This must be done before sending metrics data.
Built-in Metrics
A number of metrics are built into the Memfault SDK and require little to no work to enable. Before jumping into configuring your own metrics, see if there is already support for collecting the data you are interested in. The following Core Metrics are available for all systems:
There are also several platform-specific built-in metrics:
- LTE metrics (Nordic)
- Bluetooth metrics (Nordic)
- WiFi, UDP, TCP, Heap, MBedTLS, and CPU idle metrics (ESP-IDF)
Metric Categories
Metrics can generally be categorized into these buckets:
- Counters: A metric that is incremented or decremented over time. For example, the number of bytes sent over a transport.
- Gauges: A metric that is set to an instantaneous value. For example, the current battery state of charge.
- Timers: A metric that tracks the amount of time spent in a particular state or performing a particular action. For example, the amount of time the device was in a low power state.
The Memfault Firmware SDK provides convenience APIs for each of these types of metrics.
Defining Metrics
All metrics can be defined with the MEMFAULT_METRICS_KEY_DEFINE() macro in the
memfault_metrics_heartbeat_config.def created as part of your port. In this
guide, we will walk through a simple example of tracking the high water mark of
the stack for a "Main Task" in our application and the number of bytes sent out
over a Bluetooth connection.
// File $PROJECT_ROOT/third_party/memfault/memfault_metrics_heartbeat_config.def
MEMFAULT_METRICS_KEY_DEFINE(main_task_stack_hwm, kMemfaultMetricType_Unsigned)
MEMFAULT_METRICS_KEY_DEFINE(bt_tx_bytes, kMemfaultMetricType_Unsigned)
MEMFAULT_METRICS_STRING_KEY_DEFINE(manufacture_date, sizeof("2022-05-09"))
Dependency Function Overview
The metrics subsystem uses the "timer" implemented as part of your initial port
to control when data is aggregated into a "heartbeat". When the Heartbeat
subsystem is booted, a dependency function
memfault_platform_metrics_timer_boot is called to set up this timer. Most
RTOSs have a software timer implementation that can be directly mapped to the
API or a hardware timer can be used as well. The expectation is that callback
will be invoked every period_sec (which by default is once / hour).
The metrics subsystem supports a timer type (kMemfaultMetricType_Timer), which
can easily track durations (i.e., time spent in MCU stop mode) and overall
system uptime. To support this, the memfault_platform_get_time_since_boot_ms()
function implemented as part of the initial port is used. Typically, this
information is derived from either a system's Real Time Clock (RTC) or the
SysTick counter used by an RTOS.
Setting Metric Values
There's a set of APIs in components/include/memfault/metrics/metrics.h, which
can easily update Heartbeats as events occur. The updates occur in RAM, so there
is negligible overhead introduced. Here's an example:
#include "memfault/metrics/metrics.h"
// [ ... ]
void bluetooth_driver_send_bytes(const void *data, size_t data_len) {
  MEMFAULT_METRIC_ADD(bt_tx_bytes, data_len);
  // [ ... code to send Bluetooth data ... ]
}
String metrics are stored in the same Heartbeat snapshot. The process for setting a string metric might look like this, for example:
#include "memfault/metrics/metrics.h"
void set_manufacturing_date_metric(const char *manufacturing_date) {
  // set the manufacturing date string metric
  MEMFAULT_METRIC_SET_STRING(manufacture_date, manufacturing_date);

  // optionally, trigger a Heartbeat to immediately capture the metric record
  // for debugging purposes (not recommended for production)
  memfault_metrics_heartbeat_debug_trigger();

  // optionally, trigger an upload of Memfault chunk data
  // [ ... code to trigger memfault upload ... ]
}
If a string metric is not reported in a Heartbeat interval, the previously reported value will not be overwritten by Memfault's backend. This can be used for bandwidth optimization by only reporting values on bootup or when they change.
For SDK versions 0.42.0 and above, if an integer metric is not set in a Heartbeat interval, a null value is sent and ignored by Memfault's backend. For SDK versions before 0.42.0, a value of 0 is sent and recorded.
Including Sampled Values in a Heartbeat
memfault_metrics_heartbeat_collect_data() is called at the very end of each
Heartbeat interval.
By default, this is a weak empty function, but you will want to implement it if there's data you want to sample and include in a Heartbeat (i.e. recorded RSSI, battery level, stack high water marks, etc).
The main_task_stack_hwm we are tracking in this guide is a good example of how
to make use of this function.
#include "memfault/metrics/platform/overrides.h"
// [...]
void memfault_metrics_heartbeat_collect_data(void) {
  // NOTE: When using FreeRTOS we can just call
  // "uxTaskGetStackHighWaterMark(s_main_task_tcb)"
  const uint32_t stack_high_water_mark = // TODO: code to get high water mark
  MEMFAULT_METRIC_SET_UNSIGNED(main_task_stack_hwm, stack_high_water_mark);
}
If the implementation of memfault_metrics_heartbeat_collect_data() is in a C++
compilation unit (eg memfault_platform_port.cpp), make sure to include the C
header file memfault/metrics/platform/overrides.h to ensure the function is
declared with C linkage.
Otherwise, the linker will not be able to find the function when linking the final binary, and the weakly-defined function in the SDK will be used instead:
❯ nm --line-numbers build/qemu_mps2_an385/main.elf | grep memfault_metrics_heartbeat_collect_data
# weak definition "W" below, which is used in the final program since there is
# no matching strong definition
00006a79 W memfault_metrics_heartbeat_collect_data      memfault-firmware-sdk/components/metrics/src/memfault_metrics.c:496

# the cpp implementation was name-mangled at compilation time
❯ nm --line-numbers build/memfault_platform_port.cpp.o | grep memfault_metrics_heartbeat_collect_data
00000001 T _Z39memfault_metrics_heartbeat_collect_datav
Initial Setup & Debug APIs
While integrating the Heartbeat metrics subsystem or adding new metrics, you can debug and test the new code in a few easy ways. Notably:
-
memfault_metrics_heartbeat_debug_trigger()can be called at any time to trigger a Heartbeat serialization (so you don't have to wait for the entire interval to get data to flush).warningmemfault_metrics_heartbeat_debug_trigger()is for debugging purposes. It not recommended for use in production since it causes inconsistent heartbeat lengths. -
memfault_metrics_heartbeat_debug_print()can be called to dump the current value of all the metrics being tracked -
The Heartbeat interval can be reduced from the default 3600 seconds for debugging purposes by setting
MEMFAULT_METRICS_HEARTBEAT_INTERVAL_SECSin yourmemfault_platform_config.hinterval to a shorter period, such as 30 seconds.
Metrics Storage
Metric events are stored in the in-memory ring buffer supplied to the
memfault_metrics_boot() initialization function on boot. For example:
loading...
It may be necessary to adjust the size of the buffer to fit the application's needs; for example, if the device uploads data to Memfault infrequently, the buffer may need to be increased.
Non-volatile Event Storage
The Memfault SDK provides a way to configure a non-volatile supplementary store for the event buffer.
To learn more about that component, see the following header files, which explain how it works:
components/include/memfault/core/platform/nonvolatile_event_storage.hcomponents/include/memfault/core/event_storage.h#L64-L98
Non-volatile Event Storage is not typically worth the added complexity. It can apply to the following scenarios, however:
- Devices with extremely infrequent connectivity, needing to cache multiple weeks/months of data
- Frequent power loss conditions: devices need to aggressively persist data to non volatile storage medium
- Extremely limited RAM for buffering Event Storage data (i.e. < 1kB available) combined with infrequent connectivity. This case can be mitigated by increasing the heartbeat interval to greater than 1 hour; for example, increase it to 6 hours (4 heartbeats per day) to reduce the amount of data stored in RAM.
Timestamping Metrics on Device
For devices that have an onboard source of time (RTC or GNSS receiver, etc), it can be useful to add a timestamp to metrics. This will set a "recorded time" value on the metric when it's decoded by Memfault's server, and the metric reports will show accordingly in the device's timeline.
A detailed description can be found in the Event Timestamps documentation page.
Metric Types
The Memfault SDK supports the following metric types:
| Type | Description |
|---|---|
kMemfaultMetricType_Signed | Signed integer |
kMemfaultMetricType_Unsigned | Unsigned integer |
kMemfaultMetricType_Timer | Timer (duration in ms) |
kMemfaultMetricType_String | String |
Signed and Unsigned Integer Metrics
Unsigned and signed metrics are stored as 32-bit integers. To define these metrics:
MEMFAULT_METRICS_KEY_DEFINE(my_signed_metric, kMemfaultMetricType_Signed)
MEMFAULT_METRICS_KEY_DEFINE(my_unsigned_metric, kMemfaultMetricType_Unsigned)
To set the value of these metrics:
// Set the metric value
MEMFAULT_METRIC_SET_SIGNED(my_signed_metric, -1234);
MEMFAULT_METRIC_SET_UNSIGNED(my_unsigned_metric, 1234);

// Increment the metric value
MEMFAULT_METRIC_ADD(my_signed_metric, 1);
MEMFAULT_METRIC_ADD(my_unsigned_metric, 1);
Metric Ranges
Both unsigned and signed integer metrics can have an optional range specified. The specified range can be used by Memfault to filter received metric values outside the range. Memfault allows you to configure how to handle receiving out of range values, either accepting or discarding them. By default, all values are accepted. For information on ranges and configuring these options, see Metrics - Ingress Filtering.
To specify a metric with a range in your code:
// Define an unsigned integer with a range
MEMFAULT_METRICS_KEY_DEFINE_WITH_RANGE(storage_capacity_remaining, kMemfaultMetricType_Unsigned, 0, 100)
// Define a signed integer with a range
MEMFAULT_METRICS_KEY_DEFINE_WITH_RANGE(operating_temperature, kMemfaultMetricType_Signed, -40, 200)
// Define a session metric with a range
MEMFAULT_METRICS_KEY_DEFINE_WITH_RANGE_AND_SESSION(
  temperature_change, kMemfaultMetricType_Signed, -40, 200, user_session
)
Metric Scale Values
An optional scale value can be defined for integer metric types. Memfault will scale down received metric values by the scale value when the data is received. This is useful for collecting data as an integer metric and later applying the scale value to transform the value into a float. An example usage is reporting integer milliVolts and scaling to a floating point value in Volts.
To specify a metric a scale value in your code:
// Define a signed integer with a scale value. In this example our value is
// measured in millivolts.
// Using a scale value we can transform this into volts after Memfault receives the metric values
MEMFAULT_METRICS_KEY_DEFINE_WITH_SCALE_VALUE(battery_volts_mv, kMemfaultMetricType_Signed, 1000)
// Define an unsigned integer with a scale value and session. This example metric measures main
// task time as a permille of the total CPU time (ie. 0.0-100.0%)
MEMFAULT_METRICS_KEY_DEFINE_WITH_SESSION_AND_SCALE_VALUE(
  main_task_cpu_permille, kMemfaultMetricType_Unsigned, user_session, 10
)
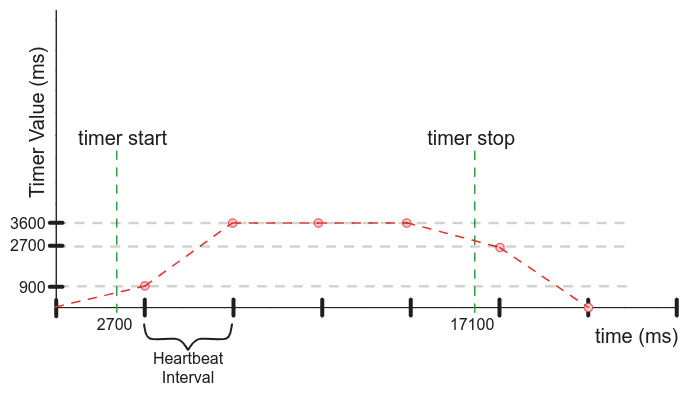
Timer Metrics
Timer metrics track a duration of time, in milliseconds. They are stored as 32-bit integers, and are tallied at the end of a Heartbeat interval; the timer metric value is stored per-interval, so a continuously running timer will report values equivalent to the Heartbeat interval:
To define a timer metric:
MEMFAULT_METRICS_KEY_DEFINE(my_timer_metric_ms, kMemfaultMetricType_Timer)
To start and stop the timer:
// Start the timer
MEMFAULT_METRIC_TIMER_START(my_timer_metric_ms);
// [ ... code to time ... ]
// Stop the timer
MEMFAULT_METRIC_TIMER_STOP(my_timer_metric_ms);
String Metrics
String metrics are stored as a fixed-length string. The maximum length of the string is defined when the metric is defined. To define a string metric:
MEMFAULT_METRICS_STRING_KEY_DEFINE(my_string_metric, 32)
To set the value of the string metric:
MEMFAULT_METRIC_SET_STRING(my_string_metric, "my string value");
String metrics are serialized in the next Heartbeat after they are set.
Session Metrics
In addition to the above described Heartbeat metrics, Memfault provides another Metric Report type; Session metrics. Session metrics are similar to Heartbeats, but differ in how the window of time is set. For Heartbeat metrics the time window is a fixed, periodic interval, whereas session metrics are tracked over the length of a specific event.
For a concrete example: imagine a device that periodically transmits data over LTE. You may want to collect some information about what happens during each connection. It might be interesting to know the percent battery dropped, number of bytes sent, and length of each LTE connection.
Defining Session Metrics
First define the Session using the MEMFAULT_METRICS_SESSION_KEY_DEFINE()
macro:
MEMFAULT_METRICS_SESSION_KEY_DEFINE(lte)
Similar to Heartbeat metrics, session metrics are defined with a set of macros. All metric types supported by Heartbeats are supported by sessions.
MEMFAULT_METRICS_KEY_DEFINE_WITH_SESSION(battery_drop_pct, kMemfaultMetricType_Unsigned, lte)
MEMFAULT_METRICS_KEY_DEFINE_WITH_SESSION(snr_decibels, kMemfaultMetricType_Signed, lte)
MEMFAULT_METRICS_STRING_KEY_DEFINE_WITH_SESSION(carrier_tower, 50, lte)
Once the metric is defined, it can be set in the same way as Heartbeat metrics, but with a different API which includes the session key:
MEMFAULT_METRIC_SESSION_SET_UNSIGNED(battery_drop_pct, lte, 10);
MEMFAULT_METRIC_SESSION_SET_SIGNED(snr_decibels, lte, -100);
MEMFAULT_METRIC_SESSION_SET_STRING(carrier_tower, lte, "ACME");
See the Metric Types section for more info on setting metric values.
Example Session Usage
Here's a basic example of how to use a Metric Session to track a long-running activity: an LTE connection. This example tracks the following session metrics:
battery_connection_start_soc_pct: The battery state-of-charge when the device starts attempting to connect LTE.battery_connection_end_soc_pct: The battery state-of-charge at the end of the connection.battery_drop_pct: The percentage of battery dropped during the connection.bytes_sent: The number of bytes sent over LTE.bytes_received: The number of bytes received over LTE.lte_connecting_time_ms: The time it takes for the device to connect to LTE.lte_connected_time_ms: The time the device is connected to LTE.
The total session duration (duration_ms) is automatically tracked by Memfault.
#include "memfault/components.h"

void my_lte_state_change_handler(enum LteState state) {
  static uint32_t battery_connection_start_soc_pct;
  switch (state) {
    case LTE_STATE_START_CONNECTING:
      // Start the LTE session
      MEMFAULT_METRICS_SESSION_START(lte);
      // Record battery state-of-charge when the device starts attempting to
      // connect LTE.
      battery_connection_start_soc_pct = 100;
      MEMFAULT_METRIC_SESSION_SET_UNSIGNED(battery_connection_start_soc_pct, lte,
        battery_connection_start_soc_pct);
      // Start a timer to track how long it takes for connection to complete
      MEMFAULT_METRIC_SESSION_TIMER_START(lte_connecting_time_ms, lte);
      break;
    case LTE_STATE_CONNECTED:
      // Stop the connecting time timer
      MEMFAULT_METRIC_SESSION_TIMER_STOP(lte_connecting_time_ms, lte);
      // Start the connected time timer
      MEMFAULT_METRIC_SESSION_TIMER_START(lte_connected_time_ms, lte);
      break;
    case LTE_STATE_DISCONNECTED:
      // Stop the connected time timer
      MEMFAULT_METRIC_SESSION_TIMER_STOP(lte_connected_time_ms, lte);
      // Record battery state-of-charge at the end of the connection
      uint32_t battery_connection_end_soc_pct = 50;
      MEMFAULT_METRIC_SESSION_SET_UNSIGNED(battery_connection_end_soc_pct, lte, battery_connection_end_soc_pct);
      // Record the battery state-of-charge drop during the connection
      if (battery_connection_start_soc_pct >= battery_connection_end_soc_pct) {
        MEMFAULT_METRIC_SESSION_SET_UNSIGNED(battery_drop_pct, lte,
          battery_connection_start_soc_pct - battery_connection_end_soc_pct);
      }
      // Record number of bytes sent and received
      MEMFAULT_METRIC_SESSION_SET_UNSIGNED(bytes_sent, lte, 1000);
      MEMFAULT_METRIC_SESSION_SET_UNSIGNED(bytes_received, lte, 2000);
      // End the LTE session
      MEMFAULT_METRICS_SESSION_END(lte);
      break;
    default:
      break;
  }
}
Session Metric Name Space
Session Metrics are namespaced by the session key. This means that the same
metric key can be used in multiple sessions without conflict. For example, the
battery_drop_pct metric can be used in both the Heartbeat and LTE session
without conflict.
MEMFAULT_METRICS_KEY_DEFINE(battery_drop_pct, kMemfaultMetricType_Signed,)
MEMFAULT_METRICS_KEY_DEFINE_WITH_SESSION(battery_drop_pct, kMemfaultMetricType_Signed, lte)
...
// Set the battery drop percentage in the Heartbeat
MEMFAULT_METRIC_SET_UNSIGNED(battery_drop_pct, 10);
// Set the battery drop percentage in the LTE session
MEMFAULT_METRIC_SESSION_SET_UNSIGNED(battery_drop_pct, lte, 10);
Session Metric Callbacks
There are a class of metrics where you may only be interested in the value at
the start or end of a session. For example, the battery_drop_pct metric tracks
how much our battery dropped over the course of the session, so we should only
measure it at the end of the session.
The Memfault SDK provides the ability to register callback functions that are
called either before or after a session, for this usage pattern (just like
memfault_metrics_heartbeat_collect_data()
for Heartbeat Metrics).
// Callback called before a session is started
void memfault_metrics_session_register_start_cb(eMfltMetricsSessionIndex session_key,
                                              MemfaultMetricsSessionStartCb session_start_cb);

// Callback called after a session is complete
void memfault_metrics_session_register_end_cb(eMfltMetricsSessionIndex session_key,
                                              MemfaultMetricsSessionEndCb session_end_cb);
The type Signature for these functions is as follows:
typedef void (*MemfaultMetricsSessionEndCb)(void);
An example usage of the session end callback:
static void prv_lte_session_end_cb(void) {
  MEMFAULT_METRIC_SESSION_SET_UNSIGNED(battery_drop_pct, lte, 50);
}
void my_session_start_event_handler(void) {
  memfault_metrics_session_register_end_cb(MEMFAULT_METRICS_SESSION_KEY(lte),
                                           prv_lte_session_end_cb);
  MEMFAULT_METRICS_SESSION_START(lte);
}
void my_session_end_event_handler(void) {
  MEMFAULT_METRICS_SESSION_END(lte);
}