ARM Cortex-M Integration Guide
The following guide will walk you through step-by-step how to integrate and test the Memfault SDK for a Cortex-M device using the GNU GCC, Clang, IAR, ARM MDK, or TI ARM Compiler.
Adding the Memfault Firmware SDK to your device will provide rich diagnostics, including:
Coredump Collection
Device Metrics
Reboot Reason Tracking
Error Tracking with Trace Events
(Optionally) Collect a coredump capture using GDB
- Without GDB
- Using GDB
If you do not use GDB, skip ahead to the next step.
If you use GDB, a full coredump can be captured by just using the debugger! This
can be useful during development to take advantage of Memfault's analyzers when
a device crashes or hangs.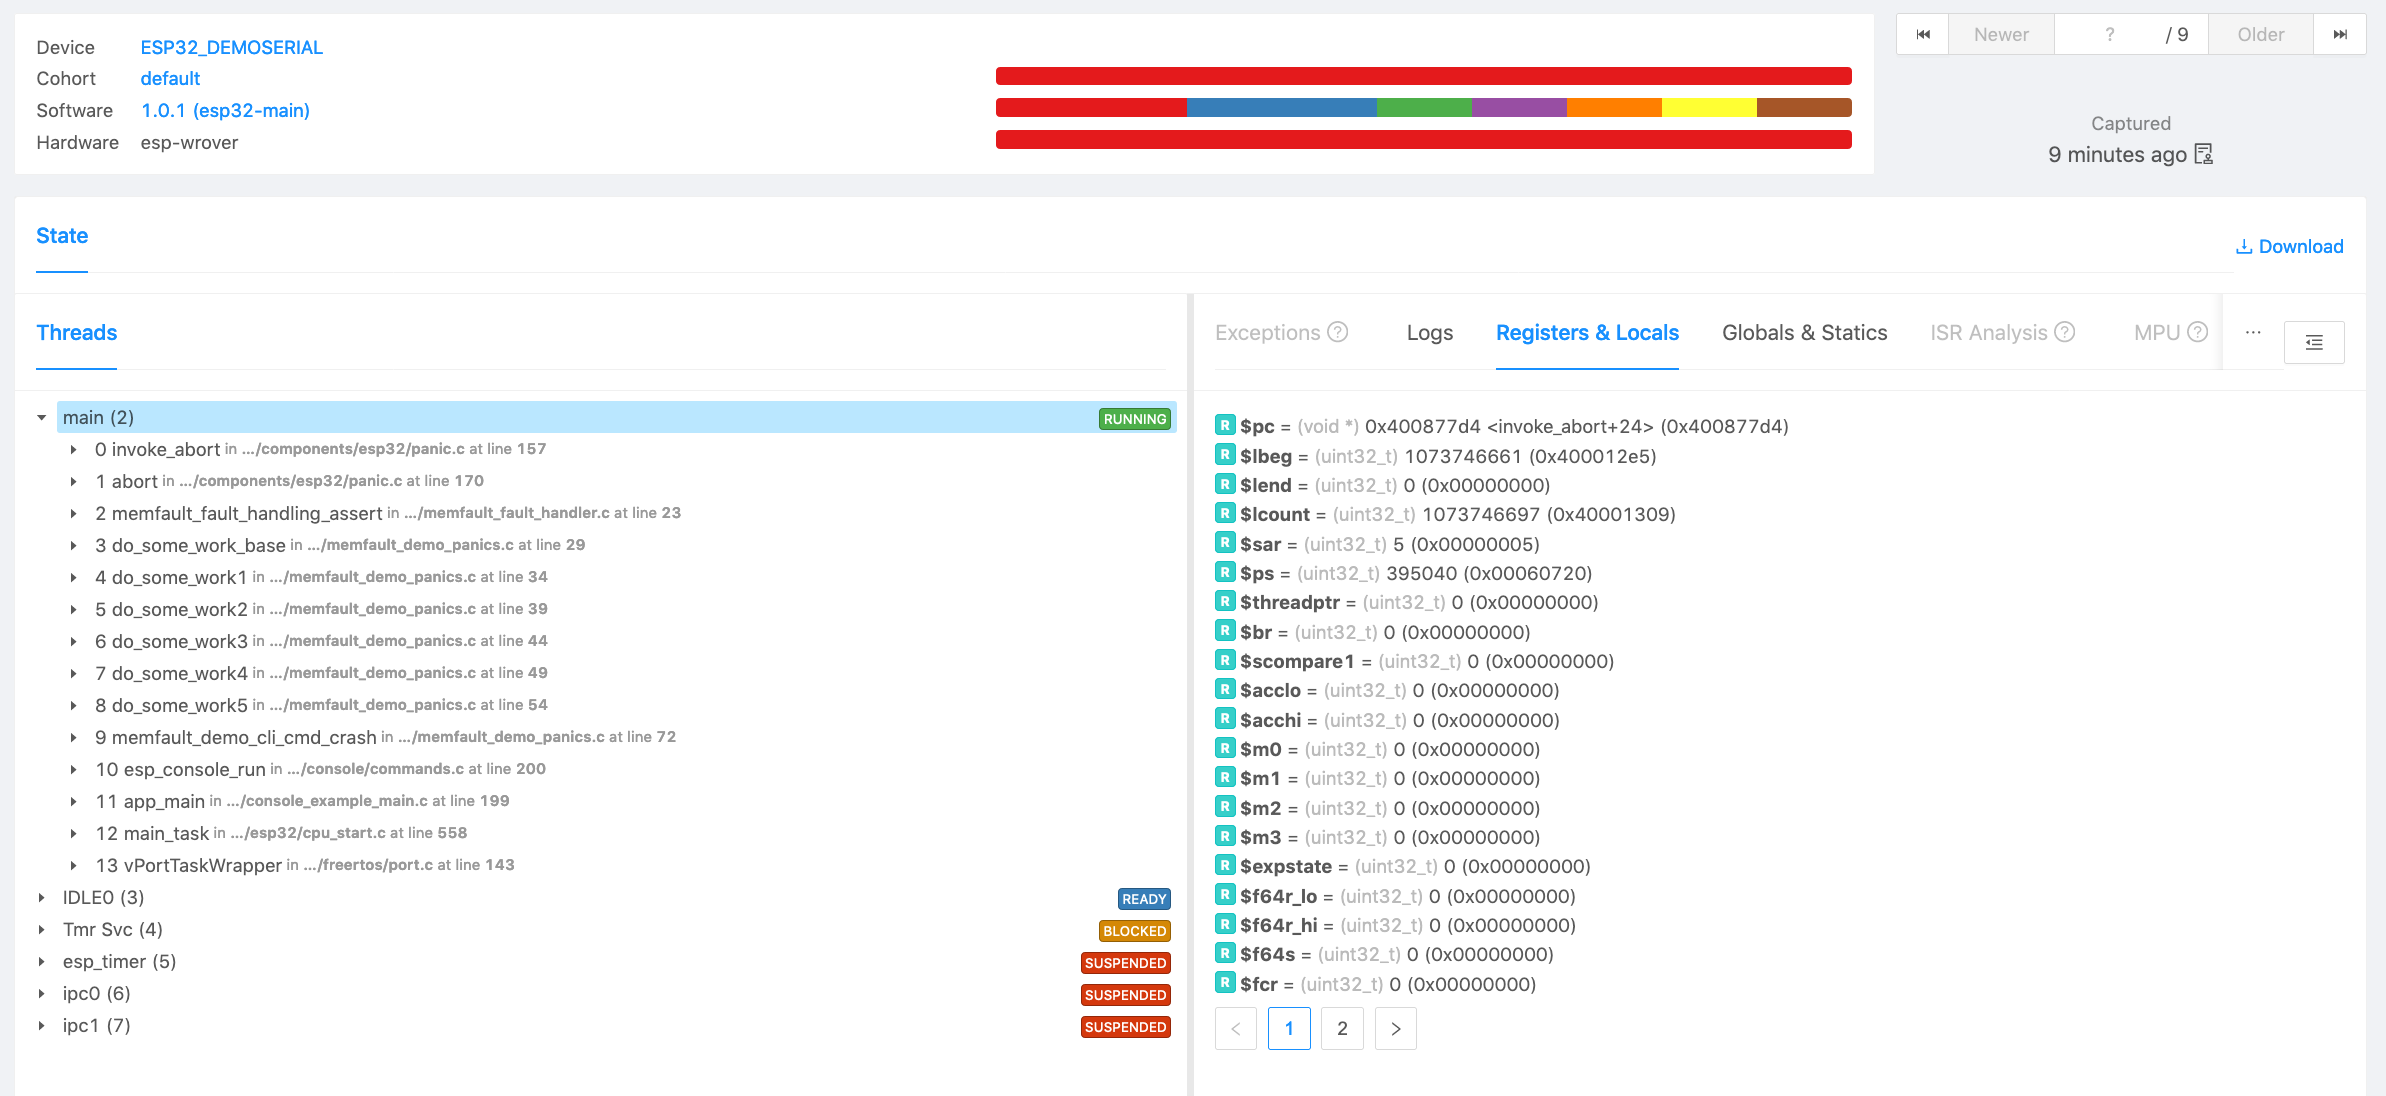
To perform the capture, navigate to https://app.memfault.com/ and select the "Issues" page in the Memfault UI, click on the "Manual Upload" button, and click on "walk-through on how to upload your first coredump". From there you can follow the guided steps to perform a capture. At the end you will see an analysis of your system state.
1. Create a Project
Create a Project and get a Project Key
Go to app.memfault.com and from the "Select A Project" dropdown, click on "Create Project" to setup your first project. Choose a name that reflects your product, such as "smart-sink-dev".
Once you've created your project, you'll be automatically taken to an page that includes your project key. Copy the key and follow the rest of this guide.
2. Set up the SDK
Prepare folder for memfault-firmware-sdk & port
The memfault-firmware-sdk is a self-contained C SDK you will need to include
into your project.
Create a folder to hold memfault-firmware-sdk as well as the configuration and
porting files to your platform.
cd ${YOUR_PROJECT_DIR}
mkdir -p third_party/memfault

cd third_party/memfault

# Add memfault repo as submodule, subtree, or copy in as source directly
git submodule add https://github.com/memfault/memfault-firmware-sdk.git memfault-firmware-sdk

cp memfault-firmware-sdk/ports/templates/* .
When you are done, you should have the following directory structure in your project:
memfault/
//...
├── memfault-firmware-sdk (submodule)
| # Files where port / glue layer to your platform will be implemented
├── memfault_platform_port.c
|
| # Configuration Headers
├── memfault_metrics_heartbeat_config.def
└── memfault_trace_reason_user_config.def
└── memfault_platform_log_config.h
└── memfault_platform_config.h
Add Sources to Build System
Based on the build system you are using, expand the appropriate tab below and follow the steps to add the sources to your target
- Make
- CMake
- Other
MEMFAULT_PORT_ROOT := <YOUR_PROJECT_ROOT>/third_party/memfault
MEMFAULT_SDK_ROOT := $(MEMFAULT_PORT_ROOT)/memfault-firmware-sdk

MEMFAULT_COMPONENTS := core util panics metrics
include $(MEMFAULT_SDK_ROOT)/makefiles/MemfaultWorker.mk

<YOUR_SRC_FILES> += \
  $(MEMFAULT_COMPONENTS_SRCS) \
  $(MEMFAULT_PORT_ROOT)/memfault_platform_port.c

<YOUR_INCLUDE_PATHS> += \
  $(MEMFAULT_COMPONENTS_INC_FOLDERS) \
  $(MEMFAULT_SDK_ROOT)/ports/include \
  $(MEMFAULT_PORT_ROOT)
Be sure to update YOUR_SRC_FILES, YOUR_INCLUDE_PATHS, and
YOUR_PROJECT_ROOT accordingly for your system above!
set(MEMFAULT_PORT_ROOT <YOUR_PROJECT_ROOT>/third_party/memfault)
set(MEMFAULT_SDK_ROOT ${MEMFAULT_PORT_ROOT}/memfault-firmware-sdk)

list(APPEND MEMFAULT_COMPONENTS core util panics metrics)
include(${MEMFAULT_SDK_ROOT}/cmake/Memfault.cmake)
memfault_library(${MEMFAULT_SDK_ROOT} MEMFAULT_COMPONENTS
 MEMFAULT_COMPONENTS_SRCS MEMFAULT_COMPONENTS_INC_FOLDERS)

# Add the following to your target sources:
#   ${MEMFAULT_COMPONENTS_SRCS}
#   ${MEMFAULT_PORT_ROOT}/memfault_platform_port.c
#
# Add the following to your target includes
#   ${MEMFAULT_COMPONENTS_INC_FOLDERS}
#   ${MEMFAULT_SDK_ROOT}/ports/include
#   ${MEMFAULT_PORT_ROOT}
Be sure to update YOUR_PROJECT_ROOT, add ${MEMFAULT_COMPONENTS_SRCS} to your
target sources and ${MEMFAULT_COMPONENTS_INC_FOLDERS} to your target includes
accordingly
- add
$MEMFAULT_FIRMWARE_SDK/components/includeto the include paths for your project - add
$MEMFAULT_FIRMWARE_SDK/ports/includeto the include paths for your project - add the sources under
$MEMFAULT_FIRMWARE_SDK/components/[core, util, panics, metrics]/src/**/*.cto your project - add
third_party/memfault/memfault_platform_port.csources to project - add
third_party/memfault/to the include paths for your project
When using Eclipse as your build system, folders can be opted out from a build by right clicking on the folder and selecting "Resource Configuration" -> "Exclude from Build".
Core Dependencies
Open the
memfault_platform_port.c
copied into your third_party/memfault folder and fill out the stub
implementations accordingly.
Initialize Memfault Subsystem On Bootup
From your main routine, add a call to memfault_platform_boot() prior to the
startup of an RTOS or baremetal while loop.
#include "memfault/components.h"

// ...

int main(void) {
  // ...
  memfault_platform_boot();
  // ...
}
Reboot Tracking Dependencies
Memfault has a module for tracking and reporting what resets are taking place on your platform.
- nRF5 SDK
- STM32
- NXP S32 SDK
- EFM/EFR (Gecko SDK)
- NXP RW610/611/612
- SiLabs SiWx91x
- Other
Add the following file to your build system:
${MEMFAULT_SDK_ROOT}/ports/nrf5_sdk/resetreas_reboot_tracking.c
STM32CubeF4
Add the following file to your build system:
${MEMFAULT_SDK_ROOT}/ports/stm32cube/f4/rcc_reboot_tracking.c
STM32CubeF7
Add the following file to your build system:
${MEMFAULT_SDK_ROOT}/ports/stm32cube/f7/rcc_reboot_tracking.c
STM32CubeH7
Add the following file to your build system:
${MEMFAULT_SDK_ROOT}/ports/stm32cube/h7/rcc_reboot_tracking.c
STM32CubeL4
Add the following file to your build system:
${MEMFAULT_SDK_ROOT}/ports/stm32cube/l4/rcc_reboot_tracking.c
STM32CubeU5
Add the following file to your build system:
${MEMFAULT_SDK_ROOT}/ports/stm32cube/u5/rcc_reboot_tracking.c
STM32CubeWB
Add the following file to your build system:
${MEMFAULT_SDK_ROOT}/ports/stm32cube/wb/rcc_reboot_tracking.c
Allocate noinit region & Collect Reboot Info
Add the following to your memfault_platform_port.c
//! @file memfault_platform_port.c

MEMFAULT_PUT_IN_SECTION(".noinit.mflt_reboot_tracking")
static uint8_t s_reboot_tracking[MEMFAULT_REBOOT_TRACKING_REGION_SIZE];

void memfault_platform_reboot_tracking_boot(void) {
  sResetBootupInfo reset_info = { 0 };
  memfault_reboot_reason_get(&reset_info);
  memfault_reboot_tracking_boot(s_reboot_tracking, &reset_info);
}
It's expected that Add the following to your Add the following to your Add the following to your s_reboot_tracking is placed in "noinit" RAM. That is, a
region of RAM not initialized on bootup or used by your bootloaders. This can be
achieved by adding a "noinit" section to your linker script.GNU GCC Example
.ld file:ARM MDK Example
.sct file:IAR Example
.icf file:
Add the following file to your build system:
${MEMFAULT_SDK_ROOT}/ports/s32sdk/rcm_reboot_tracking.c
Allocate noinit region & Collect Reboot Info
Add the following to your memfault_platform_port.c
//! @file memfault_platform_port.c

MEMFAULT_PUT_IN_SECTION(".noinit.mflt_reboot_tracking")
static uint8_t s_reboot_tracking[MEMFAULT_REBOOT_TRACKING_REGION_SIZE];

void memfault_platform_reboot_tracking_boot(void) {
  sResetBootupInfo reset_info = { 0 };
  memfault_reboot_reason_get(&reset_info);
  memfault_reboot_tracking_boot(s_reboot_tracking, &reset_info);
}
It's expected that Add the following to your Add the following to your Add the following to your s_reboot_tracking is placed in "noinit" RAM. That is, a
region of RAM not initialized on bootup or used by your bootloaders. This can be
achieved by adding a "noinit" section to your linker script.GNU GCC Example
.ld file:ARM MDK Example
.sct file:IAR Example
.icf file:
Add the following file to your build system:
${MEMFAULT_SDK_ROOT}/ports/emlib/rmu_reboot_tracking.c
Allocate noinit region & Collect Reboot Info
Add the following to your memfault_platform_port.c
//! @file memfault_platform_port.c

MEMFAULT_PUT_IN_SECTION(".noinit.mflt_reboot_tracking")
static uint8_t s_reboot_tracking[MEMFAULT_REBOOT_TRACKING_REGION_SIZE];

void memfault_platform_reboot_tracking_boot(void) {
  sResetBootupInfo reset_info = { 0 };
  memfault_reboot_reason_get(&reset_info);
  memfault_reboot_tracking_boot(s_reboot_tracking, &reset_info);
}
It's expected that Add the following to your Add the following to your Add the following to your s_reboot_tracking is placed in "noinit" RAM. That is, a
region of RAM not initialized on bootup or used by your bootloaders. This can be
achieved by adding a "noinit" section to your linker script.GNU GCC Example
.ld file:ARM MDK Example
.sct file:IAR Example
.icf file:
Add the following file to your build system:
${MEMFAULT_SDK_ROOT}/ports/nxp/rw61x/pmu_reboot_tracking.c
Allocate noinit region & Collect Reboot Info
Add the following to your memfault_platform_port.c
//! @file memfault_platform_port.c

MEMFAULT_PUT_IN_SECTION(".noinit.mflt_reboot_tracking")
static uint8_t s_reboot_tracking[MEMFAULT_REBOOT_TRACKING_REGION_SIZE];

void memfault_platform_reboot_tracking_boot(void) {
  sResetBootupInfo reset_info = { 0 };
  memfault_reboot_reason_get(&reset_info);
  memfault_reboot_tracking_boot(s_reboot_tracking, &reset_info);
}
It's expected that Add the following to your Add the following to your Add the following to your s_reboot_tracking is placed in "noinit" RAM. That is, a
region of RAM not initialized on bootup or used by your bootloaders. This can be
achieved by adding a "noinit" section to your linker script.GNU GCC Example
.ld file:ARM MDK Example
.sct file:IAR Example
.icf file:
Add the following file to your build system:
${MEMFAULT_SDK_ROOT}/orts/silabs/wiseconnect/siwx91x/siwx91x_reboot_tracking.c
As described in that file, you will need to add the following code to your
Reset_Handler implementation (or wherever your application calls
SystemInit()), for example:
#include "si91x_device.h"
void Reset_Handler(void) {
  // Load the global variable with the contents of MCU_FSM_WAKEUP_STATUS_REG
  extern uint32_t memfault_siwx91x_fsm_wakeup_status_reg;
  memfault_siwx91x_fsm_wakeup_status_reg = MCU_FSM->MCU_FSM_WAKEUP_STATUS_REG;
  // Call SystemInit() to initialize the system
  SystemInit();
  // Call the main function
  main();
}
Allocate noinit region & Collect Reboot Info
Add the following to your memfault_platform_port.c
//! @file memfault_platform_port.c

MEMFAULT_PUT_IN_SECTION(".noinit.mflt_reboot_tracking")
static uint8_t s_reboot_tracking[MEMFAULT_REBOOT_TRACKING_REGION_SIZE];

void memfault_platform_reboot_tracking_boot(void) {
  sResetBootupInfo reset_info = { 0 };
  memfault_reboot_reason_get(&reset_info);
  memfault_reboot_tracking_boot(s_reboot_tracking, &reset_info);
}
It's expected that Add the following to your Add the following to your Add the following to your s_reboot_tracking is placed in "noinit" RAM. That is, a
region of RAM not initialized on bootup or used by your bootloaders. This can be
achieved by adding a "noinit" section to your linker script.GNU GCC Example
.ld file:ARM MDK Example
.sct file:IAR Example
.icf file:
Implement the following function for your MCU. The ports listed in other tabs serve as a good reference.
//! @file memfault_platform_port.c

void memfault_reboot_reason_get(sResetBootupInfo *info) {
  const uint32_t reset_cause = 0; // TODO: Populate with MCU reset reason
  eMemfaultRebootReason reset_reason = kMfltRebootReason_Unknown;

  // TODO: Convert MCU specific reboot reason to memfault enum

  *info = (sResetBootupInfo) {
    .reset_reason_reg = reset_cause,
    .reset_reason = reset_reason,
  };
}
Allocate noinit region & Collect Reboot Info
Add the following to your memfault_platform_port.c
//! @file memfault_platform_port.c

MEMFAULT_PUT_IN_SECTION(".noinit.mflt_reboot_tracking")
static uint8_t s_reboot_tracking[MEMFAULT_REBOOT_TRACKING_REGION_SIZE];

void memfault_platform_reboot_tracking_boot(void) {
  sResetBootupInfo reset_info = { 0 };
  memfault_reboot_reason_get(&reset_info);
  memfault_reboot_tracking_boot(s_reboot_tracking, &reset_info);
}
It's expected that Add the following to your Add the following to your Add the following to your s_reboot_tracking is placed in "noinit" RAM. That is, a
region of RAM not initialized on bootup or used by your bootloaders. This can be
achieved by adding a "noinit" section to your linker script.GNU GCC Example
.ld file:ARM MDK Example
.sct file:IAR Example
.icf file:
Implement Coredump Storage Dependency
When the system faults or asserts crash information can be recorded and sent to Memfault after the device reboots. In order for this information to be saved, it must be persisted to a storage area that persists across a device reset.
Implement Coredump Storage Area
Coredumps can be saved in a .noinit region of SRAM, internal flash, external
flash, or even streamed out over a peripheral to another MCU when a coredump
takes place.
- RAM-backed
- EFM/EFR (Gecko SDK)
- STM32
- nRF5 SDK
- NXP S32 SDK
- Other
1. Add source code
Add the following file to your build system:
${MEMFAULT_SDK_ROOT}/ports/panics/src/memfault_platform_ram_backed_coredump.c
2. Configure Coredump Region
The RAM region is placed in a special section Add the following to your Add the following to your Add the following to your .noinit.mflt_coredump which
needs to be placed in a noinit memory region. This can be achieved by adding a
noinit section to your linker script. Check out the following examples for
your compiler/linker:GNU GCC Example
.ld file:ARM MDK Example
.sct file:IAR Example
.icf file:
Add the following file to your build system:
${MEMFAULT_SDK_ROOT}/ports/emlib/msc_coredump_storage.c
Follow instructions in msc_coredump_storage.c to configure.
STM32F4 internal flash using STM32CubeF4
Add the following file to your build system:
${MEMFAULT_SDK_ROOT}/ports/stm32cube/f4/flash_coredump_storage.c
Follow instructions in flash_coredump_storage.c to configure.
STM32L4 internal flash using STM32CubeL4
Add the following file to your build system:
${MEMFAULT_SDK_ROOT}/ports/stm32cube/l4/flash_coredump_storage.c
Follow instructions in flash_coredump_storage.c to configure.
STM32WB internal flash using STM32CubeWB
Add the following file to your build system:
${MEMFAULT_SDK_ROOT}/ports/stm32cube/wb/flash_coredump_storage.c
Follow instructions in flash_coredump_storage.c to configure.
STM32U5 internal flash using STM32CubeU5
Add the following file to your build system:
${MEMFAULT_SDK_ROOT}/ports/stm32cube/u5/flash_coredump_storage.c
Follow instructions in flash_coredump_storage.c to configure.
nRF5xx internal flash using nRF5 SDK
Add the following file to your build system:
${MEMFAULT_SDK_ROOT}/ports/nrf5_sdk/nrf5_coredump_storage.c
Follow instructions in nrf5_coredump_storage.c to configure.
NXP S32 SDK
Add the following file to your build system:
${MEMFAULT_SDK_ROOT}/ports/s32sdk/ftfc_flash_coredump_storage.c
Follow instructions in ftfc_flash_coredump_storage.c to configure.
Custom Port Template
//! @file memfault_platform_port.c

void memfault_platform_coredump_storage_get_info(sMfltCoredumpStorageInfo *info) {
  *info = (sMfltCoredumpStorageInfo) {
    .size = /* size of coredump storage area */,
  };
}

bool memfault_platform_coredump_storage_read(uint32_t offset, void *data,
                                             size_t read_len) {
}

bool memfault_platform_coredump_storage_erase(uint32_t offset, size_t erase_size) {
}

bool memfault_platform_coredump_storage_write(uint32_t offset, const void *data,
                                              size_t data_len) {
}

void memfault_platform_coredump_storage_clear(void) {
}
RTOS Port Files
The Memfault SDK includes pre-canned integrations for RTOS environments. Expand the tab for the one applies to your system below in order to pick them up.
FreeRTOS Specific Sources
Add FreeRTOS-Specific Sources
  ${MEMFAULT_SDK_ROOT}/ports/freertos/src/memfault_core_freertos.c
  ${MEMFAULT_SDK_ROOT}/ports/freertos/src/memfault_freertos_ram_regions.c
  ${MEMFAULT_SDK_ROOT}/ports/freertos/src/memfault_metrics_freertos.c
  ${MEMFAULT_SDK_ROOT}/ports/freertos/src/memfault_panics_freertos.c
  ${MEMFAULT_SDK_ROOT}/ports/freertos/src/memfault_sdk_metrics_freertos.c
  ${MEMFAULT_SDK_ROOT}/ports/freertos/src/memfault_sdk_metrics_thread.c
  ${MEMFAULT_SDK_ROOT}/ports/freertos/src/memfault_self_test_platform.c
Add FreeRTOS-Specific Include Path
${MEMFAULT_SDK_ROOT}/ports/freertos/config
Include FreeRTOS Metric Definitions in Platform Heartbeat Config
In your memfault_port/memfault_metrics_heartbeat_config.def:
#include "memfault_metrics_heartbeat_freertos_config.def"

// ...
Remove Extra Function Definitions
-
Remove the definition for
memfault_platform_metrics_timer_boot()in yourmemfault_platform_port.c. This is implemented by the FreeRTOS port in the SDK -
Remove the definition for
vApplicationStackOverflowHook()in your application if it is defined. The Memfault FreeRTOS port provides a definition for this function to register a stack overflow reboot reason and reboot the system
Register Memfault Task Tracing in FreeRTOSConfig.h
#pragma once

#include "memfault/ports/freertos_trace.h"
While in the file, we recommend using the following settings to catch issues:
#define configCHECK_FOR_STACK_OVERFLOW 2
void vAssertCalled(const char *file, int line);
#define configASSERT(x) if ((x) == 0) vAssertCalled( __FILE__, __LINE__ )
Capture the Required FreeRTOS Variables for Thread Decode
Follow the instructions on the RTOS Analysis page to capture the necessary RTOS variables for thread decode in coredumps.
Initialize FreeRTOS Port on Boot
#include "memfault/components.h"
+ #include "memfault/ports/freertos.h"

//...

int memfault_platform_boot(void) {
+ memfault_freertos_port_boot();
+
  memfault_build_info_dump();
Optional: Configure FreeRTOS Task Capture Size
If the platform is configured to not capture all of RAM (due to storage or bandwidth limitations), it's still possible to capture the active FreeRTOS tasks as part of a coredump. See this file for details on that implementation.
With that in place, the Memfault SDK will selectively capture the running tasks during a coredump by saving both the Task Control Block (TCB) structure as well as a limited backtrace for each task.
By default, as of Under some configurations, the TCB structures consume significant amounts of
coredump space (300-1000 bytes per TCB). To mitigate this problem, as of the
Memfault Firmware SDK v0.37.1, a configuration option
The unused If the default capture size is too small, it can be adjusted using the
0.39.0, the Memfault SDK will capture a truncated copy of
each TCB, which saves space in the coredump. See below for more details on this.TCB structure capture size
MEMFAULT_PLATFORM_FREERTOS_TCB_SIZE
is available for fine-tuning the captured FreeRTOS TCB size. This can usually be
set to 100 bytes, but please confirm for your system by examining the full size
of the TCB_t data structure; for example, using the pahole tool as shown
below. Memfault requires the struct members through pcTaskName to decode the
task.xNewLib_reent member below is 240 bytes out of the total 352 byte
struct size.MEMFAULT_PLATFORM_FREERTOS_TCB_SIZE config value in
memfault_platform_config.h.
Register Assert Handler
- Memfault SDK 1.4.1+
- Memfault SDK <1.4.1
Memfault Firmware SDK v1.4.1 automatically hooks into the C library assert handlers:
__assert_func(Newlib C library)__aeabi_assert(IAR and ARM C libraries)
If you are using a different C library, you will need to hook into the assert handler, see the tab for "Memfault SDK <1.4.1" for more details.
Memfault can automatically capture crash information on asserts by calling
MEMFAULT_ASSERT() from your platforms assert handler:
#include "memfault/panics/assert.h"

#define YOUR_PLATFORM_ASSERT(x) MEMFAULT_ASSERT(x)
Newlib C library assert.h
If your platform is using the assert() or abort() calls directly from a libc
implementation, you should override the implementations to call
MEMFAULT_ASSERT.
To accomplish this with Newlib C library (bundled as the default with most compilers), we recommend adding the following to a C File in your project:
//! @file assert_overrides.c

#include <assert.h>
#include <stdlib.h>

void __assert_func(const char *file, int line,
                   const char *func, const char *failedexpr) {
   MEMFAULT_ASSERT(0);
}

void _exit(int status) {
   MEMFAULT_ASSERT(0);
}
Memfault advises against calling assert() directly from a project.
Instead, we suggest using the MEMFAULT_ASSERT(x) macro provided by the
Memfault SDK. Benefits include:
- making it easier to swap out behavior for different environments such as compile code for a unit test versus a real target.
- leading to substantial code space savings by enabling the removal of assert
conditions passed via the
failedexprarg.
Add a Unique Identifier to target
Memfault has facilities for capturing a unique identifier automatically as part of the build process. This information is used by Memfault's cloud infrastructure to ensure the symbol file uploaded matches the data reported in a coredump.
A longer discussion about firmware versioning best practices and build identifiers can be found here.
Memfault has two ways to add a Build ID to a target. Select the appropriate one below based on your toolchain setup.
- GNU Build Id Linker Flag + Snippet
- Memfault Build Id Python Script
Requires use of the GNU GCC or Clang compiler.
- Add
-Wl,--build-id=sha1to flags passed to linker via GCC/Clang - Add
#define MEMFAULT_USE_GNU_BUILD_ID 1tothird_party/memfault/memfault_platform_config.h - Add the following snippet to your projects linker script (
.ldfile) where "<YOUR_FLASH_SECTION>" below will match the name of the MEMORY section that read-only data and text is placed in.
    .note.gnu.build-id :
    {
        __start_gnu_build_id_start = .;
        KEEP(*(.note.gnu.build-id))
    } > <YOUR_FLASH_SECTION>
Be sure to update <YOUR_FLASH_SECTION> to match the name of the section
.text is placed in!
The .note.gnu.build-id output section name is used to locate the Build ID when
the symbol file is uploaded. The __start_gnu_build_id_start identifier is used
at compile time by the SDK for populating the Build ID.
See the FreeRTOS example app in the Memfault SDK for a reference implementation!
Update your build system to invoke the scripts/fw_build_id.py script on your
ELF as part of a post-build step.
For example, using CMake, this can be achieved by adding a custom command to the target:
add_custom_command(TARGET ${YOUR_EXECUTABLE_NAME} POST_BUILD
  COMMAND python ${MEMFAULT_SDK_ROOT}/scripts/fw_build_id.py ${YOUR_EXECUTABLE_NAME}
)
The script depends on pyelftools so make sure you have run
pip install pyelftools or added it to your requirements.txt
See the ESP32 example app in the Memfault SDK for a reference implementation!
For projects using IAR EWARM, see the instructions below for adding a post-build
action: Install Python (eg python3.9 from the Microsoft app store) Install the Then add the appropriate post-build action, for example: The Output Converter utility runs before the post-build actions, so it will
always generate output with a missing Build Id. Instead, invoke Additionally, Build Actions in IAR EWARM are batched, so to ensure Memfault
Build Id insertion and binary output conversion execute in the proper order,
invoke a separate script wrapping calls to Details
pyelftools Python package by:
python3.9.exe -m pip install pyelftools==0.27ielftool
after Memfault Build Id insertion to ensure the binary has a Build Id. Refer
to the
IAR EWARM Manual (PDF warning)
for more information on using ielftool.fw_build_id.py and ielftool.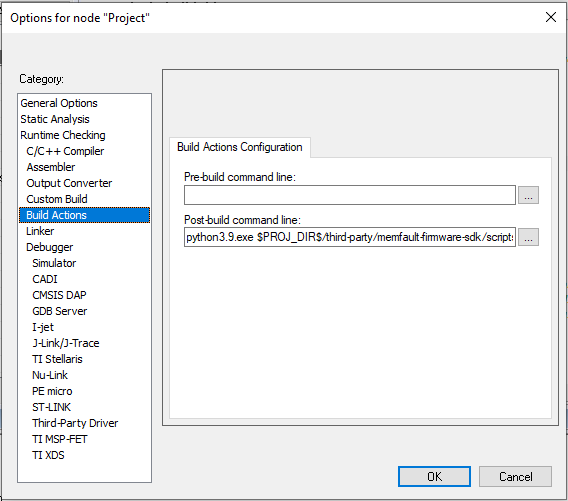
Confirm Integration Links
At this point, your project should compile and be able to boot. On startup you
should see some messaging like the following print when
memfault_platform_boot() is called:
[I] Memfault Build ID: cefaeb9407ab0dac7a5efe9fd510618ee21e9df7
[I] S/N: MFLT0123
[I] SW type: app-fw
[I] SW version: 1.0.0+cefaeb940
[I] HW version: dvt1
[I] Reset Reason, RESETREAS=0x4
[I] Reset Causes:
[I]  Software
[I] Memfault Initialized!
3. "Hello Memfault" Manually Upload Reboot Event
Add Test Commands to CLI
The Memfault SDK functionality can be easily exercised via CLI test commands.
If your platform does not have a CLI, these commands can also be wired up to a
button press or called from main() on bootup from a test image
Test platform ports
#include "memfault/components.h"

int test_logging(int argc, char *argv[]) {
  MEMFAULT_LOG_DEBUG("Debug log!");
  MEMFAULT_LOG_INFO("Info log!");
  MEMFAULT_LOG_WARN("Warning log!");
  MEMFAULT_LOG_ERROR("Error log!");
  return 0;
}
#include "memfault/components.h"

// Runs a sanity test to confirm coredump port is working as expected
int test_coredump_storage(int argc, char *argv[]) {

  // Note: Coredump saving runs from an ISR prior to reboot so should
  // be safe to call with interrupts disabled.
  your_platform_disable_interrupts();
  memfault_coredump_storage_debug_test_begin();
  your_platform_enable_interrupts();

  memfault_coredump_storage_debug_test_finish();
  return 0;
}
Test core SDK functionality
#include "memfault/components.h"

// Triggers an immediate heartbeat capture (instead of waiting for timer
// to expire)
int test_heartbeat(int argc, char *argv[]) {
  memfault_metrics_heartbeat_debug_trigger();
  return 0;
}

int test_trace(int argc, char *argv[]) {
  MEMFAULT_TRACE_EVENT_WITH_LOG(critical_error, "A test error trace!");
  return 0;
}

//! Trigger a user initiated reboot and confirm reason is persisted
int test_reboot(int argc, char *argv[]) {
  memfault_reboot_tracking_mark_reset_imminent(kMfltRebootReason_UserReset, NULL);
  memfault_platform_reboot();
}
Test different crash types where a coredump should be captured
#include "memfault/components.h"

int test_assert(int argc, char *argv[]) {
  MEMFAULT_ASSERT(0);
  return -1; // should never get here
}

int test_fault(void) {
  void (*bad_func)(void) = (void *)0xEEEEDEAD;
  bad_func();
  return -1; // should never get here
}

int test_hang(int argc, char *argv[]) {
  while (1) {}
  return -1; // should never get here
}

// Dump Memfault data collected to console
int test_export(int argc, char *argv[]) {
  memfault_data_export_dump_chunks();
  return 0;
}
Post Data to Cloud via Local Debug Setup
Prior to having an end-to-end transport in place, Memfault data can be exported over any serial connection or via GDB directly.
Post Chunks To Memfault
All data collected by Memfault can be exported as opaque packets called
"chunks". To trigger an export, call the test_export command added to your
device CLI.
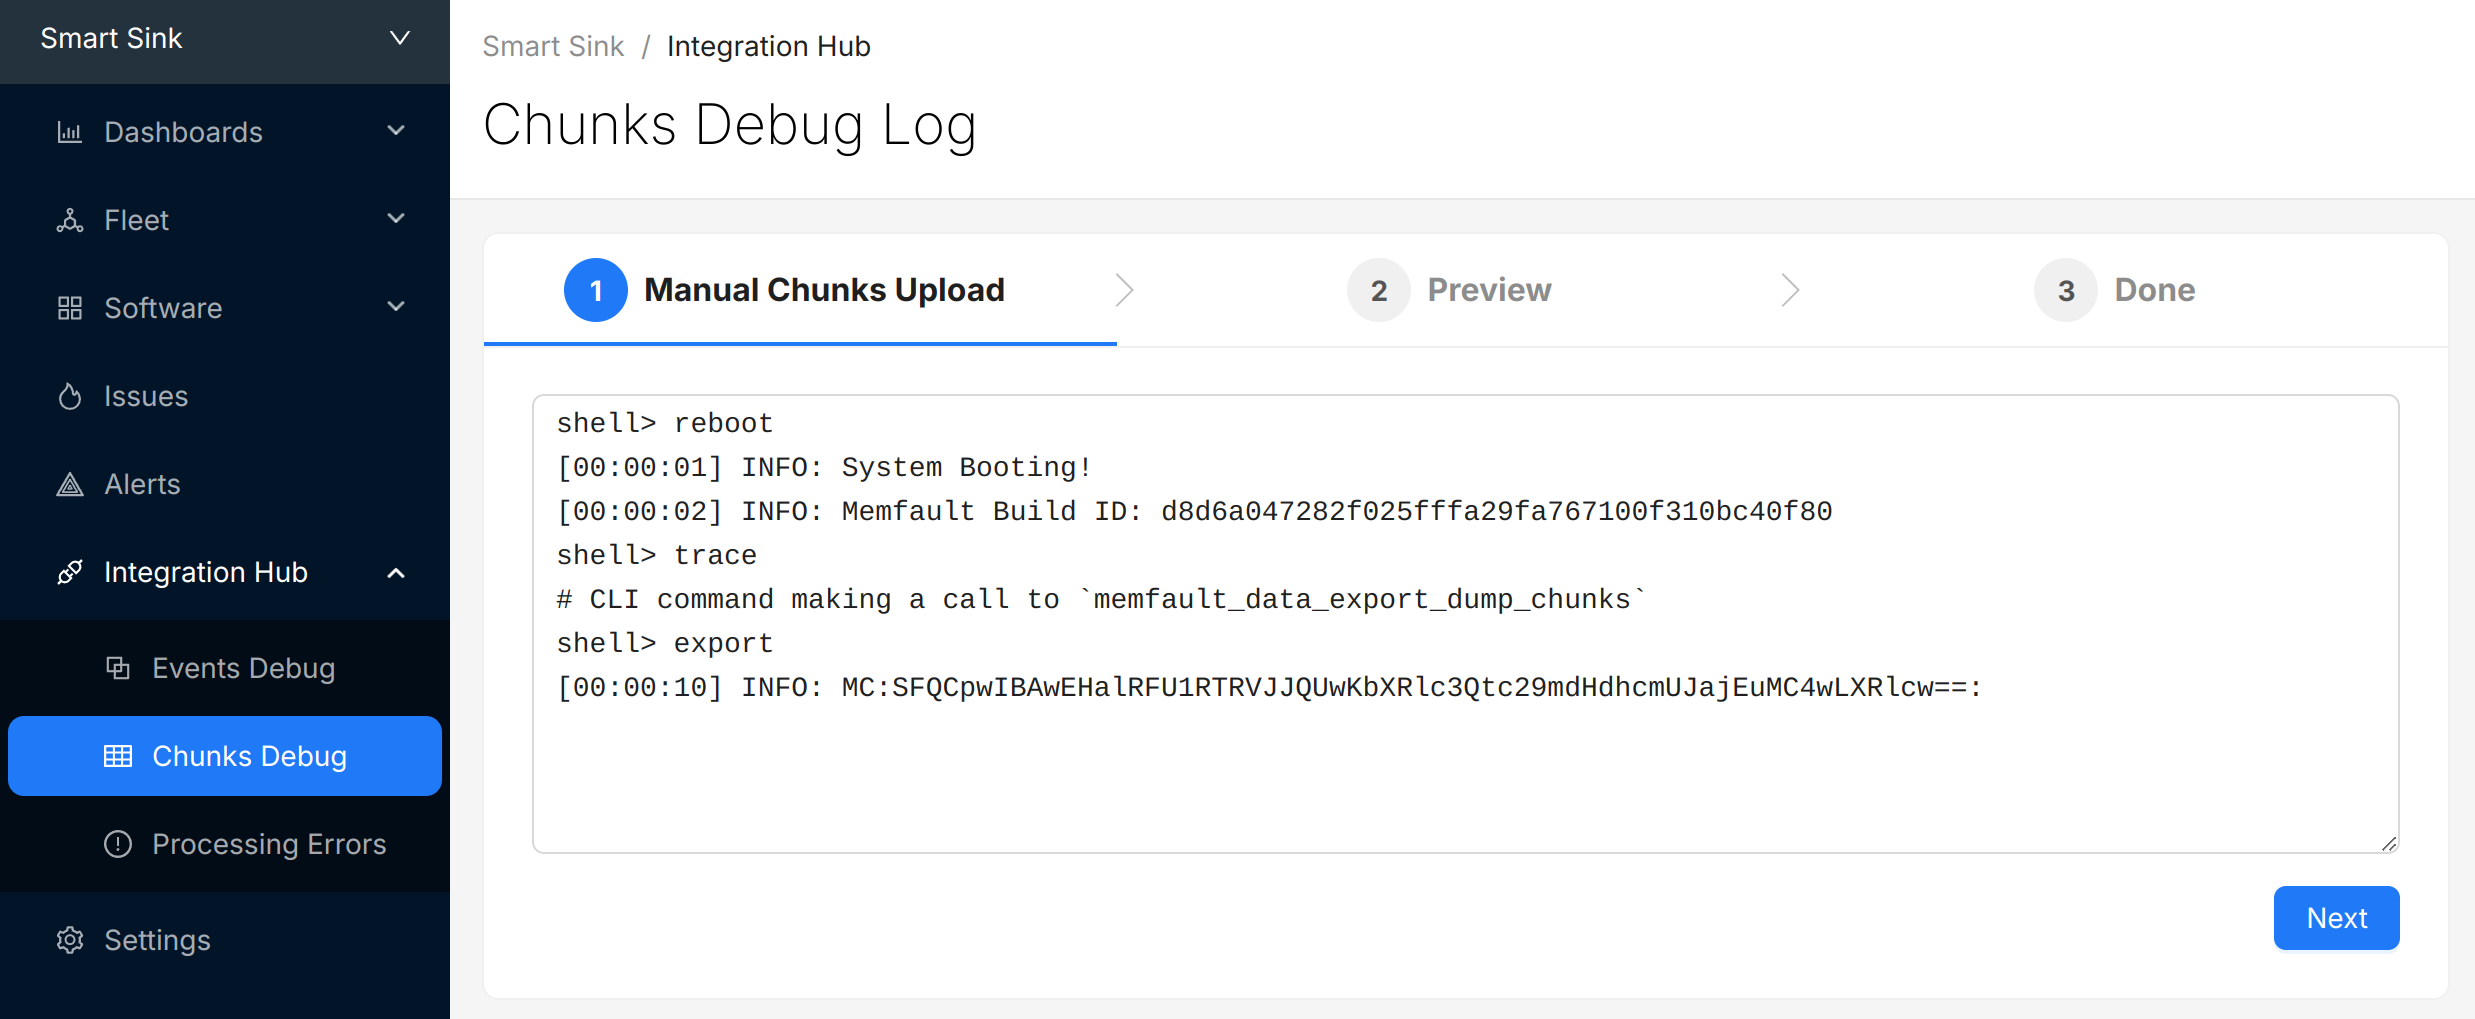
If data has been collected, you will see strings with the format:
MC:BASE64_ENCODED_CHUNK: in the dump.
It's perfectly fine for other logs to be interleaved with the exported data.
For example:
shell> reboot
[00:00:01] INFO: System Booting!
[00:00:02] INFO: Memfault Build ID: d8d6a047282f025fffa29fa767100f310bc40f80
shell> trace
# CLI command making a call to `memfault_data_export_dump_chunks`
shell> export
[00:00:10] INFO: MC:SFQCpwIBAwEHalRFU1RTRVJJQUwKbXRlc3Qtc29mdHdhcmUJajEuMC4wLXRlcw==:
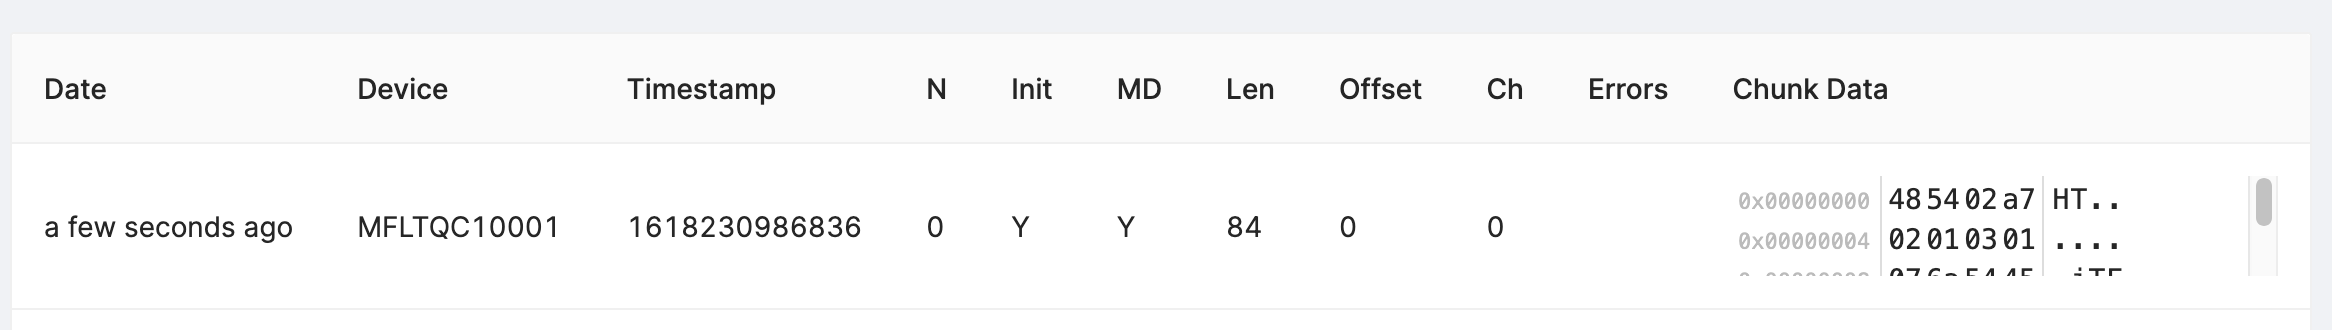
Copy the logs from the console, navigate to the "Integration Hub / Chunks Debug" view for your project, and paste the logs:
Select "Next" to review the chunks that were identified and (optionally) update the "Device Serial" being used to report data:
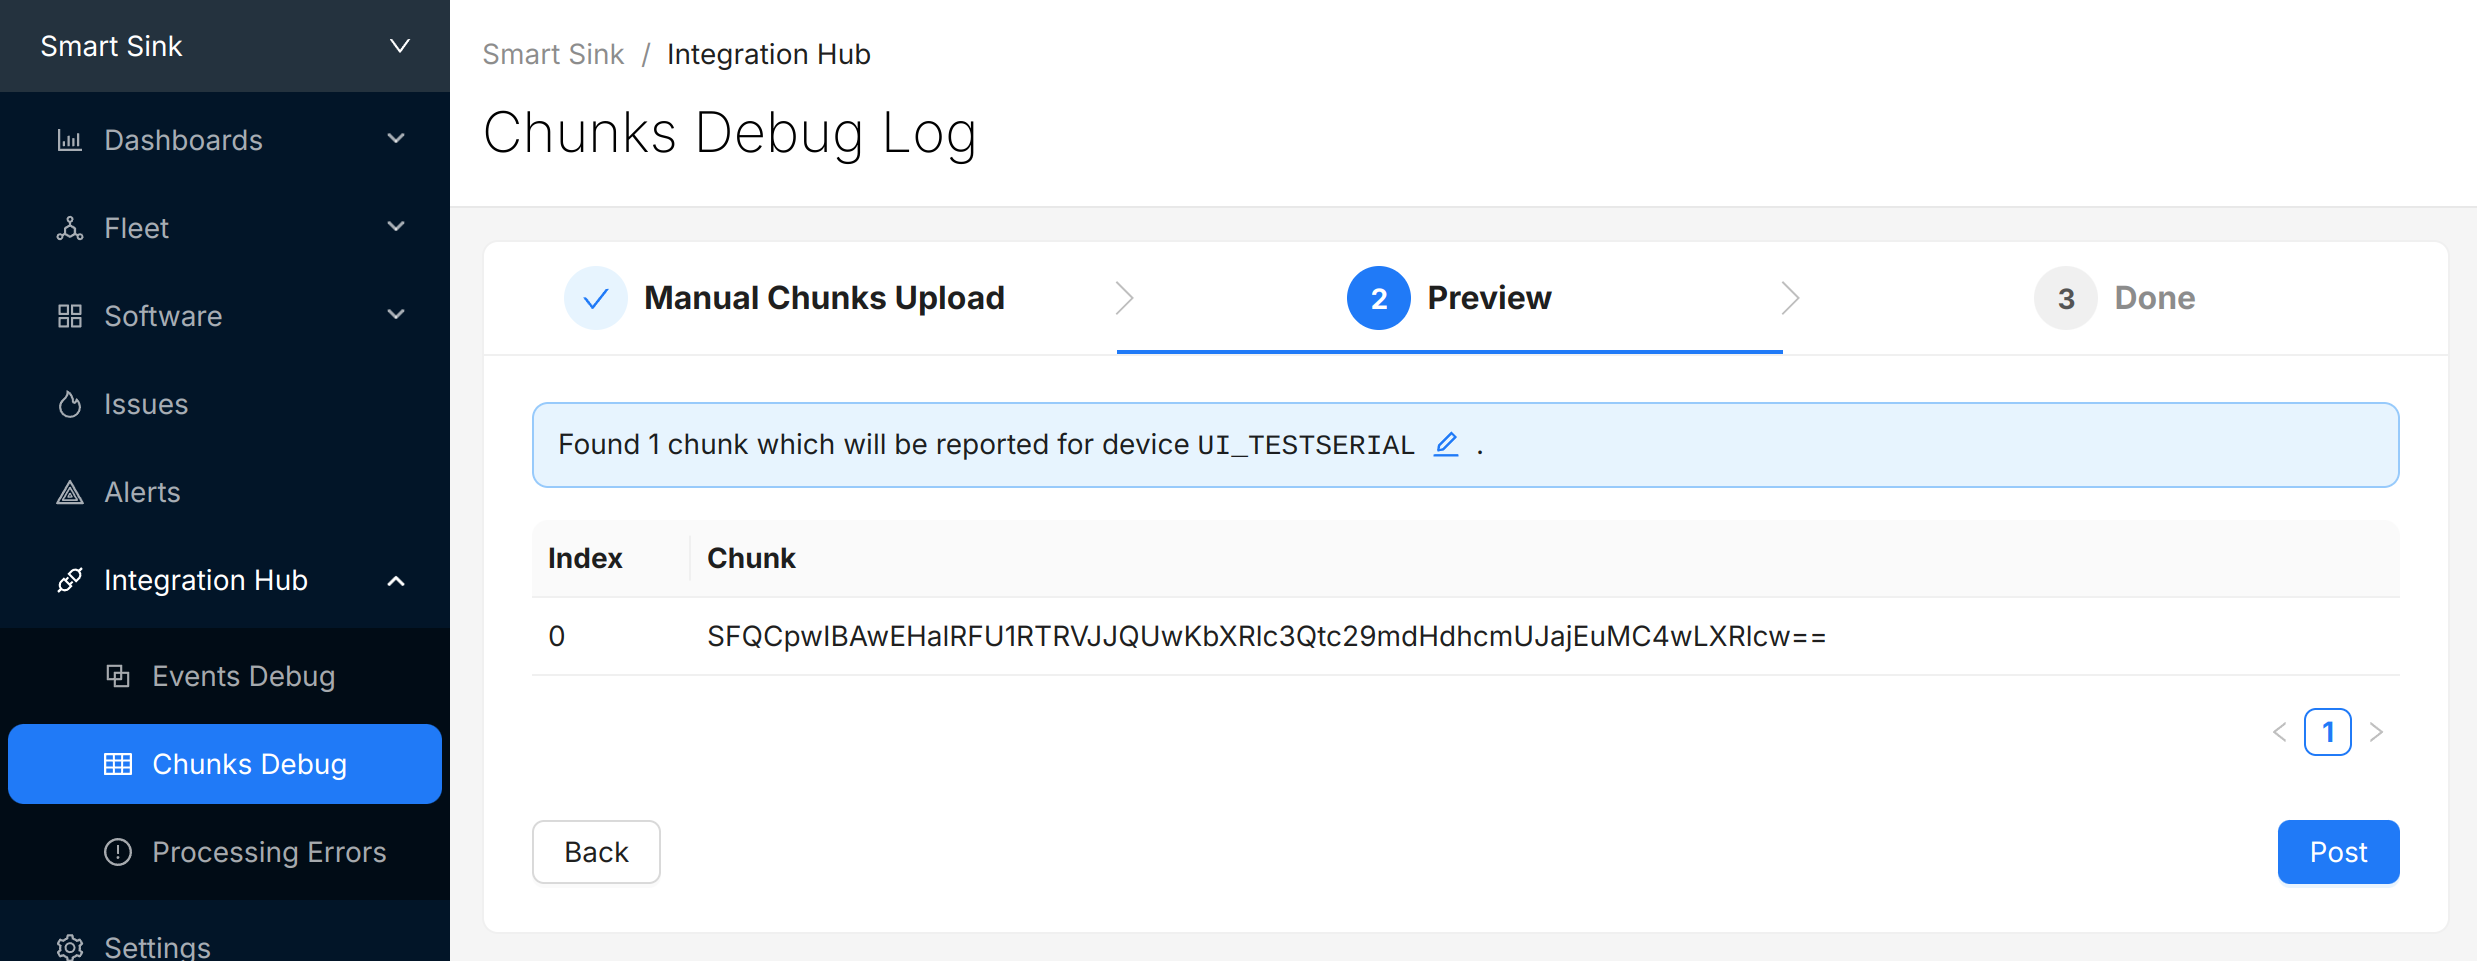
Select "Post" to submit the chunks to Memfault. The chunks will appear in the view directly below. Check and make sure there are no "Errors" to address.
(Optional) Automate Chunk Posting
Posting chunks from a local setup can be automated using our CLI tool or GDB script.
This strategy can also be used even when an end-to-end transport is in place for local QA testing or in CI/CD test automation setups.
Automated Posting Options
Prerequisite: Project Key from Memfault UI
A Project key will be needed in order to communicate with Memfault's web
services. Go to https://app.memfault.com/, navigate
to the project you want to use and select 'Settings'→'General'. The 'Project
Key' listed is what you will want to use. The Memfault Desktop CLI tool. tool is written
in Python and published publicly in the
Python Package Index (pypi). To install it, make sure you have a recent version of Python 3.x installed and
run: Start your console with your favorite terminal client. Let the system run for a
bit, periodically dumping data to the console by calling
You should see strings with the format: It's perfectly fine for other logs to be interleaved with the exported data. For example: Save the resulting logs to a file such as Run the desktop Memfault CLI tool on your saved log file. The utility will parse
the logs, extract the Memfault data, and post it for processing! Even if you are using other compilers such as ARMCC or IAR, you can load the ELF
(.out, .elf) generated and debug it in GDB as well. For example: Copy and paste and run the following in gdb: Some GDB versions do not support Python scripting by default. If you see a
message like "Python scripting is not supported in this copy of GDB", you might
be able to run an alternative GDB binary with a -py suffix, for example
arm-none-eabi-gdb-py. Copy the command below and paste it into GDB and hit enter. This will load a
handler which automatically posts data to Memfault whenever
Now, every time With Desktop CLI Tool
Install the Python Memfault CLI Tool
Save device logs to file
memfault_data_export_dump_chunks().MC:BASE64_ENCODED_CHUNK: in the dump.logs.txt.Post chunks from logs with Memfault CLI
With GDB
Prerequisites
-py version of GDB which has it
included.)-g
CFLAG)Launch GDB and connect debugger
Load Memfault GDB script
Register Handler
memfault_data_export_dump_chunks is called.memfault_data_export_dump_chunks() needs to be called by your port as part of
a CLI command or periodic task in order for the data to be extracted. For
example:Try It Out!
memfault_data_export_dump_chunks is called, the data passed as
a parameter to the function will automatically be posted to the Memfault cloud.
You don't have to do anything else! You will see logs print in the gdb CLI as
data is posted:
4. Manually Capture a Coredump
Upload Symbol File
At this point, you should be able to generate test events and crashes and push the data to the Memfault UI.
You can confirm the error traces and crashes have arrived successfully by navigating to the "Issues" page- there should be a new issue with the "Symbols Missing" label:
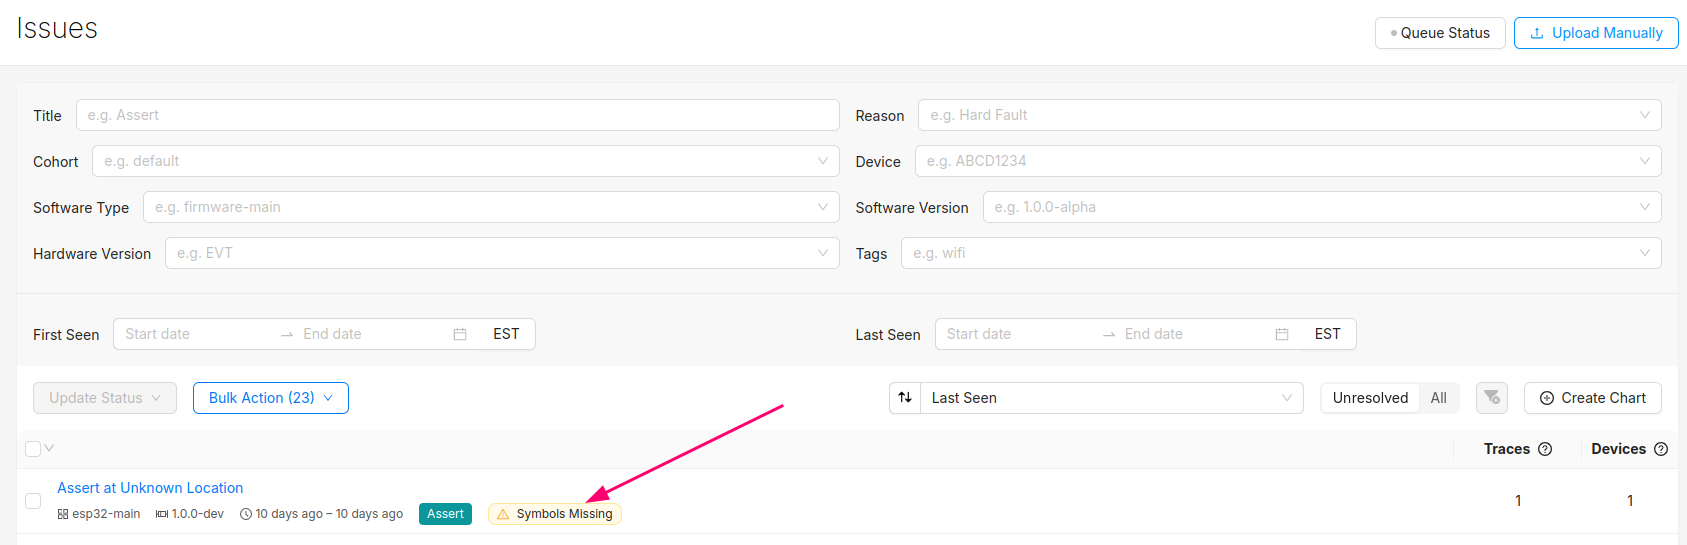
Clicking into the Issue will show the trace and a message that the symbol file is missing. It can be uploaded by clicking the button highlighted below:
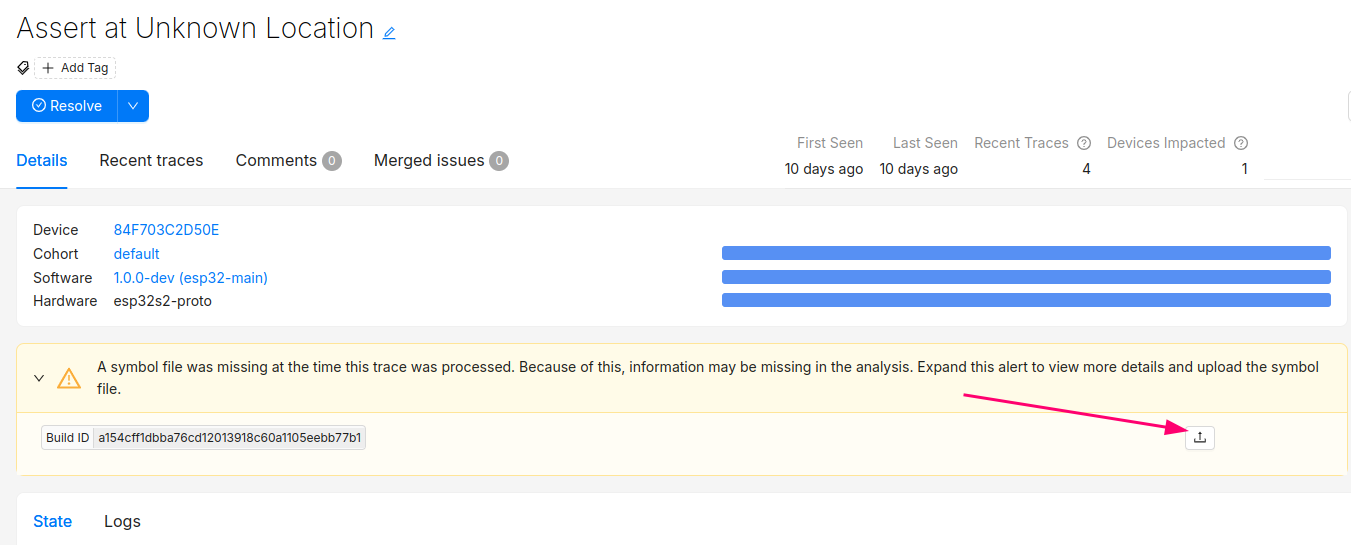
After this step, you will see the processed trace in the list of issues!
The Issue created when the symbol file is missing can now be set to resolved. It's good practice to always upload a symbol file before devices send any data.
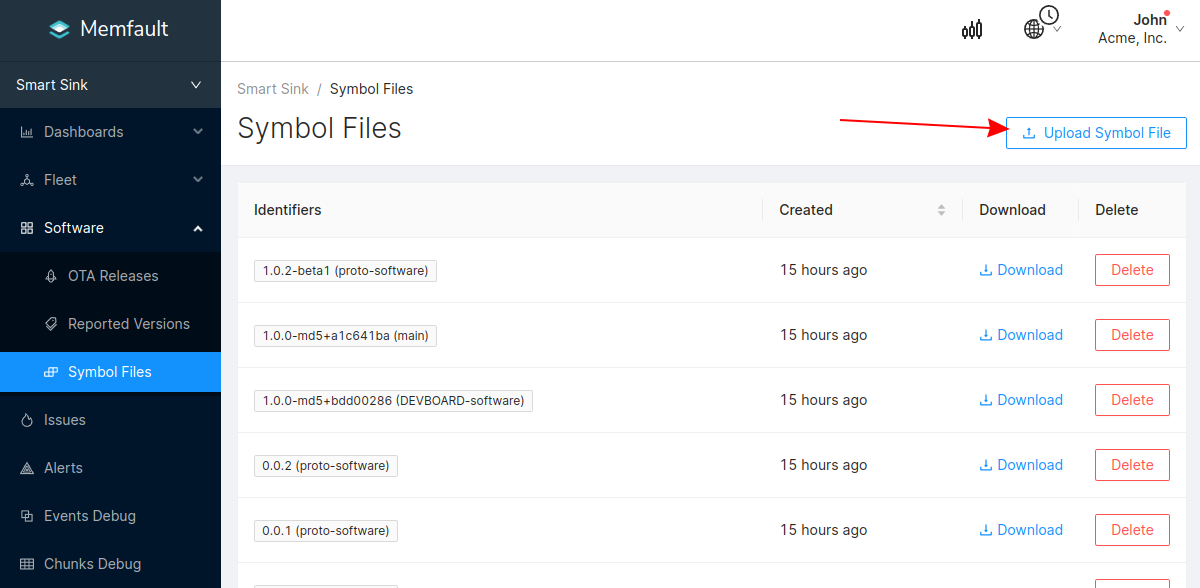
Symbol files can also be uploaded from the Software → Symbol Files tab (follow this deep link to be brought to the symbol file upload point in the UI):
In addition to supporting decoding trace/coredump data, symbol files are also required for decoding Metrics.
You can programmatically upload symbol files with the Memfault CLI tool.
Symbol files should be uploaded to Memfault before devices send any data, to ensure all device data can be decoded.
Check Exception Handler Implementations
Memfault provides exception handler implementations that need to be invoked via the system's vector table. The SDK by default provides implementations for these handlers using the CMSIS standard names:
- HardFault_Handler
- MemoryManagement_Handler
- BusFault_Handler
- UsageFault_Handler
- NMI_Handler
- MemfaultWatchdog_Handler
Typically the default implementations will be weakly defined, so the Memfault
implementations will automatically be used. It may be necessary to mark the
default implementation with the appropriate weak annotation, or delete the
default implementations altogether so the Memfault implementations can be used.
If the entries in the vector table for those handlers are named differently,
either change the names to match the CMSIS standard ones, or set the necessary
config options
in memfault_platform_config.h to override the names.
5. Manually Capture Logs
Logging Dependency
The Memfault SDK will (sparingly) emit diagnostic logs to alert of integration configuration problems. The logging subsystem can also easily serve as logging infrastructure for your own platform if you do not yet have one set up.
Based on your setup, choose one of the options below:
Platform does logging via Macros
- Add
#define MEMFAULT_PLATFORM_HAS_LOG_CONFIG 1tothird_party/memfault/memfault_platform_config.h - Remap Memfault logging macros to platform logging macros by adding the
following macros to the
memfault_platform_log_config.hfile created earlier.
//! @file memfault_platform_log_config.h
#pragma once

#define MEMFAULT_LOG_DEBUG(fmt, ...) YOUR_PLATFORM_DEBUG_LOG( fmt, ## __VA_ARGS__)
#define MEMFAULT_LOG_INFO(fmt, ...)  YOUR_PLATFORM_INFO_LOG(  fmt, ## __VA_ARGS__)
#define MEMFAULT_LOG_WARN(fmt, ...)  YOUR_PLATFORM_WARN_LOG( fmt, ## __VA_ARGS__)
#define MEMFAULT_LOG_ERROR(fmt, ...) YOUR_PLATFORM_ERROR_LOG( fmt, ## __VA_ARGS__)
Platform has no logging or uses printf()
Implement memfault_platform_log() in
third_party/memfault/memfault_platform_port.c. For example,
#include "memfault/components.h"

void memfault_platform_log(eMemfaultPlatformLogLevel level, const char *fmt, ...) {
  va_list args;
  va_start(args, fmt);

  char log_buf[128];
  vsnprintf(log_buf, sizeof(log_buf), fmt, args);

  const char *lvl_str;
  switch (level) {
    case kMemfaultPlatformLogLevel_Debug:
      lvl_str = "D";
      break;

    case kMemfaultPlatformLogLevel_Info:
      lvl_str = "I";
      break;

    case kMemfaultPlatformLogLevel_Warning:
      lvl_str = "W";
      break;

    case kMemfaultPlatformLogLevel_Error:
      lvl_str = "E";
      break;

    default:
      break;
  }

  vsnprintf(log_buf, sizeof(log_buf), fmt, args);

  your_platform_printf("[%s] MFLT: %s\n", lvl_str, log_buf);
}
If you are using the Memfault Demo CLI in your project, see the information on that page for other dependencies.
6. Configuring Standard Metrics
To process device data, Memfault requires a matching uploaded Symbol File. See "Upload Symbol File for details.
Timer Dependencies
The memfault metric subsystem requires a repeating timer in order to collect "heartbeats" and a time since boot
- nRF5 SDK
- FreeRTOS
- Other
Add the following file to your build system:
${MEMFAULT_SDK_ROOT}/ports/freertos/src/memfault_metrics_freertos.c
Add the following file to your build system:
${MEMFAULT_SDK_ROOT}/ports/nrf5_sdk/memfault_platform_metrics.c
Implement the following function for your MCU. The ports listed in other tabs serve as a good reference.
//! @file memfault_platform_port.c

bool memfault_platform_metrics_timer_boot(uint32_t period_sec, MemfaultPlatformTimerCallback callback) {
  // Schedule a timer to invoke callback() repeatedly after period_sec
  return true;
}

uint64_t memfault_platform_get_time_since_boot_ms(void) {
  // Return time since boot in ms, this is used for relative timings.
  return 0;
}
Configure Metrics
To process device data, Memfault requires a matching uploaded Symbol File. See "Upload Symbol File for details.
Define First Heartbeat
Heartbeat metrics allow you to easily monitor your platform and confirm it is operating as expected.
Typical Heartbeat Examples
- investigate problems that didn't cause a reboot (bad connectivity, network or sensor error rates) and marginality that crops up in a fleet
- providing leading indicators of problems (rapid battery drain, drop in activity, etc)
- compare trends across releases (improved connectivity, data efficiency etc)
Best Practices around each metric type that we recommend:
- Timers - These are used to track time spent in particular states and can be used for debugging connectivity, battery life, and performance issues.
- Counters - Track counts of a particular event class taking place. Suggested
use cases are:
- Operations your system are performing (number of events serviced by a task, bytes sent over network, bytes written to flash). Alerts can be configured to identify devices operating outside normal thresholds.
- Counts of events for events that should never happen (i2c bus write error count, flash write error). You can alert if any of these situations are seen.
- Gauges - These are values sampled at the end of each Heartbeat interval.
Common items include
- Battery Metrics (Drop over an hour, current percent)
- Heap utilization / stack high watermark
Add Metric to memfault_metrics_heartbeat_config.def
//! @file memfault_metrics_heartbeat_config.def
MEMFAULT_METRICS_KEY_DEFINE(MainTaskWakeups, kMemfaultMetricType_Unsigned)
Instrument Code to Update Heartbeat
void my_main_task(void) {
   while (1) {
      your_rtos_wait_for_event();
      MEMFAULT_METRIC_ADD(MainTaskWakeups, 1);
   }
}
7. Automatically Upload Data
Post Data to Cloud via Device Transport
Extensive details about how data from the Memfault SDK makes it to the cloud can be found here. In short, the Memfault SDK packetizes data into "chunks" that must be pushed to the Memfault cloud via the chunk REST endpoint.
The Memfault SDK exposes an API that packetizes Memfault data into "chunks". These "chunks" need to be forwarded to the Memfault Cloud (either directly via HTTPS or indirectly via a gateway device such as a computer or mobile application)
If you cannot post data directly using HTTP, no problem at all. In fact, that is one of the most common configurations. In these setups, data can be proxied from the MCU to a device which can perform a HTTP request over transports such as UART, BLE, COAP, LoRa, Zigbee, etc). The size of a "chunk" is fully configurable and can be tuned to best match your transport requirements. All message re-assembly is dealt with by Memfault in the cloud.
#include "memfault/components.h"

bool try_send_memfault_data(void) {
  // buffer to copy chunk data into
  uint8_t buf[USER_CHUNK_SIZE];
  size_t buf_len = sizeof(buf);

  bool data_available = memfault_packetizer_get_chunk(buf, &buf_len);
  if (!data_available ) {
    return false; // no more data to send
  }

  // send payload collected to chunks endpoint
  user_transport_send_chunk_data(buf, buf_len);
  return true;
}

void send_memfault_data(void) {
  if (!memfault_packetizer_data_available()) {
    return false; // no new data to send
  }

  // [... user specific logic deciding when & how much data to send
  while (try_send_memfault_data()) { }
}
Troubleshooting Data Transfer
See the docs on data transfer troubleshooting.
8. Next Steps
Now that the Memfault SDK is integrated on your device, there are many other features and options to explore. Check out these sections of our docs for more information: