Quickstart Espressif ESP32
The following assumes you already have a Memfault account. If you don't yet have an account, reach out to us!
This quickstart guide shows how to integrate and verify the Memfault SDK with Espressif ESP32 series SOCs, using the Espressif IoT Development Framework (ESP-IDF).
Set up the SDK
For the quickest integration, we recommend having a console and Wi-Fi connectivity available with your application. The steps that follow assume these are both present.
Check out either ESP-IDF Advanced Console Example or the example in our SDK for how to add these two components.
Add the Memfault Component
Add the Memfault ESP Component to your project using the IDF Component Manager:
idf.py add-dependency "memfault/memfault-firmware-sdk^1.12.0"
Required Kconfig Settings
Configure Memfault With the Memfault SDK added to your project, the next step is to add a few config entries to your app's sdkconfig.defaults (or equivalent name for your setup). Get the Project Key from the Memfault dashboard:
# Enable the ESP-IDF coredump component and save to Flash
CONFIG_ESP32_ENABLE_COREDUMP_TO_FLASH=y
# Set the Memfault Project Key
CONFIG_MEMFAULT_PROJECT_KEY="YOUR_PROJECT_KEY"
# Enable automatic periodic posting of Memfault data
CONFIG_MEMFAULT_HTTP_PERIODIC_UPLOAD=y
Add A Coredump Partition
Finally, we will allocate a partition to save any coredumps collected by
Memfault. Add the following to your application's partitions.csv or equivalent
partition table file:
coredump, data, coredump,, 64K,
Depending on your setup, this partition may need a different size or spot within your partition table. See ESP-IDF's Partition Table documentation for more info.
Update Your App
With Memfault added and configured with ESP-IDF, next add Memfault to your code:
#include "memfault/esp_port/core.h"
#include "memfault/components.h"

void app_main(void) {
  memfault_boot();
  memfault_device_info_dump();

  //...
}
Find a reference example here with the above steps completed:
Verify Your Application + Memfault
Before building, we'll reset our build state and set the target. The target should be one of esp32, esp32c3, esp32s3, etc.:
rm sdkconfig && idf.py set-target <your_esp32_target>
Next build the application:
idf.py build
Finally flash your device and connect to the console:
idf.py flash monitor
We should see the application print Memfault device info at boot. Here's an example:
I (694) mflt: Memfault Build ID: 4115098dbf8ea90c802ae21b2e757e033866bd1b
I (704) mflt: S/N: C4DEE25A6118
I (704) mflt: SW type: esp32-main
I (704) mflt: SW version: 1.0.0-dev
Memfault provides some default console commands. Check for their availability withhelp
esp32> help
assert  assert type
  Trigger an assert; optional arg of 1=assert(), 2=MEMFAULT_ASSERT(),
  3=ESP_ERROR_CHECK(-1)

crash  crash type
  Trigger a crash

esp_crash
  Trigger a timer isr crash

leak
  Allocate the specified number of bytes without freeing

test_log
  Writes test logs to log buffer

trigger_logs
  Trigger capture of current log buffer contents
...
Hello, Memfault!
With Memfault as part of our application, we can use the built-in console commands to test and collect data. Memfault enables tracking reboot events for your device right away.
Once your device is connected, use the post_chunks console command to send the
collected reboot event to Memfault:
esp32> post_chunks
I (25764) mflt: Result: 0
Investigate a Crash
Coredump collection is enabled out of the box. Before collecting a coredump, upload your symbol file, commonly an ELF file, to Memfault. If you followed our recommended setup, this file will be in a similar directory as shown here:
<project root>
├── build/
|   └── <project_name>.elf
├── CMakeLists.txt
├── main
│   └── main.c
├── partitions.csv
├── sdkconfig.defaults
└── third-party
    └── memfault-firmware-sdk  # we'll add the Memfault SDK here
Memfault uses the symbol file to process coredump, metrics, and other data sent
from your device. Upload the <project_name>.elf file to Memfault by navigating
to Software → Symbol Files, and clicking
the "Upload Symbol File" button.
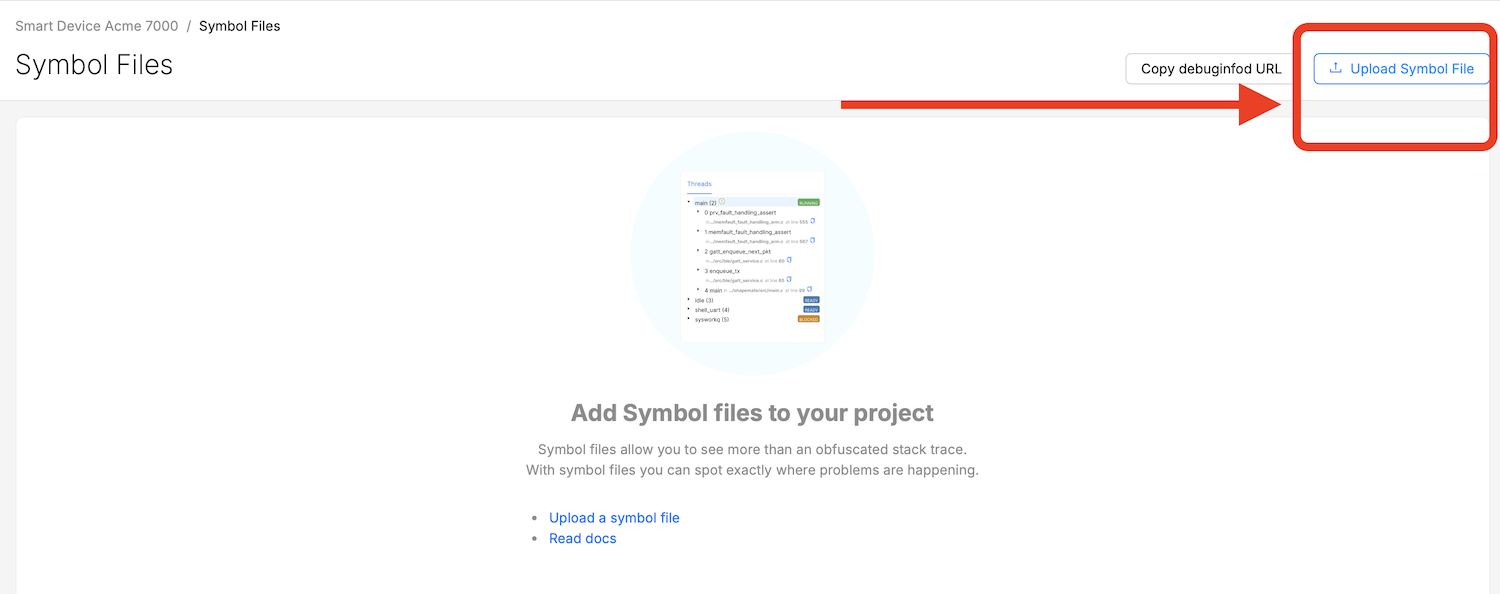
Screenshot of the Upload Symbol File button
Next, it's time to trigger a crash! In your console, run this command:
esp32> assert

assert failed: prv_esp32_assert_example memfault_platform_demo_cli_cmds.c:160 (0)


Backtrace: 0x4008224a:0x3ffbb7b0 0x40083c53:0x3ffbb7d0 0x4008b179:0x3ffbb7f0 0x40092d4d:0x3ffbb810 0x400d8ff1:0x3ffbb930 0x4010e391:0x3ffbb950 0x400d783e:0x3ffbb970 0x4018745f:0x3ffbb9a0 0x4008dffd:0x3ffbb9d0
0x4008224a: panic_abort at /Users/ericjohnson/work/src/memfault-esp-v5.0/esp-idf/components/esp_system/panic.c:452
0x40083c53: __wrap_panic_abort at /Users/ericjohnson/work/src/memfault-esp-v5.0/advanced/third_party/memfault/memfault-firmware-sdk/ports/esp_idf/memfault/common/memfault_fault_handler.c:67
0x4008b179: esp_system_abort at /Users/ericjohnson/work/src/memfault-esp-v5.0/esp-idf/components/esp_system/port/esp_system_chip.c:84
0x40092d4d: __assert_func at /Users/ericjohnson/work/src/memfault-esp-v5.0/esp-idf/components/newlib/assert.c:81
0x400d8ff1: prv_esp32_assert_example at /Users/ericjohnson/work/src/memfault-esp-v5.0/advanced/third_party/memfault/memfault-firmware-sdk/ports/esp_idf/memfault/common/memfault_platform_demo_cli_cmds.c:160
0x4010e391: esp_console_run at /Users/ericjohnson/work/src/memfault-esp-v5.0/esp-idf/components/console/commands.c:207
0x400d783e: app_main at /Users/ericjohnson/work/src/memfault-esp-v5.0/advanced/main/console_example_main.c:213
0x4018745f: main_task at /Users/ericjohnson/work/src/memfault-esp-v5.0/esp-idf/components/freertos/app_startup.c:208 (discriminator 13)
0x4008dffd: vPortTaskWrapper at /Users/ericjohnson/work/src/memfault-esp-v5.0/esp-idf/components/freertos/FreeRTOS-Kernel/portable/xtensa/port.c:162

ELF file SHA256: e4e49a6e7313cf76

SaRebooting...
Once the device reboots and connects to Wi-Fi, upload the data with
post_chunks.
Navigate to the Processing Log and confirm that a coredump was received. It can take up to 5 minutes for the coredump to appear:

Screenshot of the Processing Log showing a received coredump
In the sidebar, navigate to the Issues page and see the coredump once it processes:
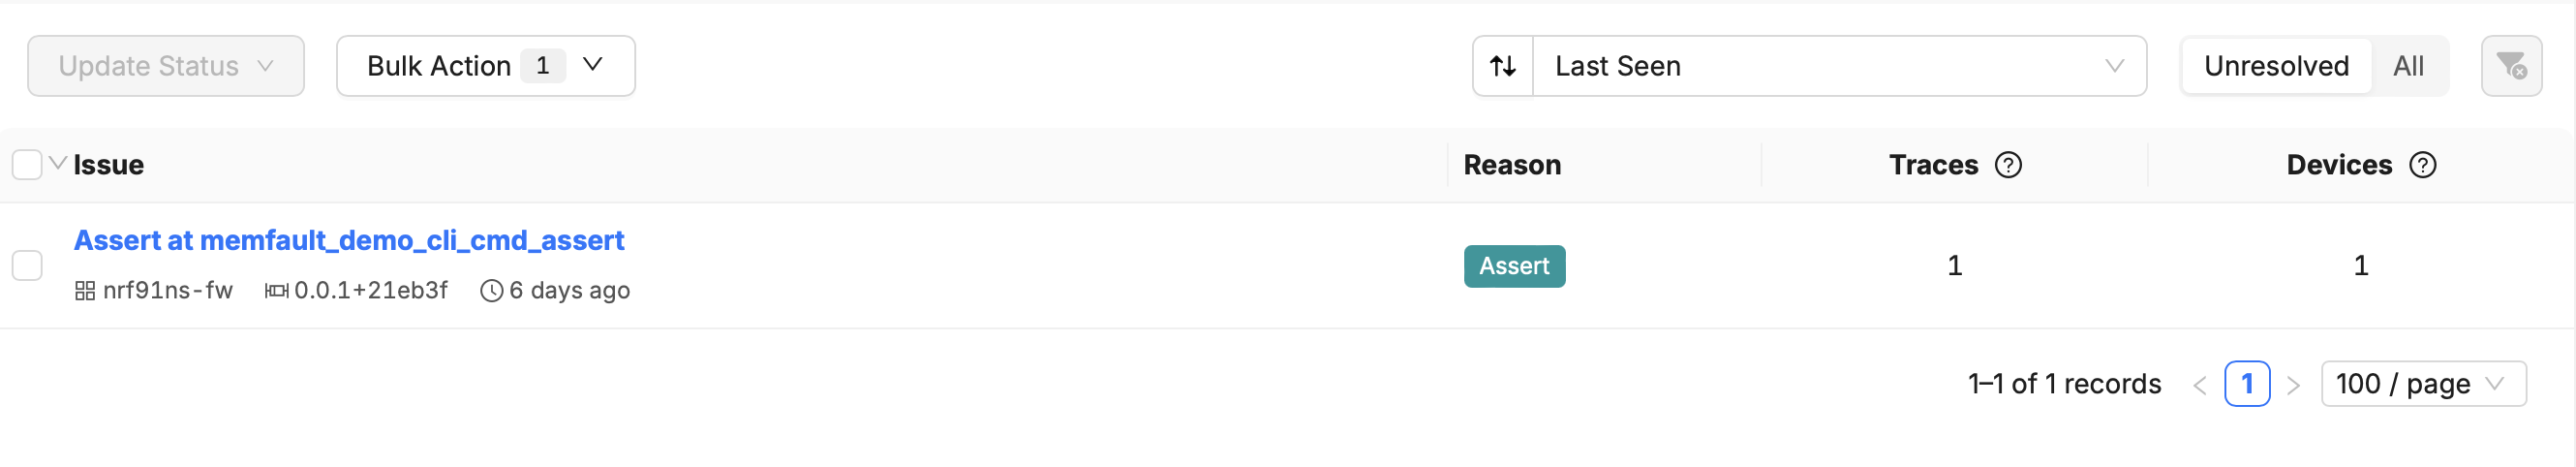
Screenshot of the Issue List
Click on its title to go through to the Trace view, and see details of the coredump:
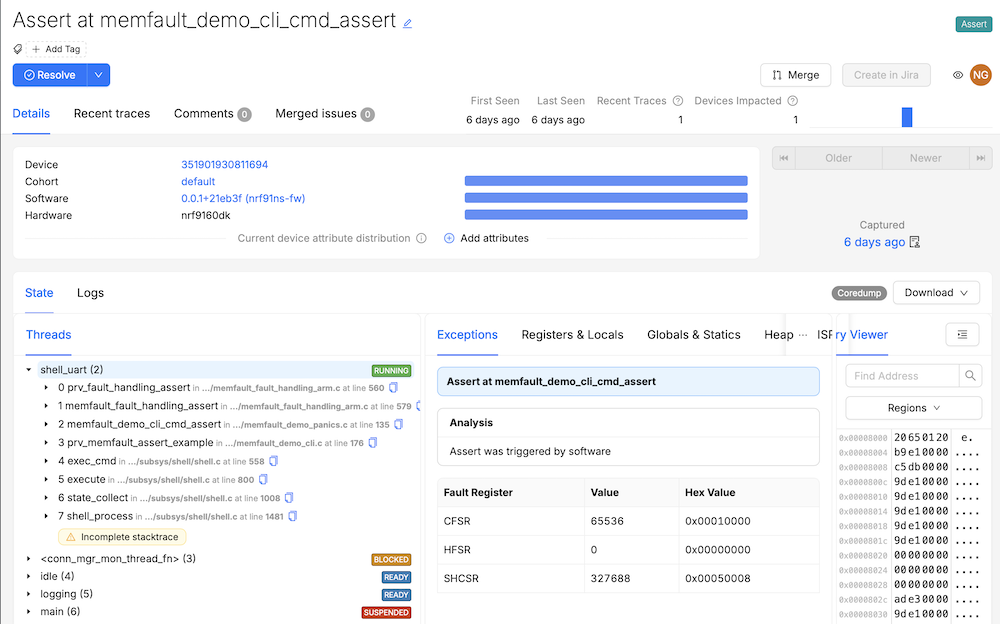
Screenshot of the Issue Detail view
Monitor the Fleet
Heartbeat Metrics are automatically collected by the Memfault SDK on an hourly
interval. See the current state of the device's Heartbeat metrics with the
heartbeat_dump command:
esp32> heartbeat_dump
I (554344) mflt: Metrics keys/values:
I (554344) mflt:   MemfaultSdkMetric_IntervalMs: 553642
I (554344) mflt:   MemfaultSdkMetric_UnexpectedRebootCount: 0
I (554354) mflt:   sync_successful: null
I (554354) mflt:   sync_failure: null
I (554354) mflt:   sync_memfault_successful: 1
I (554374) mflt:   sync_memfault_failure: null
I (554374) mflt:   connectivity_connected_time_ms: 521842
I (554374) mflt:   connectivity_expected_time_ms: 523388
I (554384) mflt:   operational_hours: null
I (554384) mflt:   operational_crashfree_hours: null
I (554394) mflt:   tcp_tx_count: null
I (554394) mflt:   tcp_rx_count: null
I (554394) mflt:   tcp_drop_count: null
I (554414) mflt:   udp_tx_count: null
I (554414) mflt:   udp_rx_count: null
I (554414) mflt:   udp_drop_count: null
I (554424) mflt:   idle0_task_run_time_percent: null
I (554424) mflt:   idle1_task_run_time_percent: null
I (554424) mflt:   timer_task_stack_free_bytes: null
I (554434) mflt:   mbedtls_mem_used_bytes: null
I (554444) mflt:   mbedtls_mem_max_bytes: null
I (554454) mflt:   heap_free_bytes: null
I (554454) mflt:   heap_largest_free_block_bytes: null
I (554454) mflt:   heap_allocated_blocks_count: null
I (554464) mflt:   heap_min_free_bytes: null
I (554464) mflt:   wifi_connected_time_ms: 521843
I (554474) mflt:   wifi_sta_min_rssi: null
I (554484) mflt:   wifi_disconnect_count: null
I (554484) mflt:   wifi_ap_oui: ""
Run the heartbeat command to trigger a Heartbeat, and then post_chunks
upload the data:
esp32> heartbeat
esp32> post_chunks
I (80084) mflt: Result: 0
Navigate to the Processing Log, and confirm the Heartbeat appears. This can take up to 5 minutes.

Screenshot of the Processing Log showing a received Heartbeat report
Click on the device, and click on the sample in the Timeline to confirm Heartbeat data was decoded.
Examine a Device
Make sure that all the data you've uploaded so far is appearing on your Device's details page.
Note: this step should be run after a Heartbeat is uploaded in "Monitor the Fleet".
-
Navigate to the Fleet → Devices page, and select the device reporting in to view its Device Timeline.
-
Click on the sample in the Timeline to inspect the uploaded Heartbeat record. It should look something like this:
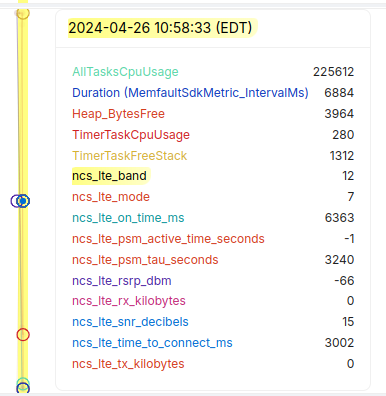
Screenshot of the device timeline
-
Click on the Traces tab to see the Trace you uploaded earlier:
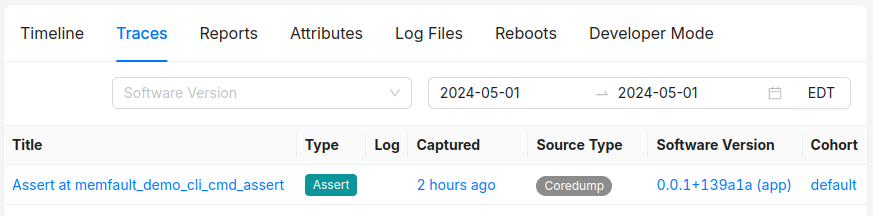
Screenshot of traces tab
-
Click on the Reboots tab to see the Reboot you uploaded earlier:
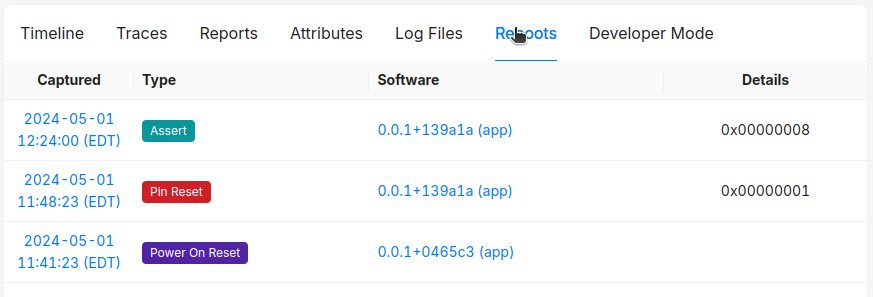
Screenshot of reboots tab
Testing OTA
Memfault recommends testing OTA as part of quickstart only if your device already has an OTA-ready partition table. Here's an example:
# Name,   Type, SubType, Offset,  Size,  Flags
nvs,      data, nvs,     0x9000,  0x4000,
otadata,  data, ota,      0xd000,  0x2000
phy_init, data, phy,     0xf000,  0x1000,
factory,  app,  factory, 0x10000, 1280K,
ota_0,    app,  ota_0,    ,         1280K,
ota_1,    app,  ota_1,    ,         1280K,
coredump, data, coredump,,        64K,
Use the memfault_ota_check command to check for any available updates:
esp32> memfault_ota_check
I (396844) mflt: Checking for OTA Update
I (397694) mflt: Up to date!
Navigate to the Processing Log and confirm the OTA check event was recorded:

A Processing Log entry for an OTA check
The Processing Log is a great place to start when testing any device operation that interacts with Memfault!
Now rebuild the firmware with a newer Software Version using these Kconfig settings:
CONFIG_MEMFAULT_DEVICE_INFO_SOFTWARE_VERSION="1.0.1-dev"
Be sure to remove the generated sdkconfig before building.
Navigate to the Software → OTA
Releases page, create a new Release named 1.0.1-dev,
and click "Add OTA Payload to Release" to upload the OTA Payload,
build/<your_app_name>.bin
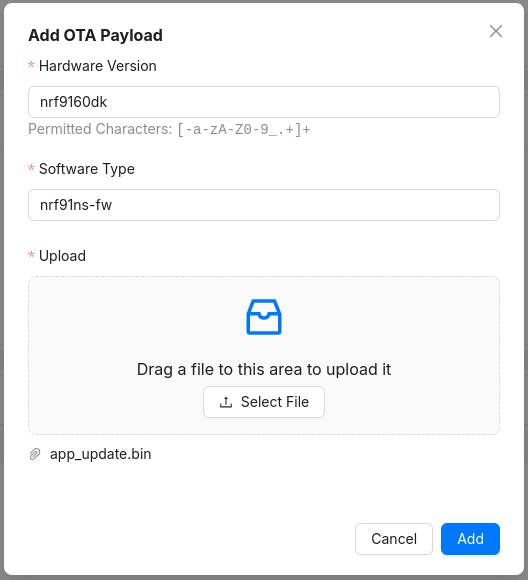
Adding an OTA Payload
Deploy the Release by going to the Fleet →
Cohorts page, clicking the (Edit pencile) icon in the
Release column, and activating the 1.0.1-dev Release we just created.
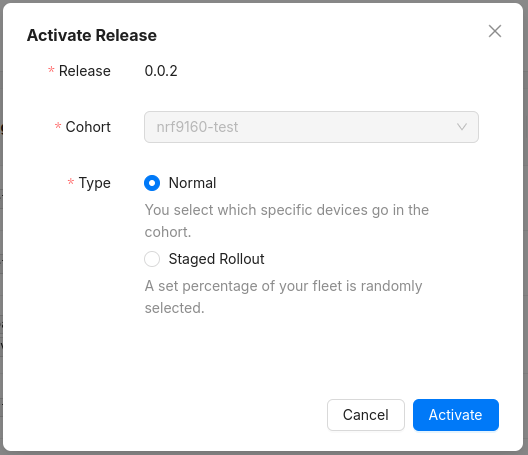
Activating an OTA Release
Use the memfault_ota_check command on the device to check that the OTA Release
is activated:
esp32> memfault_ota_check
I (409574) mflt: Checking for OTA Update
I (410424) mflt: Update available!
Use the memfault_ota_perform command to execute the OTA:
esp32> memfault_ota_perform
I (114044) mflt: Checking for OTA Update
I (114974) mflt: Starting OTA download ...
I (115894) esp_https_ota: Starting OTA...
I (115894) esp_https_ota: Writing to partition subtype 16 at offset 0x150000
I (153244) esp_image: segment 0: paddr=00150020 vaddr=3f400020 size=2d878h (186488) map
I (153314) esp_image: segment 1: paddr=0017d8a0 vaddr=3ff80063 size=00008h (     8)
I (153314) esp_image: segment 2: paddr=0017d8b0 vaddr=3ffb0000 size=02768h ( 10088)
I (153324) esp_image: segment 3: paddr=00180020 vaddr=400d0020 size=b9688h (759432) map
I (153564) esp_image: segment 4: paddr=002396b0 vaddr=3ffb2768 size=019b4h (  6580)
I (153574) esp_image: segment 5: paddr=0023b06c vaddr=40080000 size=18664h ( 99940)
I (153604) esp_image: segment 6: paddr=002536d8 vaddr=400c0000 size=00064h (   100)
I (153624) esp_image: segment 0: paddr=00150020 vaddr=3f400020 size=2d878h (186488) map
I (153684) esp_image: segment 1: paddr=0017d8a0 vaddr=3ff80063 size=00008h (     8)
I (153694) esp_image: segment 2: paddr=0017d8b0 vaddr=3ffb0000 size=02768h ( 10088)
I (153704) esp_image: segment 3: paddr=00180020 vaddr=400d0020 size=b9688h (759432) map
I (153944) esp_image: segment 4: paddr=002396b0 vaddr=3ffb2768 size=019b4h (  6580)
I (153944) esp_image: segment 5: paddr=0023b06c vaddr=40080000 size=18664h ( 99940)
I (153984) esp_image: segment 6: paddr=002536d8 vaddr=400c0000 size=00064h (   100)
I (154054) mflt: OTA Update Complete, Rebooting System
After the update downloads and installs, the device will reboot. From the console during boot up we can see the new version has been installed:
I (709) mflt: Memfault Build ID: 720dbcf8b00d76ddea4c28ccb7595d7da4c48e5f
I (719) mflt: S/N: C4DEE25A6118
I (719) mflt: SW type: esp32-main
I (719) mflt: SW version: 1.0.1-dev
I (729) mflt: HW version: esp32-proto