DA1469x SDK Integration Guide
Overview
In this guide we will walk through the steps for integrating the Memfault Firmware SDK into a project using Dialog's DA1469x product family. The integration has been tested against the "DA1469x SDK10.0.10.118" release.
Upon completion of the integration, the following subcomponents will be added to your system!
Integration Steps
This tutorial assumes you have a working DA1469x environment and are able to flash a board supported by the SDK.
Create a Project and get a Project Key
Go to app.memfault.com and from the "Select A Project" dropdown, click on "Create Project" to setup your first project. Choose a name that reflects your product, such as "smart-sink-dev".
Once you've created your project, you'll be automatically taken to an page that includes your project key. Copy the key and follow the rest of this guide.
Clone memfault-firmware-sdk into middleware
cd ${DA1469X_SDK_ROOT}/sdk/middleware
mkdir -p memfault
cd memfault
git clone https://github.com/memfault/memfault-firmware-sdk.git
Apply patches to DA1469x SDK
There are a few small patches that need to be applied to the Dialog SDK.
cd ${DA1469X_SDK_ROOT}
patch -p1 < ./sdk/middleware/memfault/memfault-firmware-sdk/ports/dialog/da1469x/gnu-build-id.patch
patch -p1 < ./sdk/middleware/memfault/memfault-firmware-sdk/ports/dialog/da1469x/freertos-config.patch
patch -p1 < ./sdk/middleware/memfault/memfault-firmware-sdk/ports/dialog/da1469x/fault-handlers.patch
When running the patch command in Windows environments you may see warning
messages like the following which can be safely ignored:
(Stripping trailing CRs from patch; use --binary to disable.)
patch unexpectedly ends in middle of line
Create Memfault configuration files
You will need to create Memfault configuration files. These will be used later to customize the Memfault SDK.
# Navigate to same directory with other configs, i.e custom_config_qspi.h
cd ${YOUR_PROJECT_ROOT}/config/
touch memfault_platform_config.h
touch memfault_trace_reason_user_config.def
touch memfault_metrics_heartbeat_config.def
Add memfault-firmware-sdk to build
The memfault-firmware-sdk includes a script for easily adding all sources, includes, and necessary compiler flags to a project.
python ./sdk/middleware/memfault/memfault-firmware-sdk/scripts/eclipse_patch.py -p ${YOUR_PROJECT_ROOT} -m sdk/middleware/memfault/memfault-firmware-sdk --target-port dialog/da1469x
After running the script, be sure to right click on the project in SmartSnippets Studio and select "Refresh" to pick up the changes.
Update Dialog custom_config setup
Navigate to the custom config you are using for your project (i.e "custom_config_qspi.h") and update the following settings
//! @file custom_config_*.h
#define dg_configUSE_MEMFAULT                   (1)
#define dg_configDISABLE_BACKGROUND_FLASH_OPS   (1)
#define dg_configRETAINED_UNINIT_SECTION_SIZE   (192)

// Note: configTIMER_TASK_STACK_DEPTH must be >= 256.
// TODO: Check if you already have a definition in your project.
// Otherwise, add the line below
#define configTIMER_TASK_STACK_DEPTH 256

// Optional: To make use of Dialog debug console logging add:
#define CONFIG_RETARGET  (1)
Update Memfault Platform Config
#pragma once
//! @file memfault_platform_config.h

#define MEMFAULT_PLATFORM_COREDUMP_STORAGE_USE_FLASH    1

// Note: The default location coredumps are saved is NVMS log storage.
// This size can be adjusted depending on the amount of RAM regions collected
// in memfault_platform_coredump_get_regions()
#define MEMFAULT_PLATFORM_COREDUMP_STORAGE_MAX_SIZE_BYTES (32 * 1024)

#define MEMFAULT_USE_GNU_BUILD_ID 1

// TODO: Navigate to "Project" → "Settings" in the Memfault cloud UI (https://app.memfault.com/)
// and copy the "Project Key" here!
#define MEMFAULT_PROJECT_KEY ""
Implement memfault_platform_get_device_info
Implement the following function in your project. When an issue or metric is captured, this is the metadata that Memfault will collect alongside it and display in the UI.
#include "memfault/components.h"

void memfault_platform_get_device_info(sMemfaultDeviceInfo *info) {
  // !FIXME: Populate with platform device information

  // IMPORTANT: All strings returned in info must be constant
  // or static as they will be used _after_ the function returns

  // See https://mflt.io/version-nomenclature for more context
  *info = (sMemfaultDeviceInfo) {
    // An ID that uniquely identifies the device in your fleet
    // (i.e serial number, mac addr, chip id, etc)
    // Regular expression defining valid device serials: ^[-a-zA-Z0-9_]+$
    .device_serial = "DEMOSERIAL",
     // A name to represent the firmware running on the MCU.
    // (i.e "ble-fw", "main-fw", or a codename for your project)
    .software_type = "app-fw",
    // The version of the "software_type" currently running.
    .software_version = "1.0.0",
    // The revision of hardware for the device. This value must remain
    // the same for a unique device.
    // (i.e evt, dvt, pvt, or rev1, rev2, etc)
    // Regular expression defining valid Hardware Versions: ^[-a-zA-Z0-9_\.\+]+$
    .hardware_version = "dvt1",
  };
}
Initialize Memfault
On bootup, make a call to memfault_platform_boot() to start the Memfault
subsystem. We recommend doing this from system_init()
#include "memfault/components.h"

static void system_init( void *pvParameters )
{
// ...
#if defined CONFIG_RETARGET
        retarget_init();
#endif
        // Note: initialize Memfault after retarget_init() so logs will be displayed
        memfault_platform_boot();
// ...
}
Confirm Project builds
If your project is based on a template from the Dialog SDK, you also need to
remove the vApplicationStackOverflowHook implementation. The Memfault SDK
implements this function and will automatically capture a coredump with full
stack traces when a stack overflow takes place.
At this point, your project should compile and be able to boot. On startup, if
you have logging enabled, you should see some messages like the following print
when memfault_platform_boot() is called:
[I] MFLT: GNU Build ID: 6e6843f5f7410e0a51a0e62ce991fdd0d519eca7
[I] MFLT: S/N: DEMOSERIAL
[I] MFLT: SW type: da1469x-demo-app
[I] MFLT: SW version: 1.0.0
[I] MFLT: HW version: DA14695
Data Transport
With data collection in place, the final step is to push data to the Memfault cloud for analysis.
Extensive details about how data from the Memfault SDK makes it to the cloud can be found here. In short, all data is published via the same "chunk" REST endpoint.
When sending data over Bluetooth Low Energy, the Memfault Diagnostic GATT Service (MDS) can be used.
Initialize Memfault Diagnostic GATT Service
For the DA1469x, a port for the MDS is provided with the memfault-firmware-sdk.
To add the service to your project, simply add a call to mds_boot() from the
area of your code which is responsible for registering GATT services, i.e
#include "memfault/ports/ble/mds.h"

void your_ble_task(void) {
   ble_peripheral_start();
   // ...
   mds_boot();
}
Verification & Tuning Steps
With Memfault compiling into your build and a Bluetooth Low Energy transport set up, it's now time to add some initial instrumentation, and test the integration!
Define First Trace Event
Trace events are used for generating alerts in the Memfault UI when unexpected events are encountered. Let's start by creating a generic type for critical errors that have been detected.
--- a/config/memfault_trace_reason_user_config.def
+++ b/config/memfault_trace_reason_user_config.def
@@ -0,0 +1 @@
+MEMFAULT_TRACE_REASON_DEFINE(critical_error)
Define First Heartbeat Metric
Heartbeat metrics allow you to easily monitor your platform and confirm it is operating as expected.
Typical Heartbeat Examples
- investigate problems that didn't cause a reboot (bad connectivity, network or sensor error rates) and marginality that crops up in a fleet
- providing leading indicators of problems (rapid battery drain, drop in activity, etc)
- compare trends across releases (improved connectivity, data efficiency etc)
Best Practices around each metric type that we recommend:
- Timers - These are used to track time spent in particular states and can be used for debugging connectivity, battery life, and performance issues.
- Counters - Track counts of a particular event class taking place. Suggested
use cases are:
- Operations your system are performing (number of events serviced by a task, bytes sent over network, bytes written to flash). Alerts can be configured to identify devices operating outside normal thresholds.
- Counts of events for events that should never happen (i2c bus write error count, flash write error). You can alert if any of these situations are seen.
- Gauges - These are values sampled at the end of each Heartbeat interval.
Common items include
- Battery Metrics (Drop over an hour, current percent)
- Heap utilization / stack high watermark
Add Metric to memfault_metrics_heartbeat_config.def
//! @file memfault_metrics_heartbeat_config.def
MEMFAULT_METRICS_KEY_DEFINE(MainTaskWakeups, kMemfaultMetricType_Unsigned)
Instrument Code to Update Heartbeat
void my_main_task(void) {
   while (1) {
      your_rtos_wait_for_event();
      MEMFAULT_METRIC_ADD(MainTaskWakeups, 1);
   }
}
Add Test Commands to CLI
The Memfault SDK functionality can be easily exercised via CLI test commands.
If your platform does not have a CLI, these commands can also be wired up to a
button press or called from main() on bootup from a test image
Test platform ports
#include "memfault/components.h"

int test_logging(int argc, char *argv[]) {
  MEMFAULT_LOG_DEBUG("Debug log!");
  MEMFAULT_LOG_INFO("Info log!");
  MEMFAULT_LOG_WARN("Warning log!");
  MEMFAULT_LOG_ERROR("Error log!");
  return 0;
}
#include "memfault/components.h"

// Runs a sanity test to confirm coredump port is working as expected
int test_coredump_storage(int argc, char *argv[]) {

  // Note: Coredump saving runs from an ISR prior to reboot so should
  // be safe to call with interrupts disabled.
  your_platform_disable_interrupts();
  memfault_coredump_storage_debug_test_begin();
  your_platform_enable_interrupts();

  memfault_coredump_storage_debug_test_finish();
  return 0;
}
Test core SDK functionality
#include "memfault/components.h"

// Triggers an immediate heartbeat capture (instead of waiting for timer
// to expire)
int test_heartbeat(int argc, char *argv[]) {
  memfault_metrics_heartbeat_debug_trigger();
  return 0;
}

int test_trace(int argc, char *argv[]) {
  MEMFAULT_TRACE_EVENT_WITH_LOG(critical_error, "A test error trace!");
  return 0;
}

//! Trigger a user initiated reboot and confirm reason is persisted
int test_reboot(int argc, char *argv[]) {
  memfault_reboot_tracking_mark_reset_imminent(kMfltRebootReason_UserReset, NULL);
  memfault_platform_reboot();
}
Test different crash types where a coredump should be captured
#include "memfault/components.h"

int test_assert(int argc, char *argv[]) {
  MEMFAULT_ASSERT(0);
  return -1; // should never get here
}

int test_fault(void) {
  void (*bad_func)(void) = (void *)0xEEEEDEAD;
  bad_func();
  return -1; // should never get here
}

int test_hang(int argc, char *argv[]) {
  while (1) {}
  return -1; // should never get here
}

// Dump Memfault data collected to console
int test_export(int argc, char *argv[]) {
  memfault_data_export_dump_chunks();
  return 0;
}
Post Data to Cloud via Web Bluetooth
Data can be extracted over Bluetooth by implementing a MDS GATT Client in your gateway.
Memfault chunks can also easily be forwarded using Web Bluetooth.
For Web Bluetooth support on some versions of Linux and Windows, you need to navigate to chrome://flags#enable-experimental-web-platform-features and enable "Experimental Web Platform Features". More details can be found here.
To try it out, simply:
- Open or install a recent version of the Google Chrome Browser
- Make sure your Bluetooth LE device is advertising
- Navigate to the Memfault Diagnostic Web Bluetooth App at https://mflt.io/mds, click "Connect", and select your device.
- Upon connection any data already collected by the memfault-firmware-sdk will
be immediately sent and forwarded to Memfault for analysis. While connected,
new data will be periodically flushed to Memfault. The default interval data
is checked for is every 60 seconds and can be adjusted by adding
MDS_POLL_INTERVAL_MSto yourmemfault_platform_config.h.
For development purposes, data can also be extracted and posted via a CLI or GDB connection. More details can be found below.
Post Chunks via Local Debug Setup
Prior to having an end-to-end transport in place, Memfault data can be exported over any serial connection or via GDB directly.
Post Chunks To Memfault
All data collected by Memfault can be exported as opaque packets called
"chunks". To trigger an export, call the test_export command added to your
device CLI.
If data has been collected, you will see strings with the format:
MC:BASE64_ENCODED_CHUNK: in the dump.
It's perfectly fine for other logs to be interleaved with the exported data.
For example:
shell> reboot
[00:00:01] INFO: System Booting!
[00:00:02] INFO: Memfault Build ID: d8d6a047282f025fffa29fa767100f310bc40f80
shell> trace
# CLI command making a call to `memfault_data_export_dump_chunks`
shell> export
[00:00:10] INFO: MC:SFQCpwIBAwEHalRFU1RTRVJJQUwKbXRlc3Qtc29mdHdhcmUJajEuMC4wLXRlcw==:
Copy the logs from the console, navigate to the "Integration Hub / Chunks Debug" view for your project, and paste the logs:
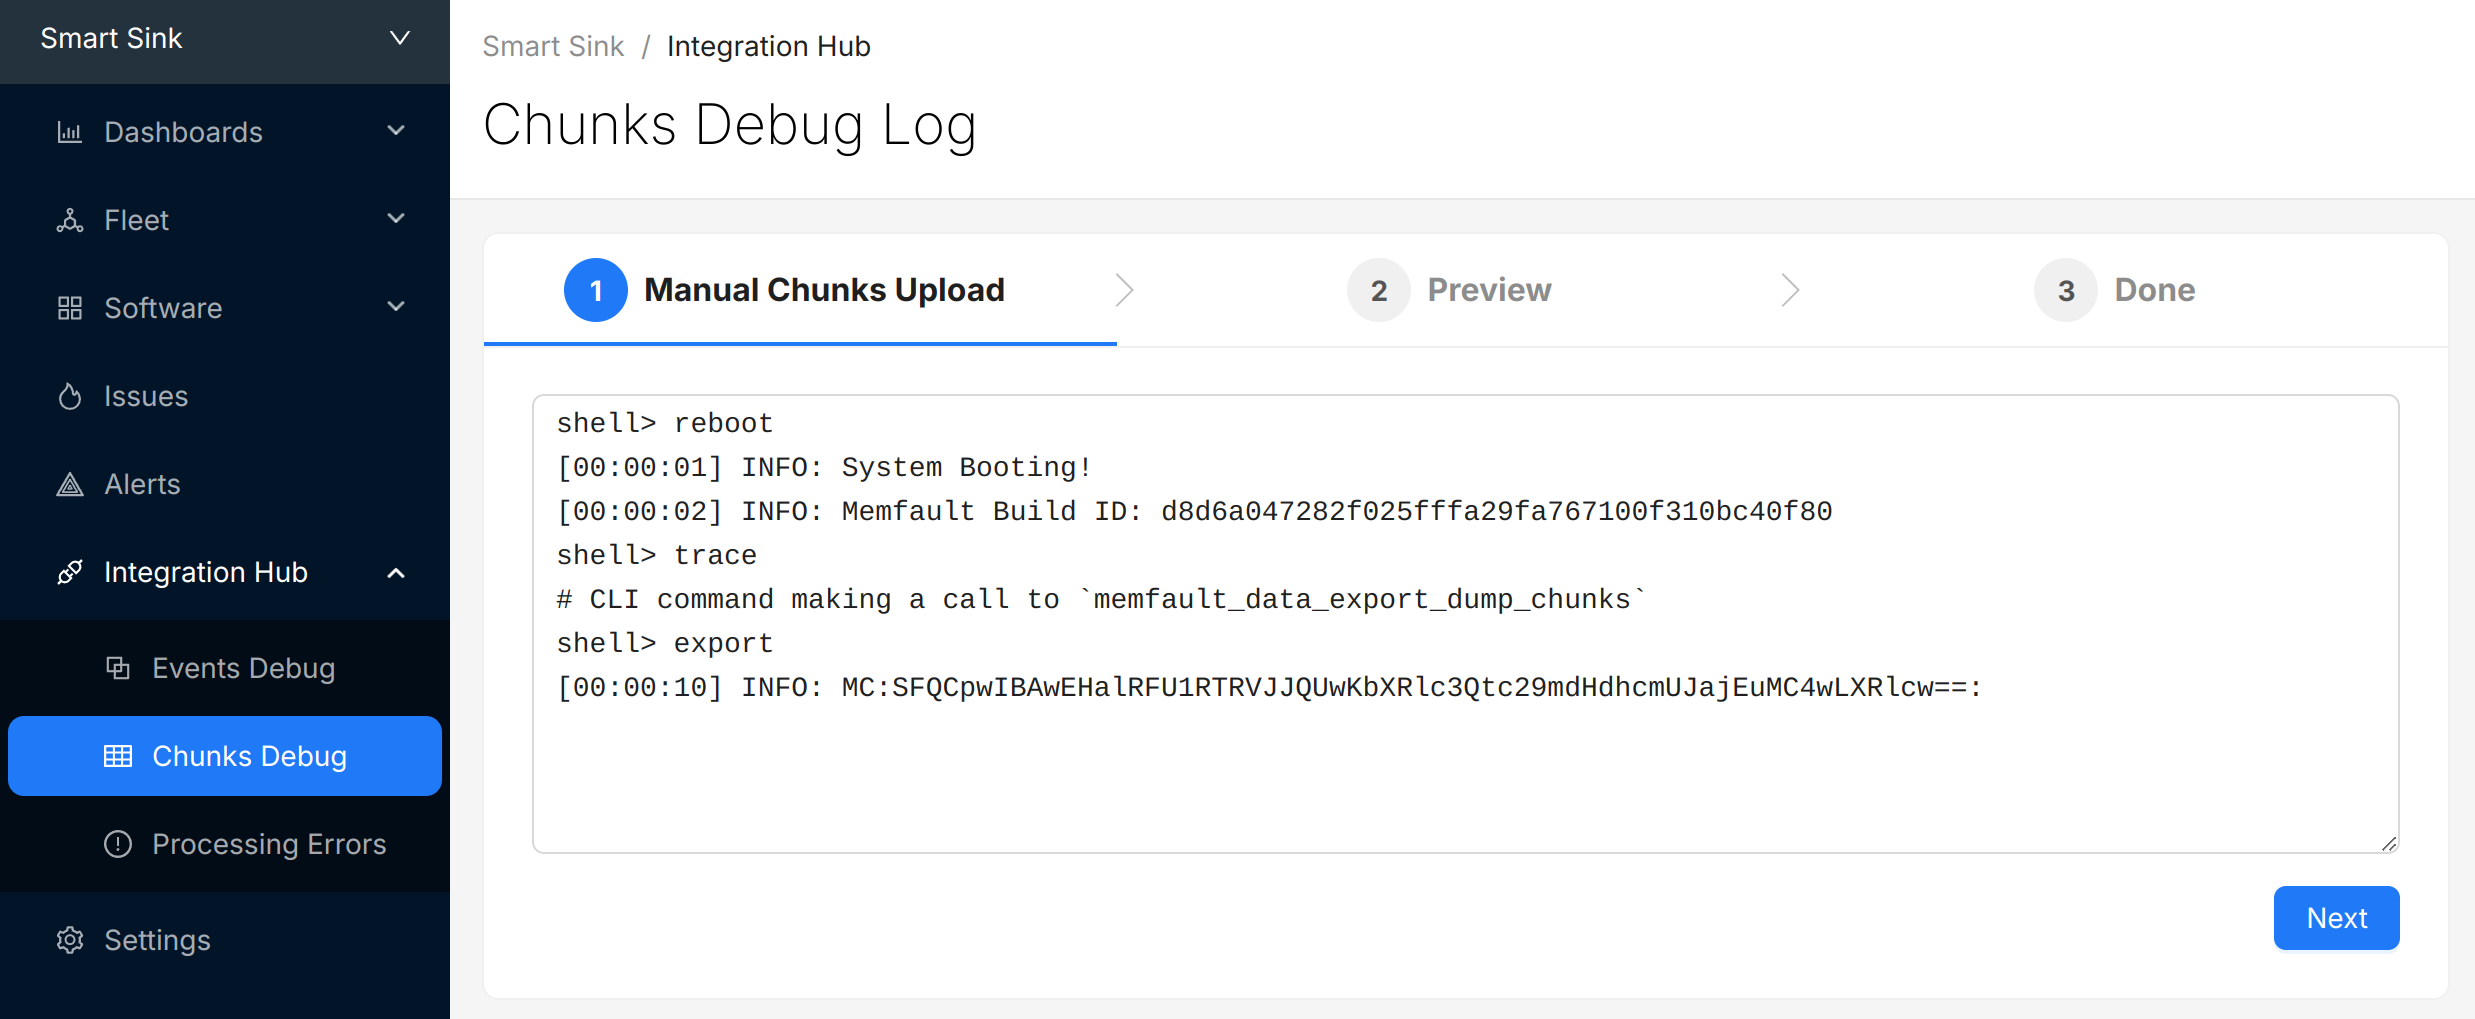
Select "Next" to review the chunks that were identified and (optionally) update the "Device Serial" being used to report data:
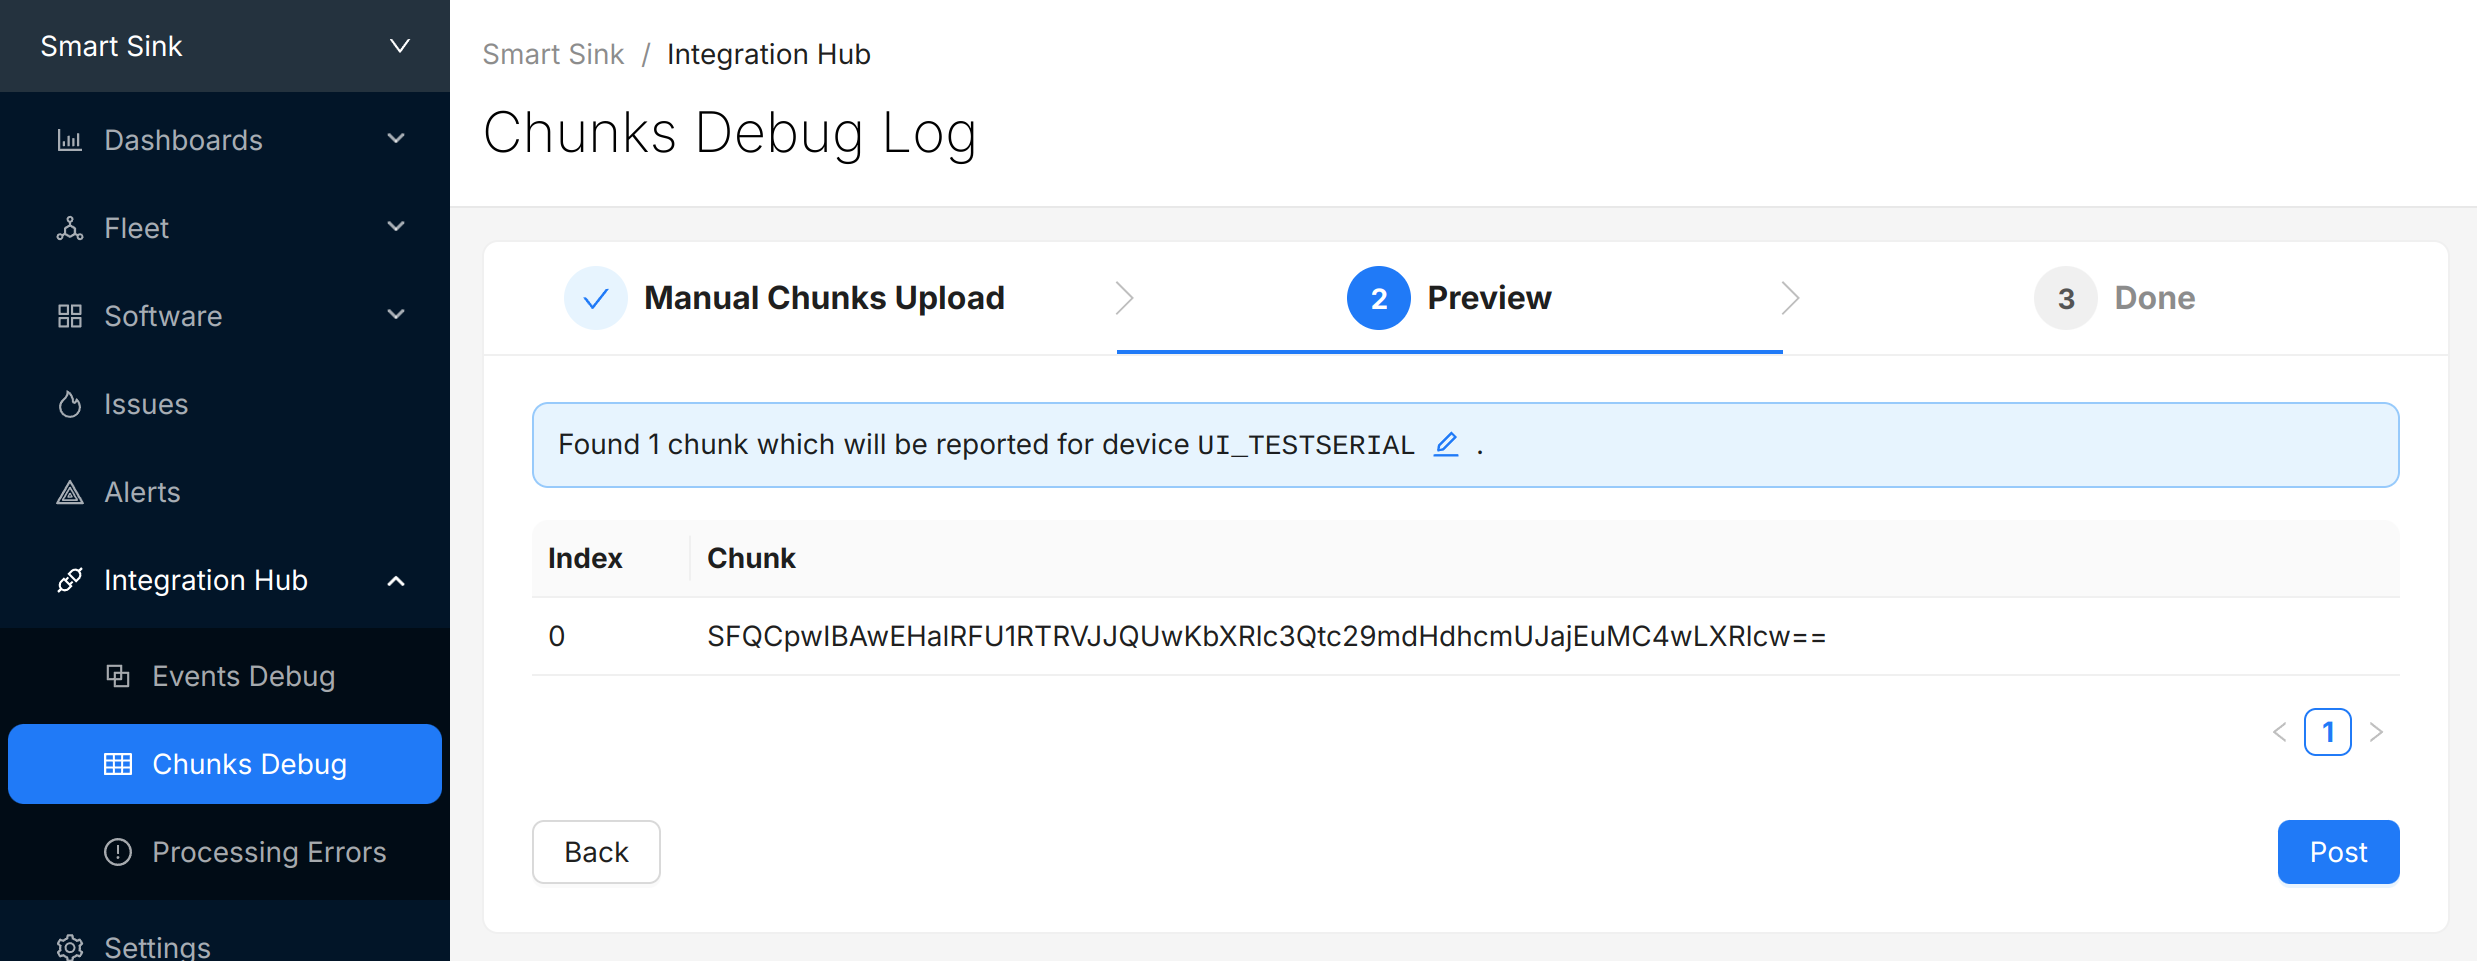
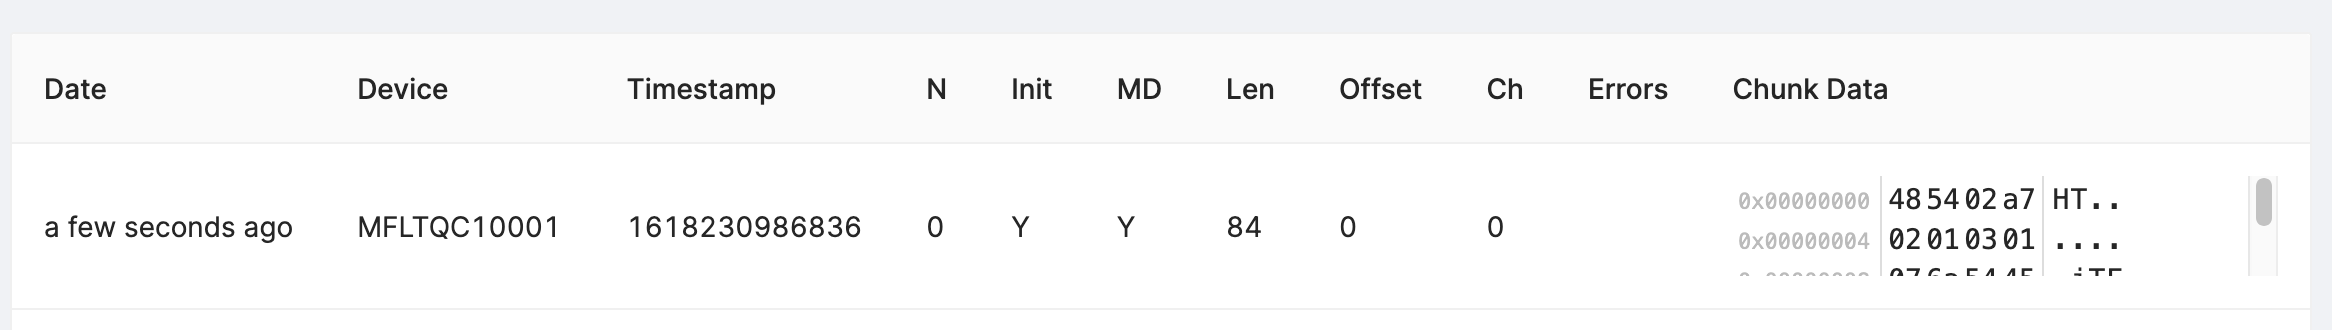
Select "Post" to submit the chunks to Memfault. The chunks will appear in the view directly below. Check and make sure there are no "Errors" to address.
(Optional) Automate Chunk Posting
Posting chunks from a local setup can be automated using our CLI tool or GDB script.
This strategy can also be used even when an end-to-end transport is in place for local QA testing or in CI/CD test automation setups.
Automated Posting Options
Prerequisite: Project Key from Memfault UI
A Project key will be needed in order to communicate with Memfault's web services. Go to https://app.memfault.com/, navigate to the project you want to use and select 'Settings'→'General'. The 'Project Key' listed is what you will want to use.
With Desktop CLI Tool
Install the Python Memfault CLI Tool
The Memfault Desktop CLI tool. tool is written in Python and published publicly in the Python Package Index (pypi).
To install it, make sure you have a recent version of Python 3.x installed and run:
$ pip3 install memfault-cli
$ memfault --help
Save device logs to file
Start your console with your favorite terminal client. Let the system run for a
bit, periodically dumping data to the console by calling
memfault_data_export_dump_chunks().
You should see strings with the format: MC:BASE64_ENCODED_CHUNK: in the dump.
It's perfectly fine for other logs to be interleaved with the exported data.
For example:
# CLI command recording a reboot reason, then rebooting the system
shell> test_reboot
MFLT:[INFO] GNU Build ID: 3c92e3313fe1c9d00ac8687ce966d5f527a05ed3
MFLT:[INFO] S/N: freertos-example
MFLT:[INFO] SW type: qemu-app
MFLT:[INFO] SW version: 1.0.0
MFLT:[INFO] HW version: qemu-mps2-an385
MFLT:[INFO] Memfault Initialized!
# CLI command capturing a trace event
shell> test_trace
# CLI command making a call to `memfault_data_export_dump_chunks()`
shell> export
[00:00:10] INFO: MC:SFQCpwIBAwEHalRFU1RTRVJJQUwKbXRlc3Qtc29mdHdhcmUJajEuMC4wLXRlcw==:
Save the resulting logs to a file such as logs.txt.
Post chunks from logs with Memfault CLI
Run the desktop Memfault CLI tool on your saved log file. The utility will parse the logs, extract the Memfault data, and post it for processing!
$ memfault --project-key ${YOUR_PROJECT_KEY} post-chunk --encoding sdk_data_export logs.txt
Found 2 Chunks. Sending Data ...
Success
With GDB
Prerequisites
- You need to have a way to debug your product with GDB as part of your development setup
- The GDB version you are using needs to have the
GDB Python API enabled.
(It's generally the default or there is a
-pyversion of GDB which has it included.) - You need to compile your firmware with debug symbol information (i.e
-gCFLAG)
Even if you are using other compilers such as ARMCC or IAR, you can load the ELF (.out, .elf) generated and debug it in GDB as well.
Launch GDB and connect debugger
For example:
$ arm-none-eabi-gdb-py my_app.elf --ex="target remote :3333"
(gdb)
Load Memfault GDB script
Copy and paste and run the following in gdb:
python exec('try:\n from urllib2 import urlopen\nexcept:\n from urllib.request import urlopen'); exec(urlopen('https://app.memfault.com/static/scripts/memfault_gdb.py').read())
Some GDB versions do not support Python scripting by default. If you see a message like "Python scripting is not supported in this copy of GDB", you might be able to run an alternative GDB binary with a -py suffix, for example arm-none-eabi-gdb-py.
Register Handler
Copy the command below and paste it into GDB and hit enter. This will load a
handler which automatically posts data to Memfault whenever
memfault_data_export_dump_chunks is called.
memfault install_chunk_handler --verbose --project-key <YOUR_PROJECT_KEY>
memfault_data_export_dump_chunks() needs to be called by your port as part of
a CLI command or periodic task in order for the data to be extracted. For
example:
#include "memfault/components.h"

int export_data_cli_command(int argc, char *argv[]) {
  memfault_data_export_dump_chunks();
  return 0;
}

void some_periodic_task(void) {
  memfault_data_export_dump_chunks();
}
Try It Out!
Now, every time memfault_data_export_dump_chunks is called, the data passed as
a parameter to the function will automatically be posted to the Memfault cloud.
You don't have to do anything else! You will see logs print in the gdb CLI as
data is posted:
(gdb) Continuing.
Successfully posted 45 bytes of chunk data
Successfully posted 53 bytes of chunk data
[...]
Troubleshooting Data Transfer
If you encounter any issues in your data transfer implementation, Memfault has tools to help debug!
- To troubleshoot data not getting uploaded or processed correctly by the Memfault cloud, take a look at the Integration Hub → Processing Log view. This provides a filterable, chronological view of recent errors that have occurred while processing received data. See this documentation page for more information on the Integration Hub.
- A view you can use toview the raw "Chunk" data payloadsthat have arrived for your project.
- Precanned Data Payloads you can pass through your `user_transport_send_chunk_data()` implementation to test data transfer in isolation.
- Server-side rate limiting will apply to the device you're using to work on the integration process. Once you can see the device on the Memfault Web App, consider enabling Server-Side Developer Mode for it on the Memfault Web App to temporarily bypass these limits.
Upload Symbol File
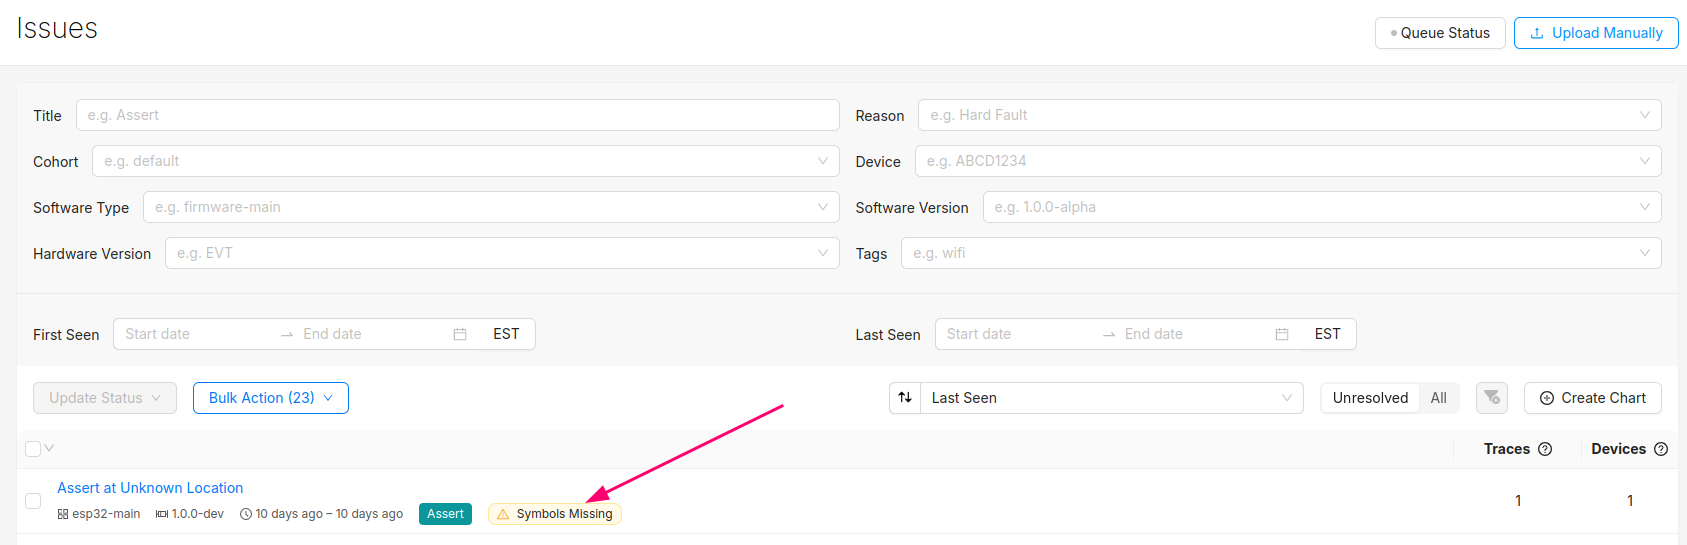
At this point, you should be able to generate test events and crashes and push the data to the Memfault UI.
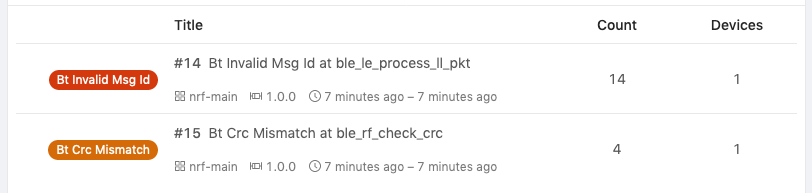
You can confirm the error traces and crashes have arrived successfully by navigating to the "Issues" page- there should be a new issue with the "Symbols Missing" label:
Clicking into the Issue will show the trace and a message that the symbol file is missing. It can be uploaded by clicking the button highlighted below:
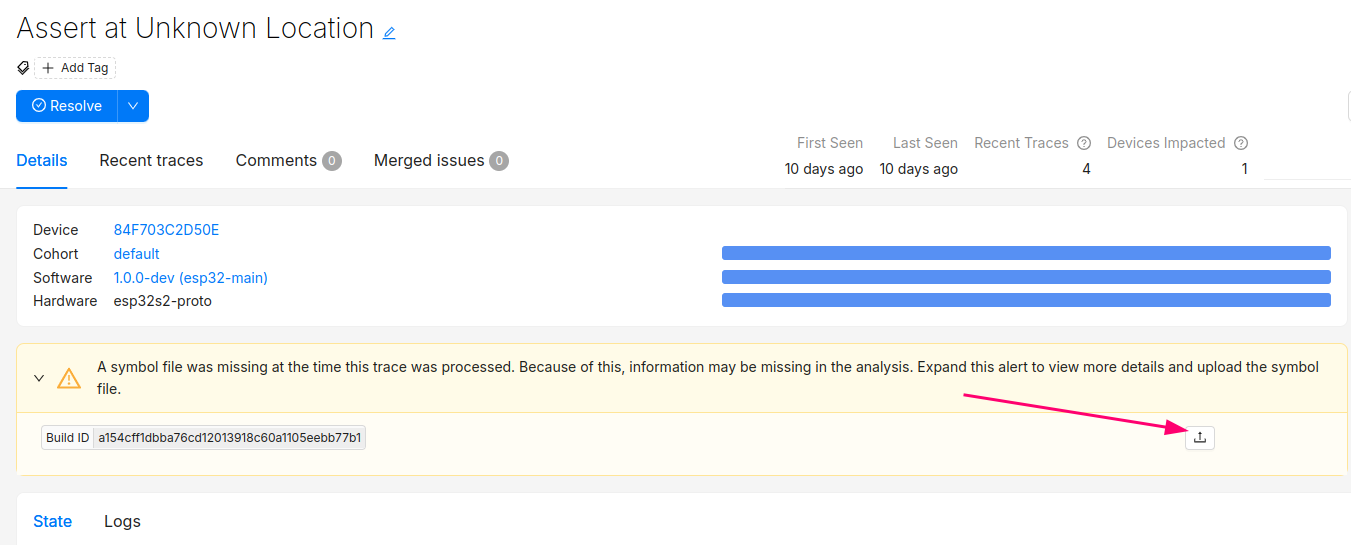
After this step, you will see the processed trace in the list of issues!
The Issue created when the symbol file is missing can now be set to resolved. It's good practice to always upload a symbol file before devices send any data.
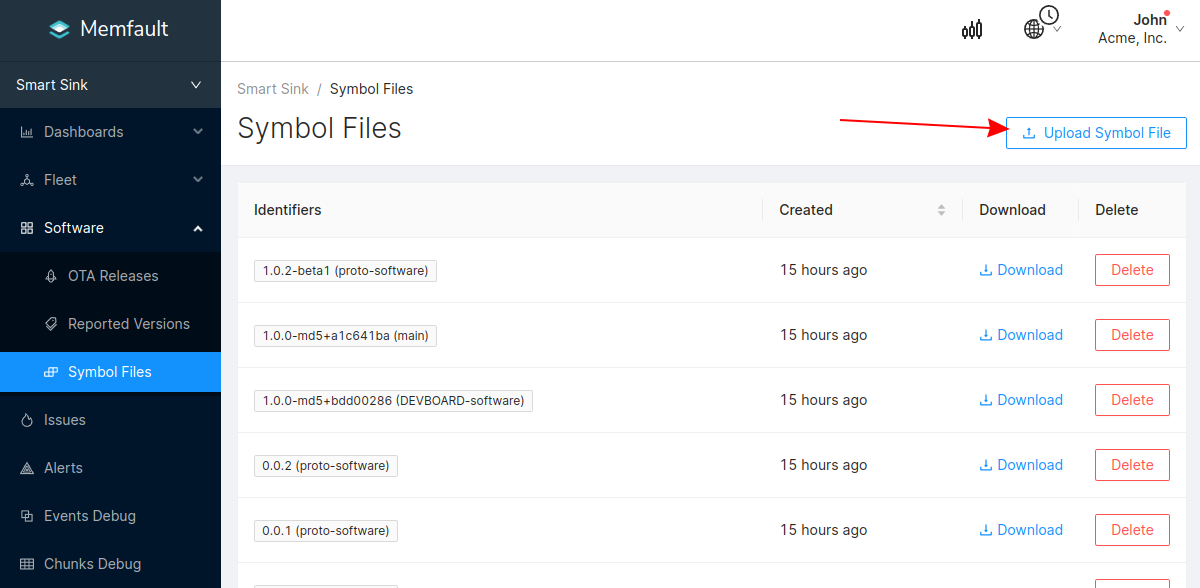
Symbol files can also be uploaded from the Software → Symbol Files tab (follow this deep link to be brought to the symbol file upload point in the UI):
In addition to supporting decoding trace/coredump data, symbol files are also required for decoding Metrics.
You can programmatically upload symbol files with the Memfault CLI tool.
Symbol files should be uploaded to Memfault before devices send any data, to ensure all device data can be decoded.