Infineon ModusToolbox™ Getting Started Guide for PSoC™ 6
This tutorial will go over integrating the Memfault Firmware SDK into a PSoC™ 6 project using Infineon's ModusToolbox™ Software SDK.
Note: these instructions were written using ModusToolbox™ release v3.0 and
tested against the
CY8CKIT-062S2-43012
evaluation board.
These instructions should also apply to any other Infineon PSoC™ 6 family board.
A full example project targeting the CY8CKIT-062S2-43012 development board can
be found at
https://github.com/memfault/mtb-example-memfault
Overview
This document describes how to integrate the Memfault SDK into a Infineon ModusToolbox™ based project.
Prerequisite
This guide assumes you already have an application running on a PSoC™ 6 development board. At a high level, this will require the following steps.
-
Download ModusToolbox™ Software SDK from Infineon.
-
Generate a sample project from that SDK. This can be done from the IDE or using the
project-creator-clibinary. This can typically be found in the ModusToolbox™ installation directory, such as/Applications/ModusToolbox/tools_3.0.project-creator-cli --board-id CY8CKIT-062S2-43012 \
--app-id mtb-example-anycloud-udp-server \
--user-app-name my_example_app -
Compile and program application on development board, i,e
$ cd my_example_app
$ make getlibs
$ make build -j8
$ make program
For further documentation about ModusToolbox™ and how to use it, check out Infineon's website here!
Integrate the Memfault SDK
Add the Memfault Sources and Build Flags
-
The Memfault SDK is implemented as a ModusToolbox™ middleware library and can be imported using the "library-manager". To launch the library manager for your project, either type
make modlibsfrom the command line or click on "Library Manager" under the tools tab in the IDE. From there, search for "Memfault Firmware SDK" and click "Update"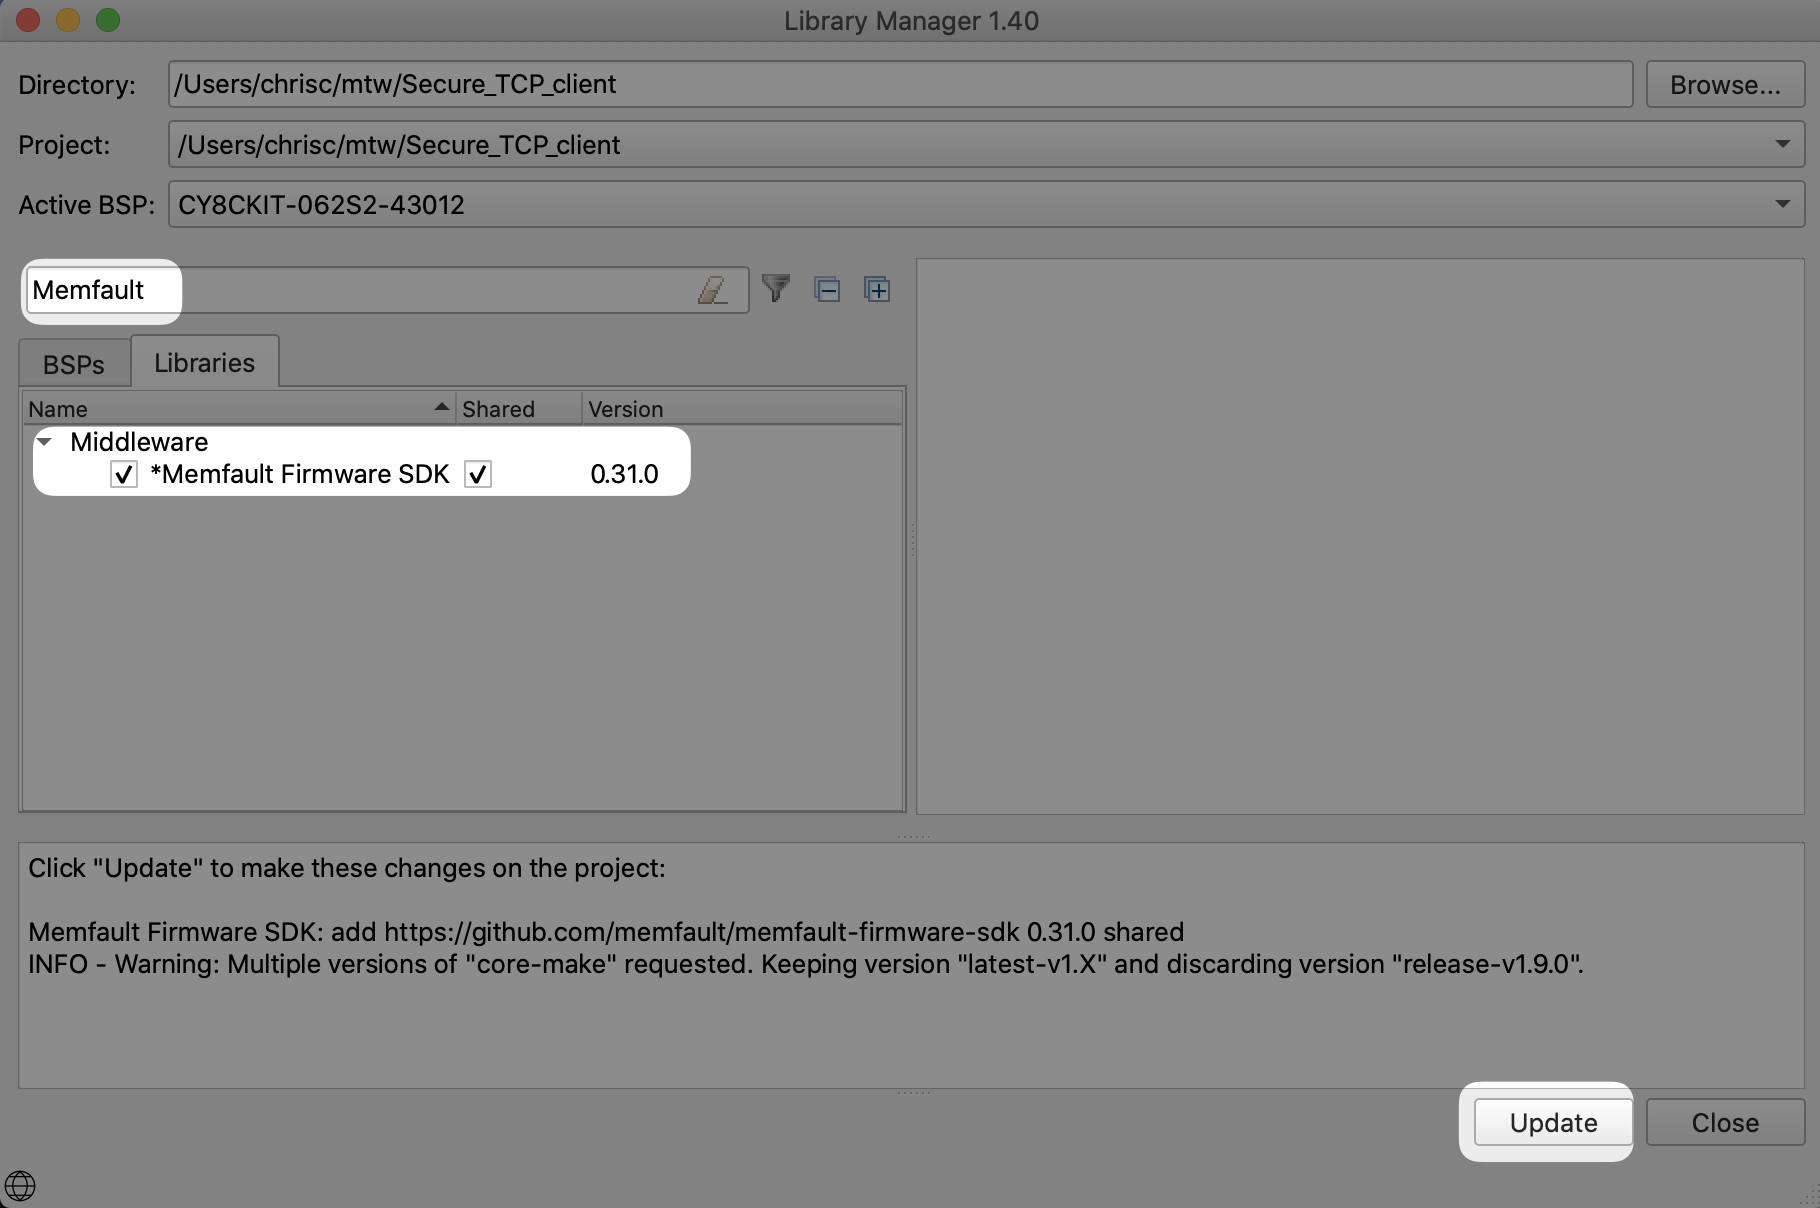
Alternatively, you can add the library manually by creating
deps/memfault-firmware-sdk.mtband runningmake getlibs$ echo 'https://github.com/memfault/memfault-firmware-sdk#0.31.0#$$ASSET_REPO$$/memfault-firmware-sdk/0.31.0' > deps/memfault-firmware-sdk.mtb
$ make getlibs -
Add
#include "memfault/ports/freertos_trace.h"to yourFreeRTOSConfig.hfile. By default ModusToolbox™ will place the file in your projects root directory.diff --git a/FreeRTOSConfig.h b/FreeRTOSConfig.h
index 4718e2a..7fc9a78 100644
--- a/FreeRTOSConfig.h
+++ b/FreeRTOSConfig.h
@@ -39,6 +39,8 @@
#ifndef FREERTOS_CONFIG_H
#define FREERTOS_CONFIG_H
+#include "memfault/ports/freertos_trace.h"
+ -
Add a unique identifier to project. Memfault will use this to match the appropriate symbol files to decode information published by the memfault-firmware-sdk. This requires a modification to your project's
Makefile.importantThis step requires the memfault Build ID package in your python environment, which can be installed with pip:
pip install mflt-build-idAdd the following snippet to the bottom of your project's
Makefile:# Note these must be placed after including the MTB make files as those files define
# many variables used to define memfault_post_build
# Target/symbol file of the app
APP_TARGET_FILE=$(MTB_TOOLS__OUTPUT_CONFIG_DIR)/$(APPNAME).$(MTB_RECIPE__SUFFIX_TARGET)
# Program/hex file of the app
APP_PROGRAM_FILE=$(MTB_TOOLS__OUTPUT_CONFIG_DIR)/$(APPNAME).$(MTB_RECIPE__SUFFIX_PROGRAM)
# Add additional dependency to hex file to ensure mflt_build_id runs before it is built
$(APP_PROGRAM_FILE): memfault_post_build
# Custom target to run mflt_build_id after target file is built but before program file
# is built to ensure correct Build ID is included.
memfault_post_build: $(APP_TARGET_FILE)
$(PYTHON_PATH) -m mflt_build_id.__init__ $(APP_TARGET_FILE)
.PHONY: memfault_post_build -
Update Makefile with an additional linker script. Add the following .ld file to the build. This will enable the collection of all FreeRTOS task state when a crash takes place.
diff --git a/Makefile b/Makefile

-LDFLAGS=
+LDFLAGS= -T$(SEARCH_memfault-firmware-sdk)/ports/cypress/psoc6/memfault_bss.ld -
Implement the following dependency functions in your project following the inline steps below:
#include "memfault/components.h"

sMfltHttpClientConfig g_mflt_http_client_config = {
  // retrieve Project Key from: https://mflt.io/project-key
  .api_key = "YOUR_PROJECT_KEY",
};#include "memfault/core/platform/device_info.h"
void memfault_platform_get_device_info(sMemfaultDeviceInfo *info) {
// !FIXME: Populate with platform device information
//
// *NOTE* All fields must be populated, and the values assigned to the fields
// must have static lifetime: the data is accessed when this function returns.
// In this example, the fields are string literals, which are placed either
// inline into .text data tables, or in .rodata, and the pointers are valid
// for the lifetime of the program
//
// See https://mflt.io/version-nomenclature for more context
*info = (sMemfaultDeviceInfo) {
// Set the device serial to a unique value.
// It is typically set to a unique identifier like a serial number
// or MAC address.
// This is used to de-deduplicate data in Memfault cloud
.device_serial = "DEMOSERIAL",
// Set the device software type.
// It can be simply "app" for a single-chip device, otherwise it
// should match the component name, eg "ble", "sensor" etc.
// This is used to filter devices in the Memfault UI
.software_type = "app-main",
// Set the device software version.
// If using Memfault OTA, this should exactly match the OTA Release
// Version name for the installed image
.software_version = "1.0.0-dev",
// Set the device hardware revision.
// This is used to filter/group devices in the Memfault UI
.hardware_version = "evt",
};
} -
Initialize Memfault SDK from your
mainfunction before starting the FreeRTOS scheduler//! @file main.c
#include "memfault/components.h"
int main(void) {
// ...
memfault_platform_boot();
// ...
vTaskStartScheduler();
}
Verification & Tuning Steps
Add Test Commands to CLI
With Memfault compiling into your build, it's now time to add some initial instrumentation and test the integration! The quickest way to do this is to extend or add a command line interface.
For projects that have a CLI expand here for instructions
The Memfault SDK functionality can be easily exercised via CLI test commands.
If your platform does not have a CLI, these commands can also be wired up to a
button press or called from main() on bootup from a test image
Test platform ports
#include "memfault/components.h"

int test_logging(int argc, char *argv[]) {
  MEMFAULT_LOG_DEBUG("Debug log!");
  MEMFAULT_LOG_INFO("Info log!");
  MEMFAULT_LOG_WARN("Warning log!");
  MEMFAULT_LOG_ERROR("Error log!");
  return 0;
}
#include "memfault/components.h"

// Runs a sanity test to confirm coredump port is working as expected
int test_coredump_storage(int argc, char *argv[]) {

  // Note: Coredump saving runs from an ISR prior to reboot so should
  // be safe to call with interrupts disabled.
  your_platform_disable_interrupts();
  memfault_coredump_storage_debug_test_begin();
  your_platform_enable_interrupts();

  memfault_coredump_storage_debug_test_finish();
  return 0;
}
Test core SDK functionality
#include "memfault/components.h"

// Triggers an immediate heartbeat capture (instead of waiting for timer
// to expire)
int test_heartbeat(int argc, char *argv[]) {
  memfault_metrics_heartbeat_debug_trigger();
  return 0;
}

int test_trace(int argc, char *argv[]) {
  MEMFAULT_TRACE_EVENT_WITH_LOG(critical_error, "A test error trace!");
  return 0;
}

//! Trigger a user initiated reboot and confirm reason is persisted
int test_reboot(int argc, char *argv[]) {
  memfault_reboot_tracking_mark_reset_imminent(kMfltRebootReason_UserReset, NULL);
  memfault_platform_reboot();
}
Test different crash types where a coredump should be captured
#include "memfault/components.h"

int test_assert(int argc, char *argv[]) {
  MEMFAULT_ASSERT(0);
  return -1; // should never get here
}

int test_fault(void) {
  void (*bad_func)(void) = (void *)0xEEEEDEAD;
  bad_func();
  return -1; // should never get here
}

int test_hang(int argc, char *argv[]) {
  while (1) {}
  return -1; // should never get here
}

// Dump Memfault data collected to console
int test_export(int argc, char *argv[]) {
  memfault_data_export_dump_chunks();
  return 0;
}
If your project does not already have a command line for testing, the memfault
demo CLI can be added for quick verification. To do this, copy the following
into a memfault_cli_task.c and then call memfault_cli_task_start() from your
main routine.
//! @file memfault_cli_task.c

#include "cyhal.h"
#include "memfault/components.h"

#include "cy_retarget_io.h"

#include <FreeRTOS.h>
#include <task.h>

#define MEMFAULT_CLI_TASK_SIZE (1024)
#define MEMFAULT_CLI_TASK_PRIORITY (1)

static int prv_send_char(char c) {
  cyhal_uart_putc(&cy_retarget_io_uart_obj, c);
  return 0;
}

void memfault_cli_task(void *arg) {
  cyhal_syspm_lock_deepsleep();
  const sMemfaultShellImpl impl = {
    .send_char = prv_send_char,
  };
  memfault_demo_shell_boot(&impl);

  while (1) {
    uint32_t num_bytes = cyhal_uart_readable(&cy_retarget_io_uart_obj);
    if (num_bytes < 1) {
      // Sleep for a little bit if there was not data
      vTaskDelay(10);
      continue;
    }

    uint8_t rx_byte;
    // data should be available so we should not need to wait
    const uint32_t uart_input_timeout_ms = 1;
    cy_rslt_t result = cyhal_uart_getc(&cy_retarget_io_uart_obj, &rx_byte, uart_input_timeout_ms);
    if (result != CY_RSLT_SUCCESS) {
      MEMFAULT_LOG_ERROR("Unexpected UART read error: 0x%x", (int)result);
      continue;
    }

    memfault_demo_shell_receive_char(rx_byte);
  }
}

void memfault_cli_task_start(void) {
  xTaskCreate(memfault_cli_task, "MFLT CLI", MEMFAULT_CLI_TASK_SIZE,
              NULL, MEMFAULT_CLI_TASK_PRIORITY, NULL);
}
At boot, you should now see something like:
[I] Memfault Build ID: 7726fbc695f4c50db091746118ad69468e152341
[I] S/N: DEMOSERIAL
[I] SW type: app-fw
[I] SW version: 1.0.0-dev
[I] HW version: dvt1
[I] Reset Reason, Cy_SysLib_GetResetReason=0x10
[I] Reset Cause:
[I]  Software Reset
[I] Memfault Initialized!

mflt>
mflt>
help>
clear_core: Clear an existing coredump
drain_chunks: Flushes queued Memfault data. To upload data see https://mflt.io/posting-chunks-with-gdb
export: Export base64-encoded chunks. To upload data see https://mflt.io/chunk-data-export
get_core: Get coredump info
get_device_info: Get device info
test_assert: Trigger memfault assert
test_busfault: Trigger a busfault
test_hardfault: Trigger a hardfault
test_memmanage: Trigger a memory management fault
test_usagefault: Trigger a usage fault
test_log: Writes test logs to log buffer
test_log_capture: Trigger capture of current log buffer contents
test_reboot: Force system reset and track it with a Trace Event
test_trace: Capture an example Trace Event
help: Lists all commands
Post Data to Cloud via Local Debug Setup
Prior to having an end-to-end transport in place, Memfault data can be exported over any serial connection or via GDB directly.
Post Chunks To Memfault
All data collected by Memfault can be exported as opaque packets called
"chunks". To trigger an export, call the test_export command added to your
device CLI.
If data has been collected, you will see strings with the format:
MC:BASE64_ENCODED_CHUNK: in the dump.
It's perfectly fine for other logs to be interleaved with the exported data.
For example:
shell> reboot
[00:00:01] INFO: System Booting!
[00:00:02] INFO: Memfault Build ID: d8d6a047282f025fffa29fa767100f310bc40f80
shell> trace
# CLI command making a call to `memfault_data_export_dump_chunks`
shell> export
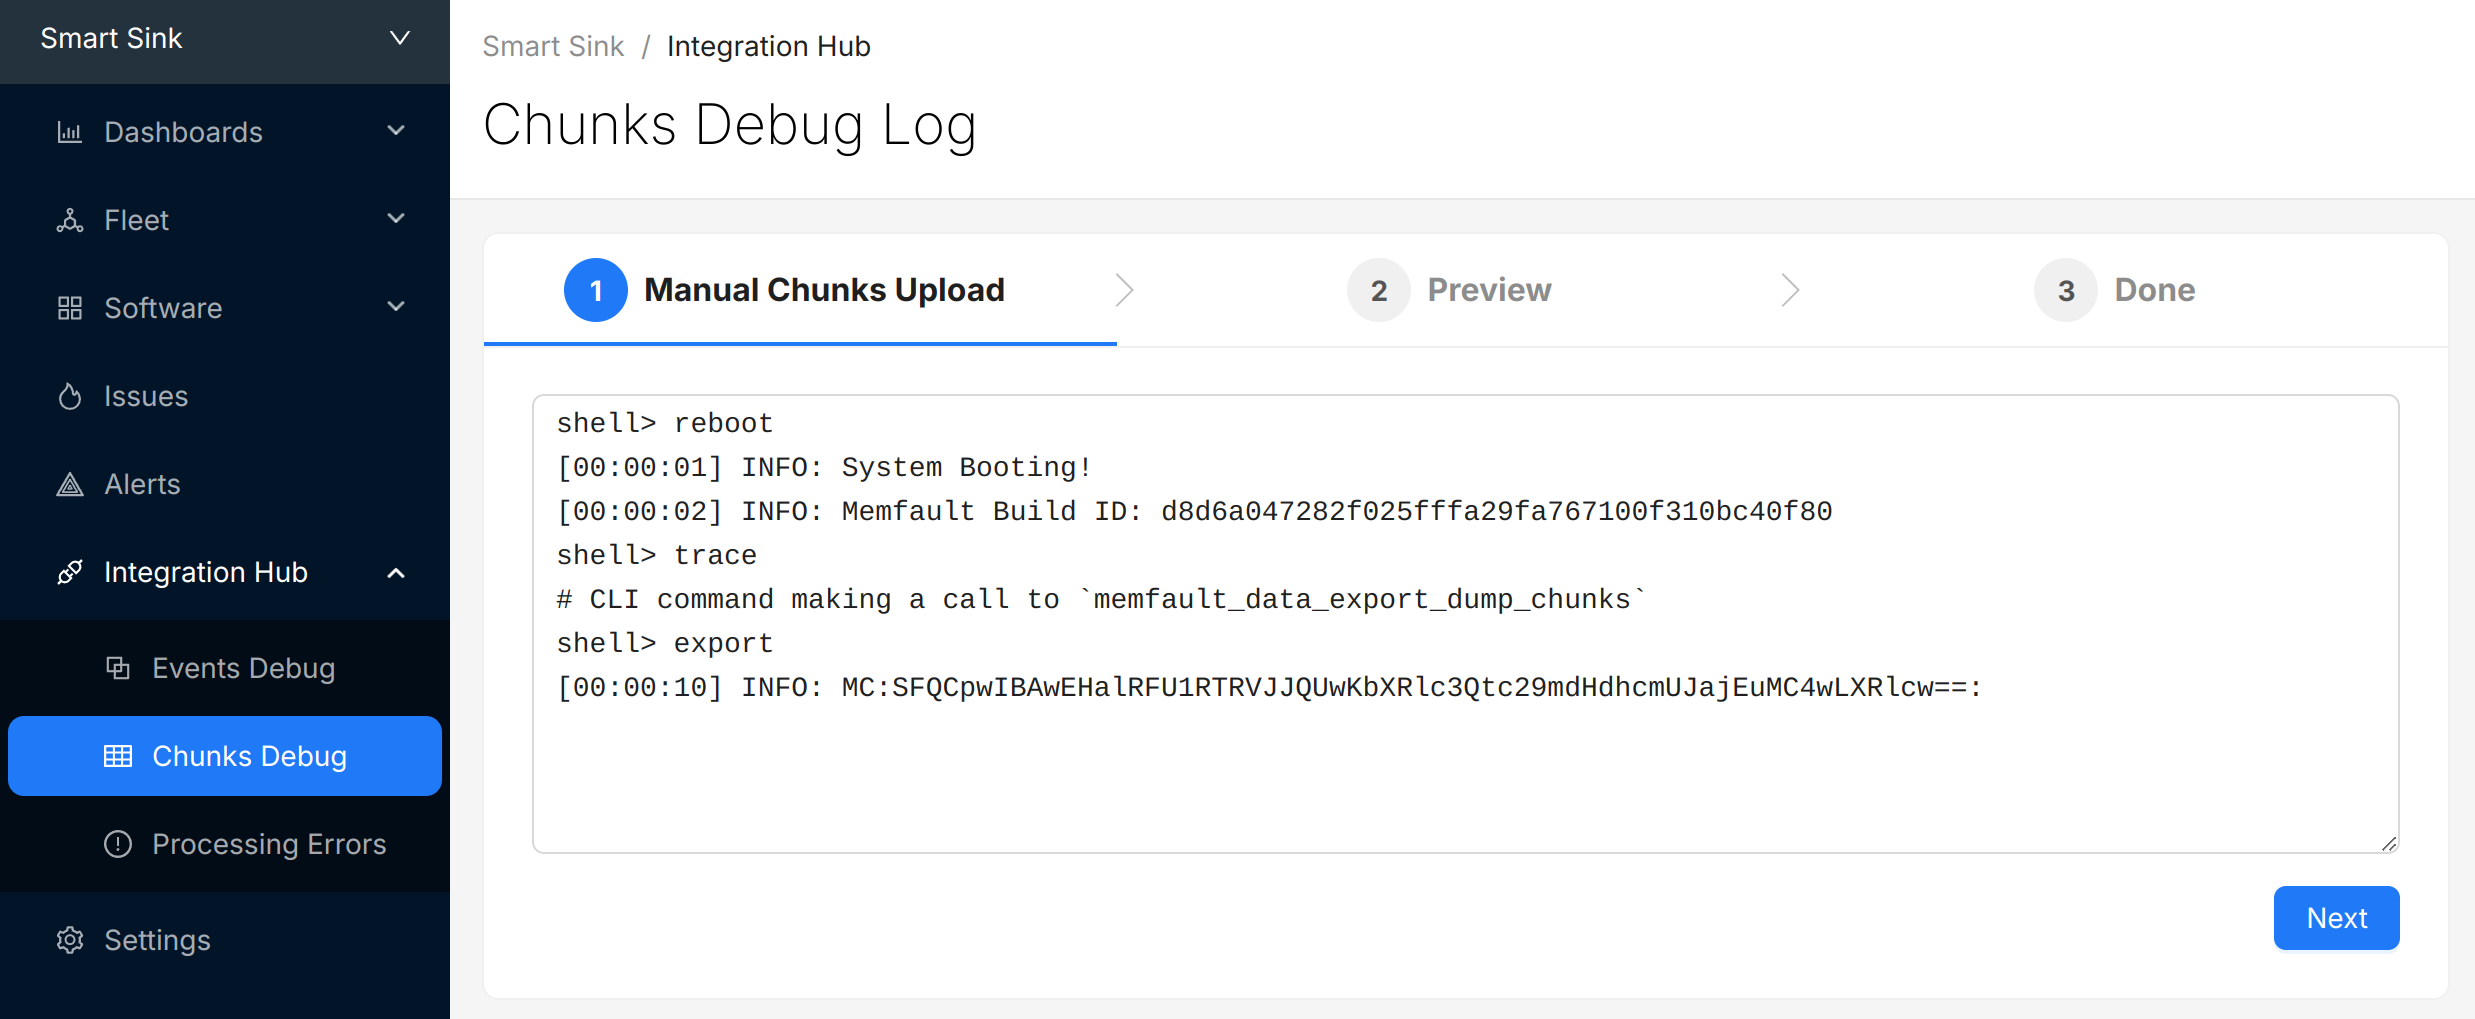
[00:00:10] INFO: MC:SFQCpwIBAwEHalRFU1RTRVJJQUwKbXRlc3Qtc29mdHdhcmUJajEuMC4wLXRlcw==:
Copy the logs from the console, navigate to the "Integration Hub / Chunks Debug" view for your project, and paste the logs:
Select "Next" to review the chunks that were identified and (optionally) update the "Device Serial" being used to report data:
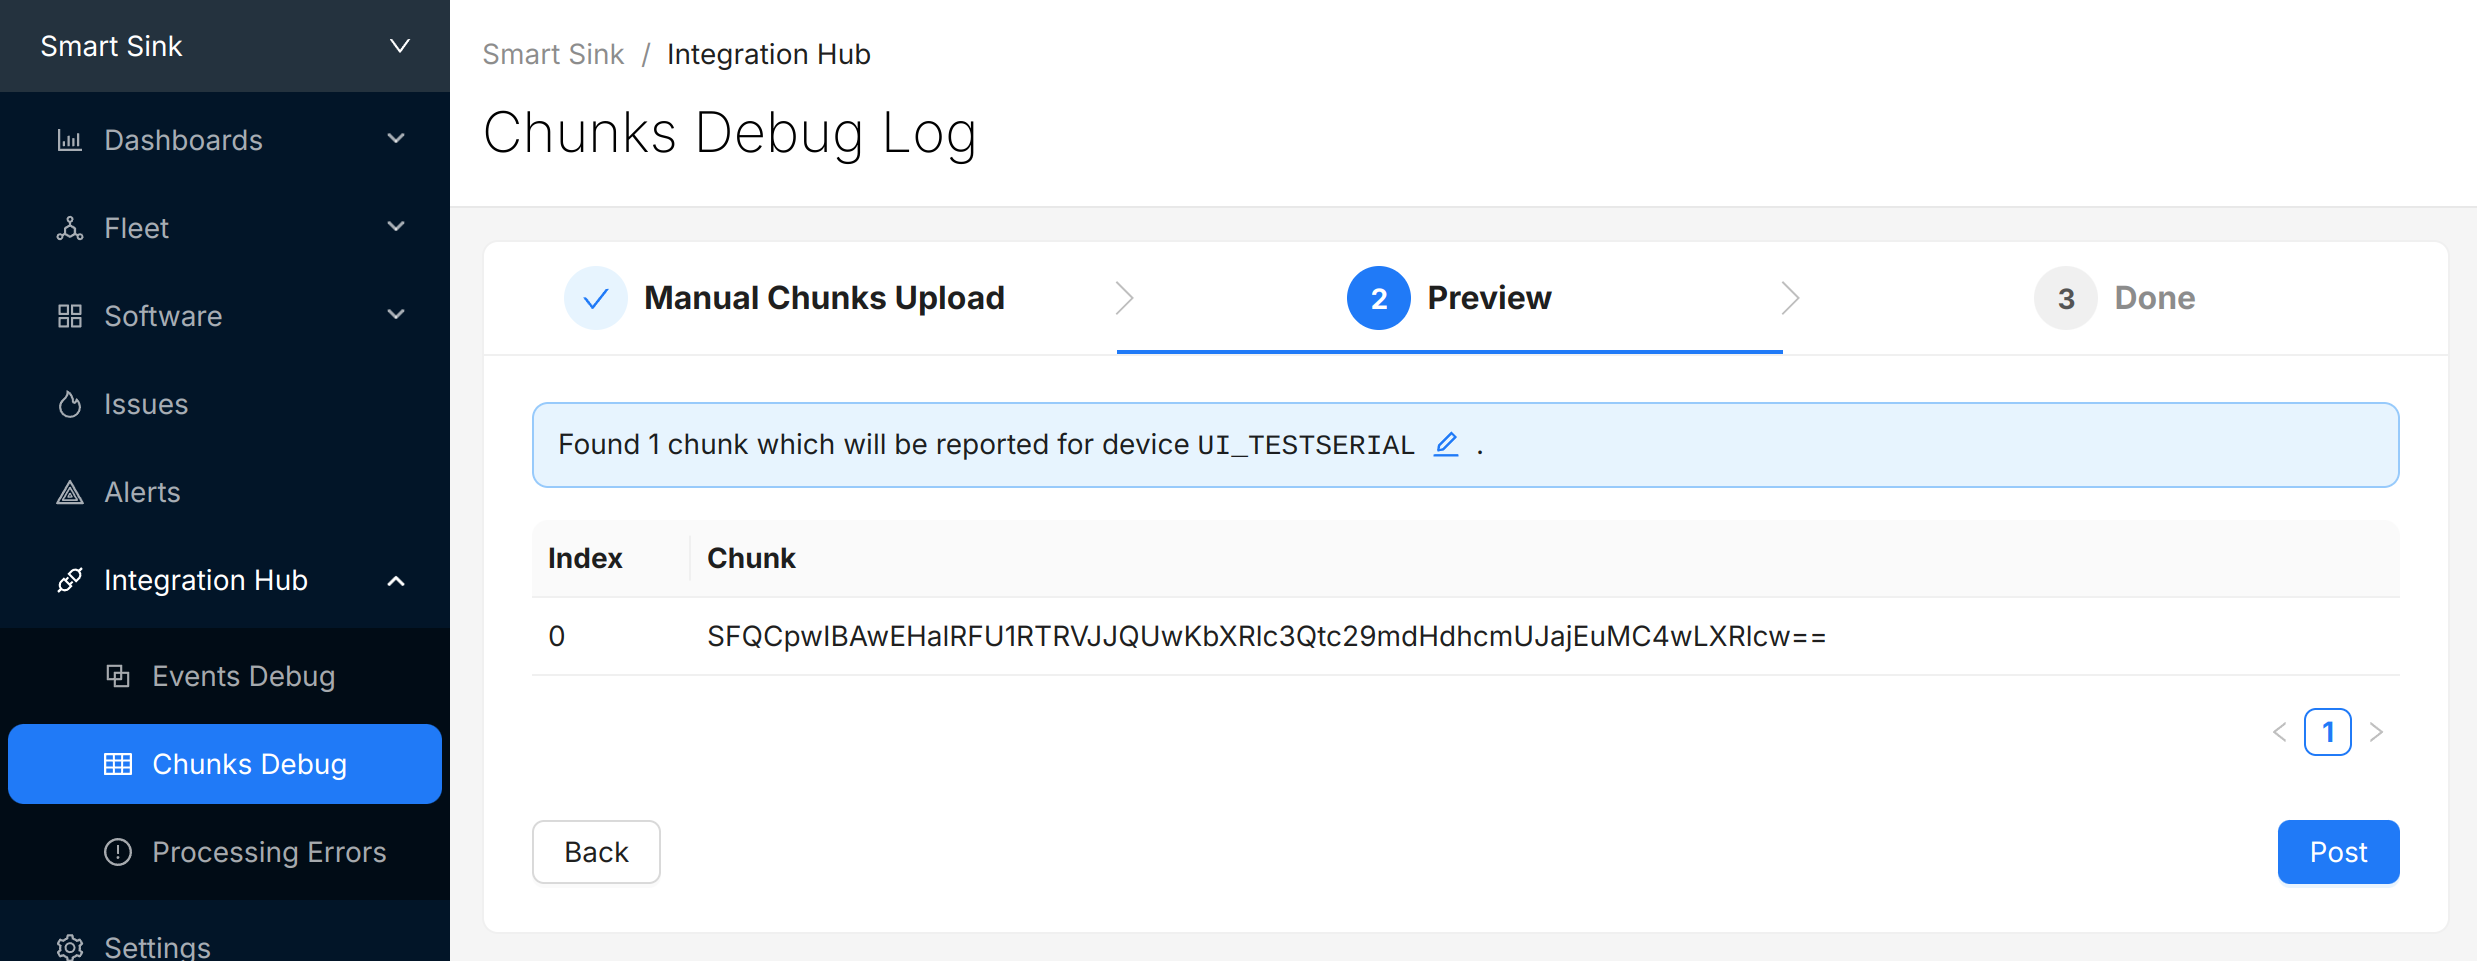
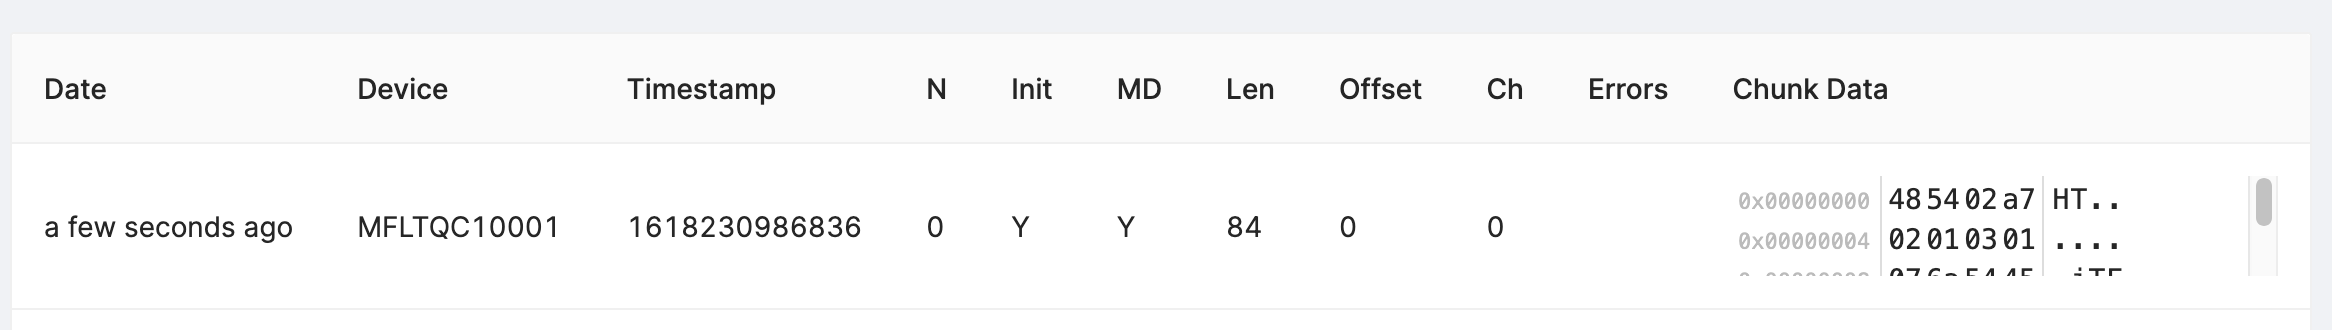
Select "Post" to submit the chunks to Memfault. The chunks will appear in the view directly below. Check and make sure there are no "Errors" to address.
(Optional) Automate Chunk Posting
Posting chunks from a local setup can be automated using our CLI tool or GDB script.
This strategy can also be used even when an end-to-end transport is in place for local QA testing or in CI/CD test automation setups.
Automated Posting Options
Prerequisite: Project Key from Memfault UI
A Project key will be needed in order to communicate with Memfault's web services. Go to https://app.memfault.com/, navigate to the project you want to use and select 'Settings'→'General'. The 'Project Key' listed is what you will want to use.
With Desktop CLI Tool
Install the Python Memfault CLI Tool
The Memfault Desktop CLI tool. tool is written in Python and published publicly in the Python Package Index (pypi).
To install it, make sure you have a recent version of Python 3.x installed and run:
$ pip3 install memfault-cli
$ memfault --help
Save device logs to file
Start your console with your favorite terminal client. Let the system run for a
bit, periodically dumping data to the console by calling
memfault_data_export_dump_chunks().
You should see strings with the format: MC:BASE64_ENCODED_CHUNK: in the dump.
It's perfectly fine for other logs to be interleaved with the exported data.
For example:
# CLI command recording a reboot reason, then rebooting the system
shell> test_reboot
MFLT:[INFO] GNU Build ID: 3c92e3313fe1c9d00ac8687ce966d5f527a05ed3
MFLT:[INFO] S/N: freertos-example
MFLT:[INFO] SW type: qemu-app
MFLT:[INFO] SW version: 1.0.0
MFLT:[INFO] HW version: qemu-mps2-an385
MFLT:[INFO] Memfault Initialized!
# CLI command capturing a trace event
shell> test_trace
# CLI command making a call to `memfault_data_export_dump_chunks()`
shell> export
[00:00:10] INFO: MC:SFQCpwIBAwEHalRFU1RTRVJJQUwKbXRlc3Qtc29mdHdhcmUJajEuMC4wLXRlcw==:
Save the resulting logs to a file such as logs.txt.
Post chunks from logs with Memfault CLI
Run the desktop Memfault CLI tool on your saved log file. The utility will parse the logs, extract the Memfault data, and post it for processing!
$ memfault --project-key ${YOUR_PROJECT_KEY} post-chunk --encoding sdk_data_export logs.txt
Found 2 Chunks. Sending Data ...
Success
With GDB
Prerequisites
- You need to have a way to debug your product with GDB as part of your development setup
- The GDB version you are using needs to have the
GDB Python API enabled.
(It's generally the default or there is a
-pyversion of GDB which has it included.) - You need to compile your firmware with debug symbol information (i.e
-gCFLAG)
Even if you are using other compilers such as ARMCC or IAR, you can load the ELF (.out, .elf) generated and debug it in GDB as well.
Launch GDB and connect debugger
For example:
$ arm-none-eabi-gdb-py my_app.elf --ex="target remote :3333"
(gdb)
Load Memfault GDB script
Copy and paste and run the following in gdb:
python exec('try:\n from urllib2 import urlopen\nexcept:\n from urllib.request import urlopen'); exec(urlopen('https://app.memfault.com/static/scripts/memfault_gdb.py').read())
Some GDB versions do not support Python scripting by default. If you see a message like "Python scripting is not supported in this copy of GDB", you might be able to run an alternative GDB binary with a -py suffix, for example arm-none-eabi-gdb-py.
Register Handler
Copy the command below and paste it into GDB and hit enter. This will load a
handler which automatically posts data to Memfault whenever
memfault_data_export_dump_chunks is called.
memfault install_chunk_handler --verbose --project-key <YOUR_PROJECT_KEY>
memfault_data_export_dump_chunks() needs to be called by your port as part of
a CLI command or periodic task in order for the data to be extracted. For
example:
#include "memfault/components.h"

int export_data_cli_command(int argc, char *argv[]) {
  memfault_data_export_dump_chunks();
  return 0;
}

void some_periodic_task(void) {
  memfault_data_export_dump_chunks();
}
Try It Out!
Now, every time memfault_data_export_dump_chunks is called, the data passed as
a parameter to the function will automatically be posted to the Memfault cloud.
You don't have to do anything else! You will see logs print in the gdb CLI as
data is posted:
(gdb) Continuing.
Successfully posted 45 bytes of chunk data
Successfully posted 53 bytes of chunk data
[...]
Upload Symbol File
With ModusToolbox™ your projects symbol files can be found in the build/
directory, i.e.ModusToolbox
build/CY8CKIT-062S2-43012/Debug/your_application.elf
At this point, you should be able to generate test events and crashes and push the data to the Memfault UI.
You can confirm the error traces and crashes have arrived successfully by navigating to the "Issues" page- there should be a new issue with the "Symbols Missing" label:
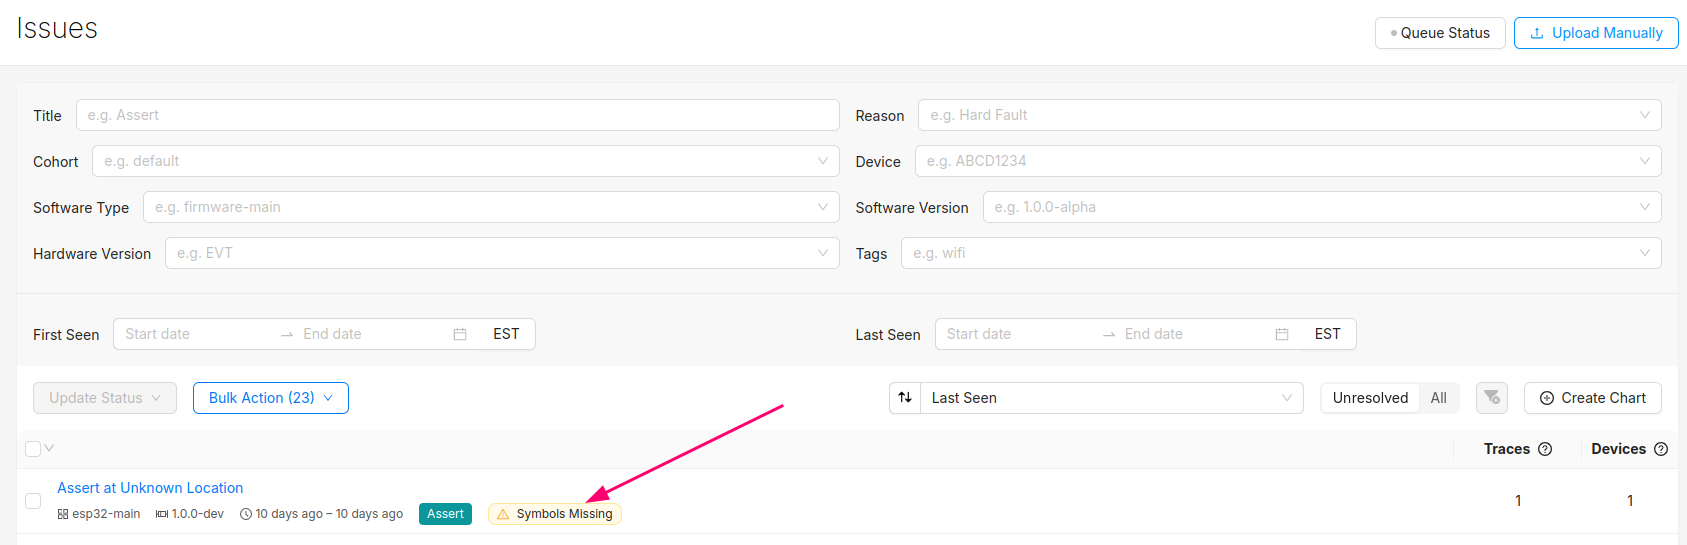
Clicking into the Issue will show the trace and a message that the symbol file is missing. It can be uploaded by clicking the button highlighted below:
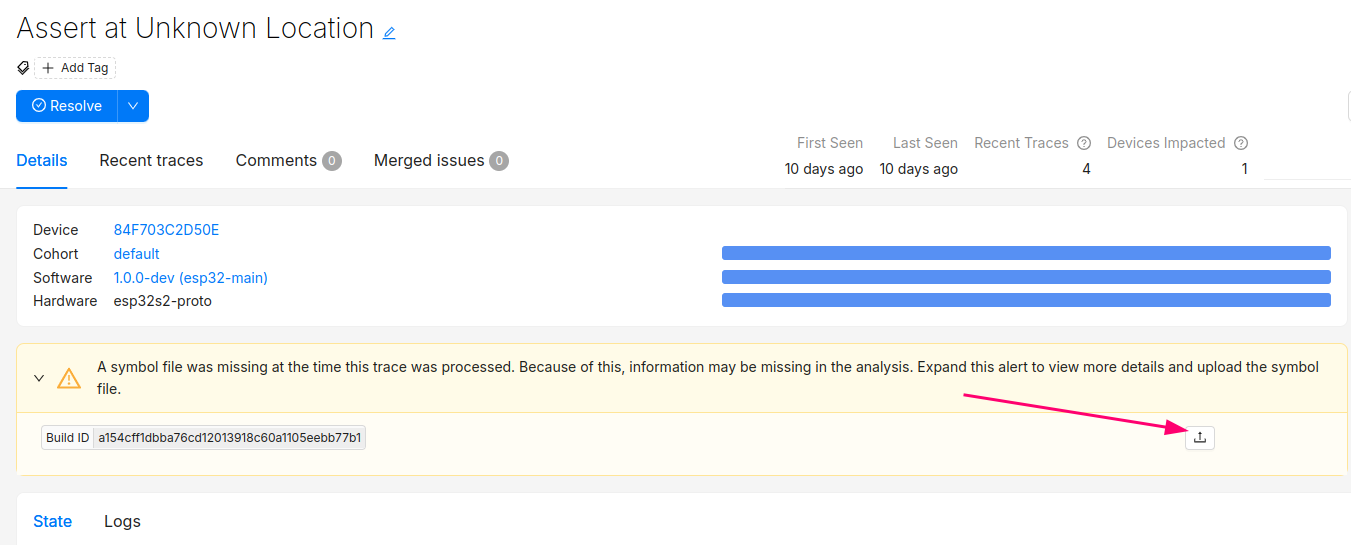
After this step, you will see the processed trace in the list of issues!
The Issue created when the symbol file is missing can now be set to resolved. It's good practice to always upload a symbol file before devices send any data.
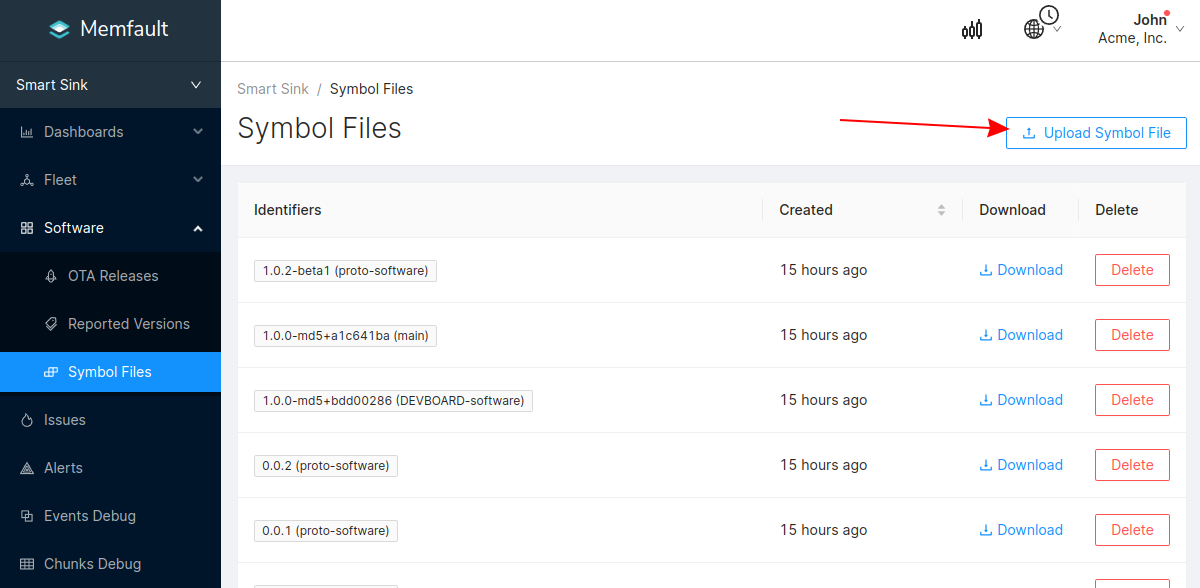
Symbol files can also be uploaded from the Software → Symbol Files tab (follow this deep link to be brought to the symbol file upload point in the UI):
In addition to supporting decoding trace/coredump data, symbol files are also required for decoding Metrics.
You can programmatically upload symbol files with the Memfault CLI tool.
Symbol files should be uploaded to Memfault before devices send any data, to ensure all device data can be decoded.
Troubleshooting Data Transfer
If you encounter any issues in your data transfer implementation, Memfault has tools to help debug!
- To troubleshoot data not getting uploaded or processed correctly by the Memfault cloud, take a look at the Integration Hub → Processing Log view. This provides a filterable, chronological view of recent errors that have occurred while processing received data. See this documentation page for more information on the Integration Hub.
- A view you can use toview the raw "Chunk" data payloadsthat have arrived for your project.
- Precanned Data Payloads you can pass through your `user_transport_send_chunk_data()` implementation to test data transfer in isolation.
- Server-side rate limiting will apply to the device you're using to work on the integration process. Once you can see the device on the Memfault Web App, consider enabling Server-Side Developer Mode for it on the Memfault Web App to temporarily bypass these limits.
Data Transport Steps
With data collection verified locally, the final step is to push data automatically to the Memfault cloud for analysis! Check out the two options below for the one that matches your use case.
Using Wi-Fi Connection Manager (WCM) & HTTPS
If your project makes use of Wi-Fi, data can be posted directly to Memfault using HTTPS. To enable this functionality, make the following changes:
-
Register Memfault Root certificates with stack
#include "memfault/components.h"
// [...]

//! Load root certificates necessary for talking to Memfault servers
result = cy_tls_load_global_root_ca_certificates(MEMFAULT_ROOT_CERTS_PEM, sizeof(MEMFAULT_ROOT_CERTS_PEM) - 1);
if (result != CY_RSLT_SUCCESS) {
  MEMFAULT_LOG_ERROR("cy_tls_load_global_root_ca_certificates failed! rv=0x%x", (int)result);
} -
Add periodic call to post data using Memfault HTTP client
#include "memfault/components.h"
// [...]
memfault_http_client_post_chunk();
Post Data to Cloud via Other Transport
Extensive details about how data from the Memfault SDK makes it to the cloud can be found here. In short, the Memfault SDK packetizes data into "chunks" that must be pushed to the Memfault cloud via the chunk REST endpoint.
The Memfault SDK exposes an API that packetizes Memfault data into "chunks". These "chunks" need to be forwarded to the Memfault Cloud (either directly via HTTPs or indirectly via a gateway device such as a computer or mobile application)
If you cannot post data directly using HTTP, no problem at all. In fact, that is one of the most common configurations. In these setups, data can be proxied from the MCU to a device which can perform a HTTP request over transports such as UART, BLE, COAP, LoRa, Zigbee, etc). The size of a "chunk" is fully configurable and can be tuned to best match your transport requirements. All message re-assembly is dealt with by Memfault in the cloud.
#include "memfault/components.h"

bool try_send_memfault_data(void) {
  // buffer to copy chunk data into
  uint8_t buf[USER_CHUNK_SIZE];
  size_t buf_len = sizeof(buf);

  bool data_available = memfault_packetizer_get_chunk(buf, &buf_len);
  if (!data_available ) {
    return false; // no more data to send
  }

  // send payload collected to chunks endpoint
  user_transport_send_chunk_data(buf, buf_len);
  return true;
}

void send_memfault_data(void) {
  if (!memfault_packetizer_data_available()) {
    return false; // no new data to send
  }

  // [... user specific logic deciding when & how much data to send
  while (try_send_memfault_data()) { }
}