August 2023
New Data Aggregation for Metric Charts: Percentiles
Metric Charts now have a new data aggregation available for both chart rollup options (by Cohort or Software version, and Over Time). This aggregation is called "Percentiles" and will display the data set broken into the 1st, 5th, 50th, 95th and 99th percentiles. Displaying the metric data as percentiles makes it easier to understand the prevalence of behaviors (tracked as metrics) across your fleet.
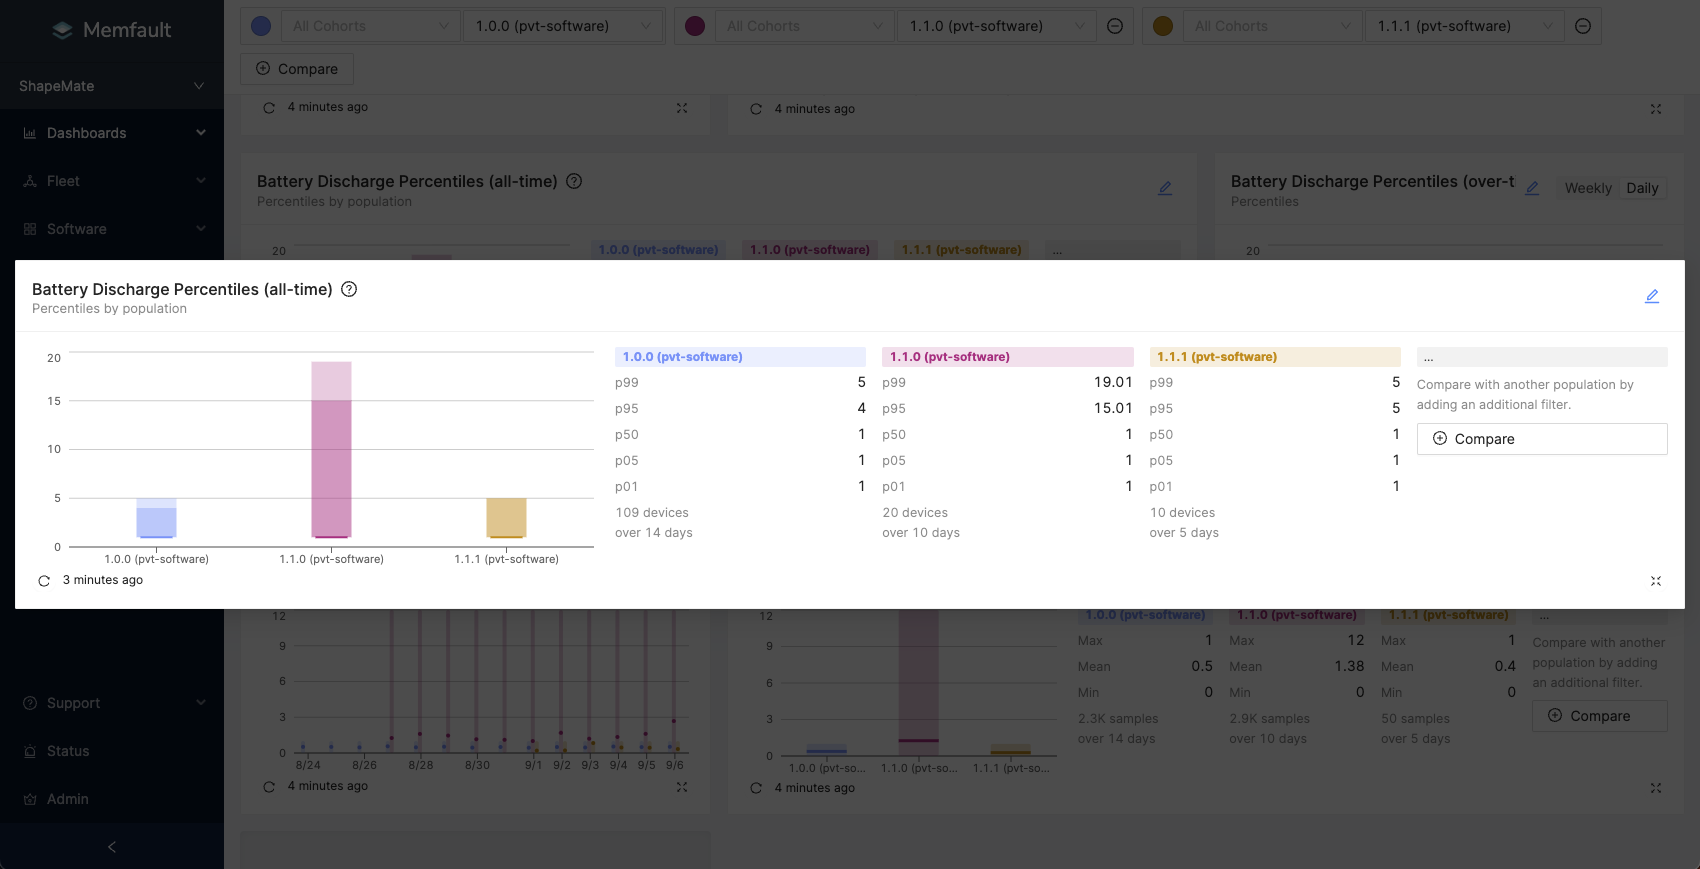
As an example, if you are seeing significant spikes in battery discharge rates for a specific software version you can use percentile aggregation to get a clearer picture of the scale of this problem. Are these undesirable metric readings I am receiving contained to a small set of samples or is this a wide scale problem? Conversely, this aggregation should also make it easier to understand what "normal" actually looks like across your fleet.
This new aggregation is the default view when creating any new metric chart. You can read more about this new data aggregation in our Metric Charts documentation.
Best Practices Guide for Android Battery Debugging
Our Developer Experience team have released a new guide designed to help users get the most from Memfault when identifying and debugging battery issue on Android devices. This guide provides detail on:
- What data the Android SDK can collect
- Using metric charts for tracking battery health/performance
- Setting fleet and device alerts
- Identifying problem devices
- Debugging individual devices using Device Timeline
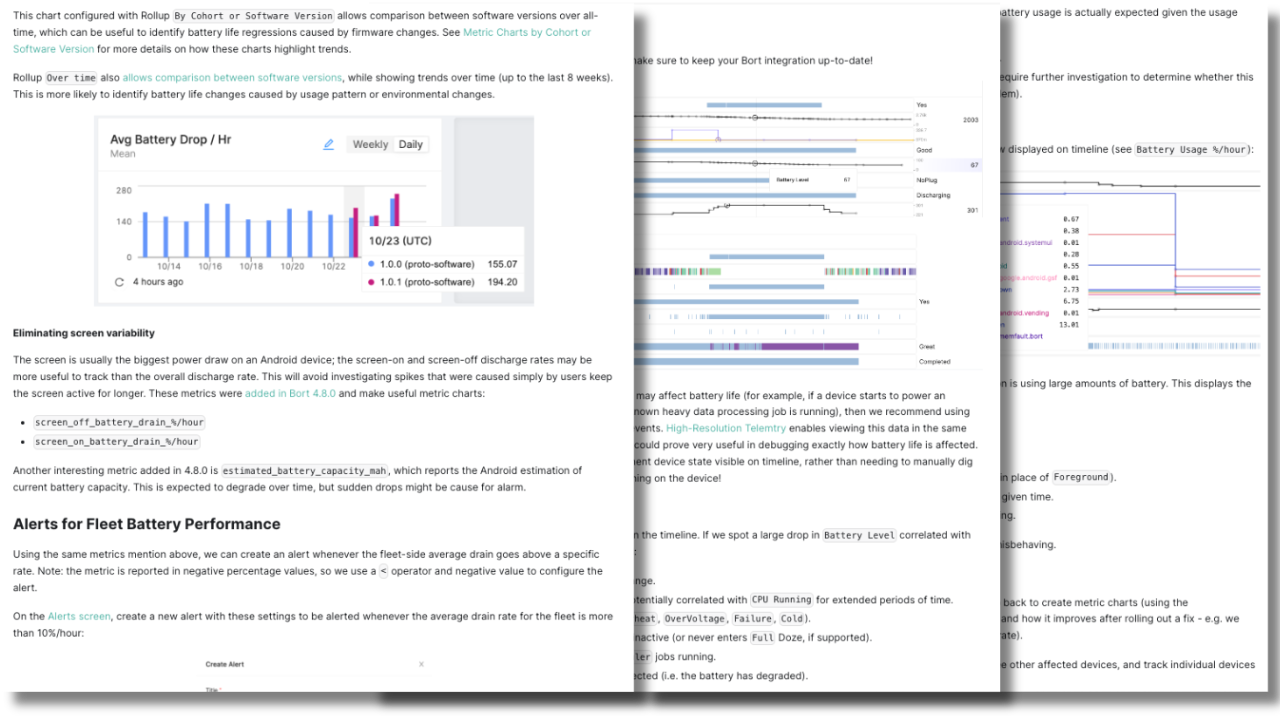
The guide takes into account the recently released set of updates to our Android SDK with version 4.8.0 which included the addition of new battery usage metrics such as per app battery usage.
You can read the full guide in the Memfault Best Practices for Android Battery Debugging.
General
- Added: New percentile aggregation option for metric charts (documentation)
- Added: Support for IPv6 on all Memfault hosted services except the marketing site on memfault.com and uploads to Memfault S3 buckets
- Added: Support for processing and creating issues from .xed/.xcd files that contain "Mini Coredump" events from the Qualcomm AppsP0 subsystem
- Added: Copy button in the stack trace threads view to copy function names to the user's clipboard
- Added: Documentation on how to merge issues in bulk
- Added: Support for IAR + C++ symbol files
- Added: Optional mode for trace analysis with Qualcomm chipsets to allow the OOM Classifier to fall back to the next largest known allocation site and add an analysis note if the call-site for the largest allocation is unknown
- Improved: Various UI glitches and improvements (dynamic font sizing for
metrics legend items in the timeline tab, better label for selecting all data
in a table, prevent async device search errors on page load, change label to
Frame Typein the stacktrace view, better no data state for charts, more consistent formatting in the memory regions panel, adding a count badge to the Merged Issues tab name, better error message for SSO login failures) - Improved: Documentation on
how to deduplicate events with
MEMFAULT_TRACE_EVENT_*macros and clarified thatstring_keyfor metrics is case-insensitive - Improved: Performance for searching across large symbol files for Globals & Statics
- Improved: The dashboard reboots chart now keeps stable color order for reboot reasons across daily & weekly breakdowns
- Fixed: If a device does not send a
captured_date, we set it to thereceived_dateinstead of a timestamp later in our system processing - Fixed: Enable the hex viewer to load very large sections in the browser without crashing, working around an HTML specification limit for element size
- Fixed: Software version inputs now allow slashes in the text field
- Changed: The device page now defaults to the timeline view for all device types. The MCU metrics tab is now removed
MCU
- Added: Documentation on how to capture the required RTOS thread state variables for analysis
- SDK versions
1.1.3
&
1.2.0
were released. Some highlights:
- Added: an optional mode for Zephyr to create and open the HTTP socket in separate function calls, if the user needs to set additional socket options before connecting. Fixes #52 - thanks to @anicare-tero for posting this 🎉
- Added: A demo CLI component for the Silicon Labs emblib port. Check out our Simplicity Studio example app for usage
- Improved: Support using a different identifier for the GNU Build ID symbol.
Use the
MEMFAULT_GNU_BUILD_ID_SYMBOLdefined inmemfault_platform_config.hto override the default. Thanks to @JordanYates for posting this change in #60 🎉 - Fixed: Bugs and warnings involving older Zephyr header paths. Resolves #62 and #57. Thanks @JordanYates and @YHusain1 for reporting these issues
Android
- Added: New best practices document for debugging Android battery life issues
- We did not publish a new version of the Android SDK in August.
Linux
- Improved: Documentation on
why it's recommended to source the Yocto build environment script
(
bitbakeis required to upload the symbols) - We did not publish a new version of the Linux SDK in August.
CLI
- We did not publish a new version of the memfault-cli in August.