May 2026
Highlights
MCP Server
The new Memfault MCP (Model Context Protocol) server lets MCP-compatible AI assistants like Claude Desktop, Claude Code, Cursor, VS Code, and others connect directly to your projects and query fleet data on your behalf. Authenticate once via OAuth, and empower your assistant's reasoning with read-only access to Issues, Traces, Device info, Metrics, and Software Version stats. See the MCP Server documentation to get started.
Location Services in the Platform
Location Services - A step-by-step onboarding wizard guides users through the setup process. Location Services provide
SCELL, MCELL, and Wi-Fi positioning. Location Services are now available for all Memfault users.
To learn more check out the Location Services docs.
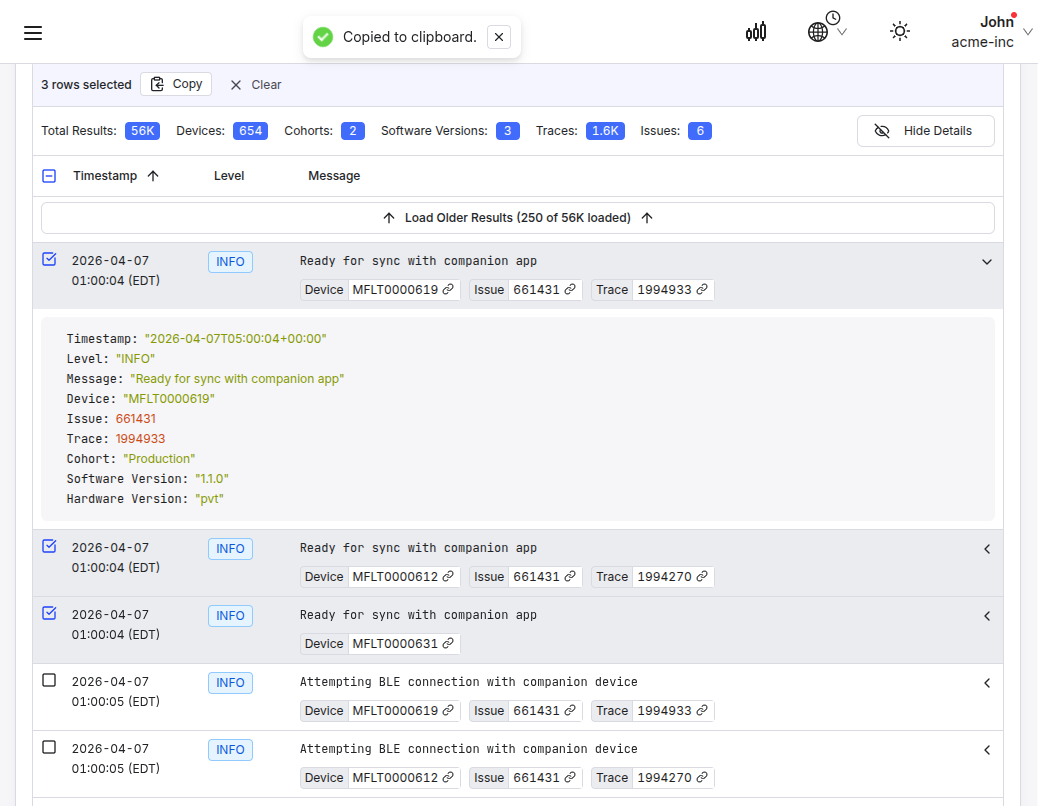
Reports: Expand All
The Reports view now has an Expand All / Collapse All button at the top of the list, making it easy to review all entries at once instead of clicking into each row individually.
The video above demonstrates the Expand All / Collapse All button toggling all report rows open and closed at once.