Trace Events
We recommend capturing a full coredump trace in case the system encounters a fatal problem, like a hard fault or a failed assertion. However, in some cases it may not be desirable or possible to do so. For example, if stopping & rebooting the system is not an option, or if the error is recoverable but you would still like to understand how often it happens.
The Trace Event module within the SDK makes it easy to track errors in a way that requires less storage than full coredump traces and also allows the system to keep running after capturing the event. Only the program counter, return address and a custom "reason" are saved. Once uploaded to Memfault, each Trace Event will be associated with an Issue just like a coredump.
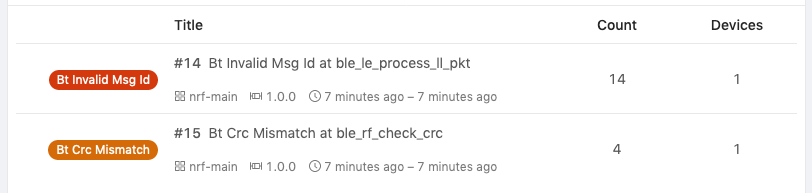
Here's an example where Trace Events are captured for Bluetooth protocol CRC errors and invalid message IDs:
This guide assumes you have already completed the minimal integration of the Memfault SDK. If you have not, please complete the appropriate Getting Started guide.
Defining Custom Trace Reasons
Aside from the program counter and return address, a Trace Event also contains a
user-defined "error reason". The list of custom reasons is defined in a separate
configuration file named memfault_trace_reason_user_config.def which you need
to create.
To start, we recommend adding a "test" trace error reason you can easily trigger (i.e via a CLI command) and a couple for error paths in your codebase (such as peripheral bus read/write failures, transport errors and unexpected timeouts).
Here is what the memfault_trace_reason_user_config.def file should look like:
// memfault_trace_reason_user_config.def
MEMFAULT_TRACE_REASON_DEFINE(test)
MEMFAULT_TRACE_REASON_DEFINE(your_custom_error_reason_1)
MEMFAULT_TRACE_REASON_DEFINE(your_custom_error_reason_2)
// ...
Adding Trace Events
Next, we'll need to use the MEMFAULT_TRACE_EVENT_* macros to capture trace
events when errors occur.
Note that it is perfectly fine to use the same reason in different places if that makes sense in the context of your code. Because the program counter and return address are captured in the Trace Event, you will be able to see the 2 topmost frames (function name, source file and line) in Memfault's Issue UI and distinguish between the different call sites.
For test purposes, you can add a CLI command that logs Trace Events using different methods:
#include "memfault/components.h"
// [ ...]
void test_trace_event_cli_cmd(void) {
    // Examples of the different flavors of Trace Events

    // 1. basic Trace Event- call site information and Trace Event Reason code
    MEMFAULT_TRACE_EVENT(test);

    // 2. Trace Event with a status code (i.e error code returned from stack)
    // to manually group events.
    MEMFAULT_TRACE_EVENT_WITH_STATUS(test, 0xdeadbeef);

    // 3. Trace Event with a log of arbitrary data
    MEMFAULT_TRACE_EVENT_WITH_LOG(test, "A Trace Event with log %d", 1);
}
You can also start to add Trace Events for error paths:
#include "memfault/core/trace_event.h"
// [ ...]
void ble_le_process_ll_pkt(...) {
  // ...
  if (invalid_msg_id) {
    MEMFAULT_TRACE_EVENT(bt_invalid_msg_id);
    // ...
  }
  // ..
}
For details on the Trace Event macros, see the header file.
Trace Event Variants
As shown above, there are 3 different types of Trace Events available.
MEMFAULT_TRACE_EVENT(reason)- a Trace Event with just a custom Trace ReasonMEMFAULT_TRACE_EVENT_WITH_STATUS(reason, status_code)- a Trace Event with a custom Trace Reason and arbitrary user data valueMEMFAULT_TRACE_EVENT_WITH_LOG(reason, format, args)- a Trace Event with aprintf-like format for the log string. The formatter will use Compact Logs if enabled and supported on the platform).
Trace Events, like Coredumps, are grouped together so that similar Trace Events are associated with the same Issue.
MEMFAULT_TRACE_EVENTevents with the same Reason and backtrace will be grouped together.MEMFAULT_TRACE_EVENT_WITH_STATUSevents with the same Reason, the same Status code, and the same backtrace are grouped together.MEMFAULT_TRACE_EVENT_WITH_LOGwith the same Reason and backtrace will be grouped together. The log is not used for grouping.MEMFAULT_TRACE_EVENTandMEMFAULT_TRACE_EVENT_WITH_LOGevents may be grouped together if their reason and backtrace are the same, regardless of the log.
It is recommended to use MEMFAULT_TRACE_EVENT_WITH_STATUS() to explicitly
group events (with the same Reason and backtrace) together if every different
status code represents a different issue. Otherwise prefer
MEMFAULT_TRACE_EVENT_WITH_LOG() if the only desire is to add more information
to the Trace Event.
Recording Trace Events from Interrupts
It is also safe to use the MEMFAULT_TRACE_EVENT() macro from an interrupt.
When called from an interrupt, the Trace Event info will be copied to a
temporary storage region in RAM to minimize interrupt latency. The collected
data can then be serialized to event storage by explicitly calling
memfault_trace_event_try_flush_isr_event(). The data will also be flushed
automatically anytime MEMFAULT_TRACE_EVENT() is called and the processor is
not in an interrupt.
Timestamping Trace Events
For devices that have an onboard source of time (RTC or GNSS receiver, etc), it can be useful to add a timestamp to Trace Events. This will set a "recorded time" value on the Trace Event when it's decoded by Memfault's server, and the Trace Event reports will show accordingly in the device's timeline.
A detailed description can be found in the Event Timestamps documentation page.
UI Rendering
When rendered in the Memfault UI, the Trace Event reason is split on _, and
the component words are capitalized. For example:
my_custom_trace_reasonwill be displayed asMy Custom Trace Reasonmycustomtracereasonwill be displayed asMycustomtracereasonMyCustomTraceReasonwill be displayed asMyCustomTraceReason