December 2022
Fleet Sampling
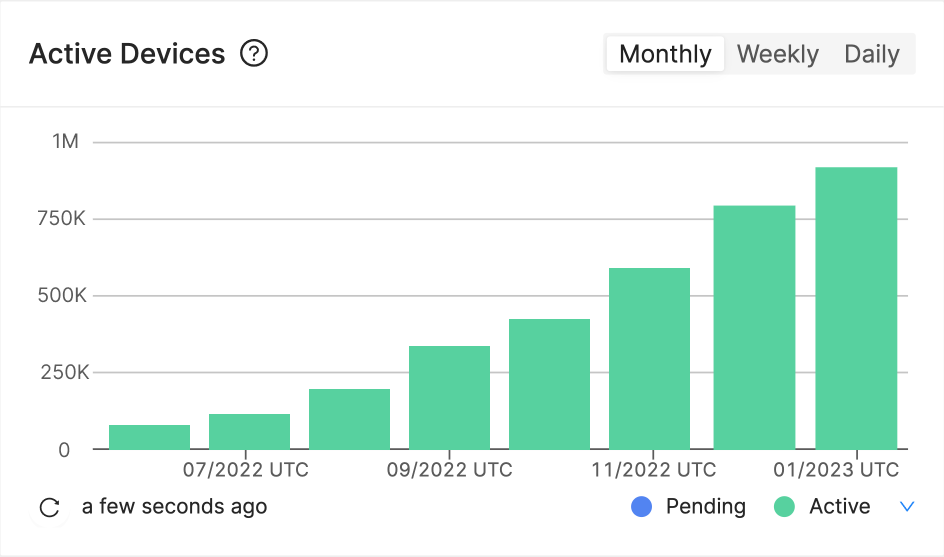
As your fleet grows, it becomes more costly to send, process and store the data from all devices in growing fleets. With the Fleet Sampling feature, Memfault helps manage the costs for your device data bandwidth by only collecting diagnostics and performance data from a smaller, yet statistically significant, subset of a fleet that you can control at any time.

Thanks to Chart Normalization, all insights to understand issues occurring across your fleet will still be at your disposal even when a only smaller number of devices are reporting from the field. For more information, please refer to the Fleet Sampling documentation.
Best Practices: Low-Bandwidth Devices
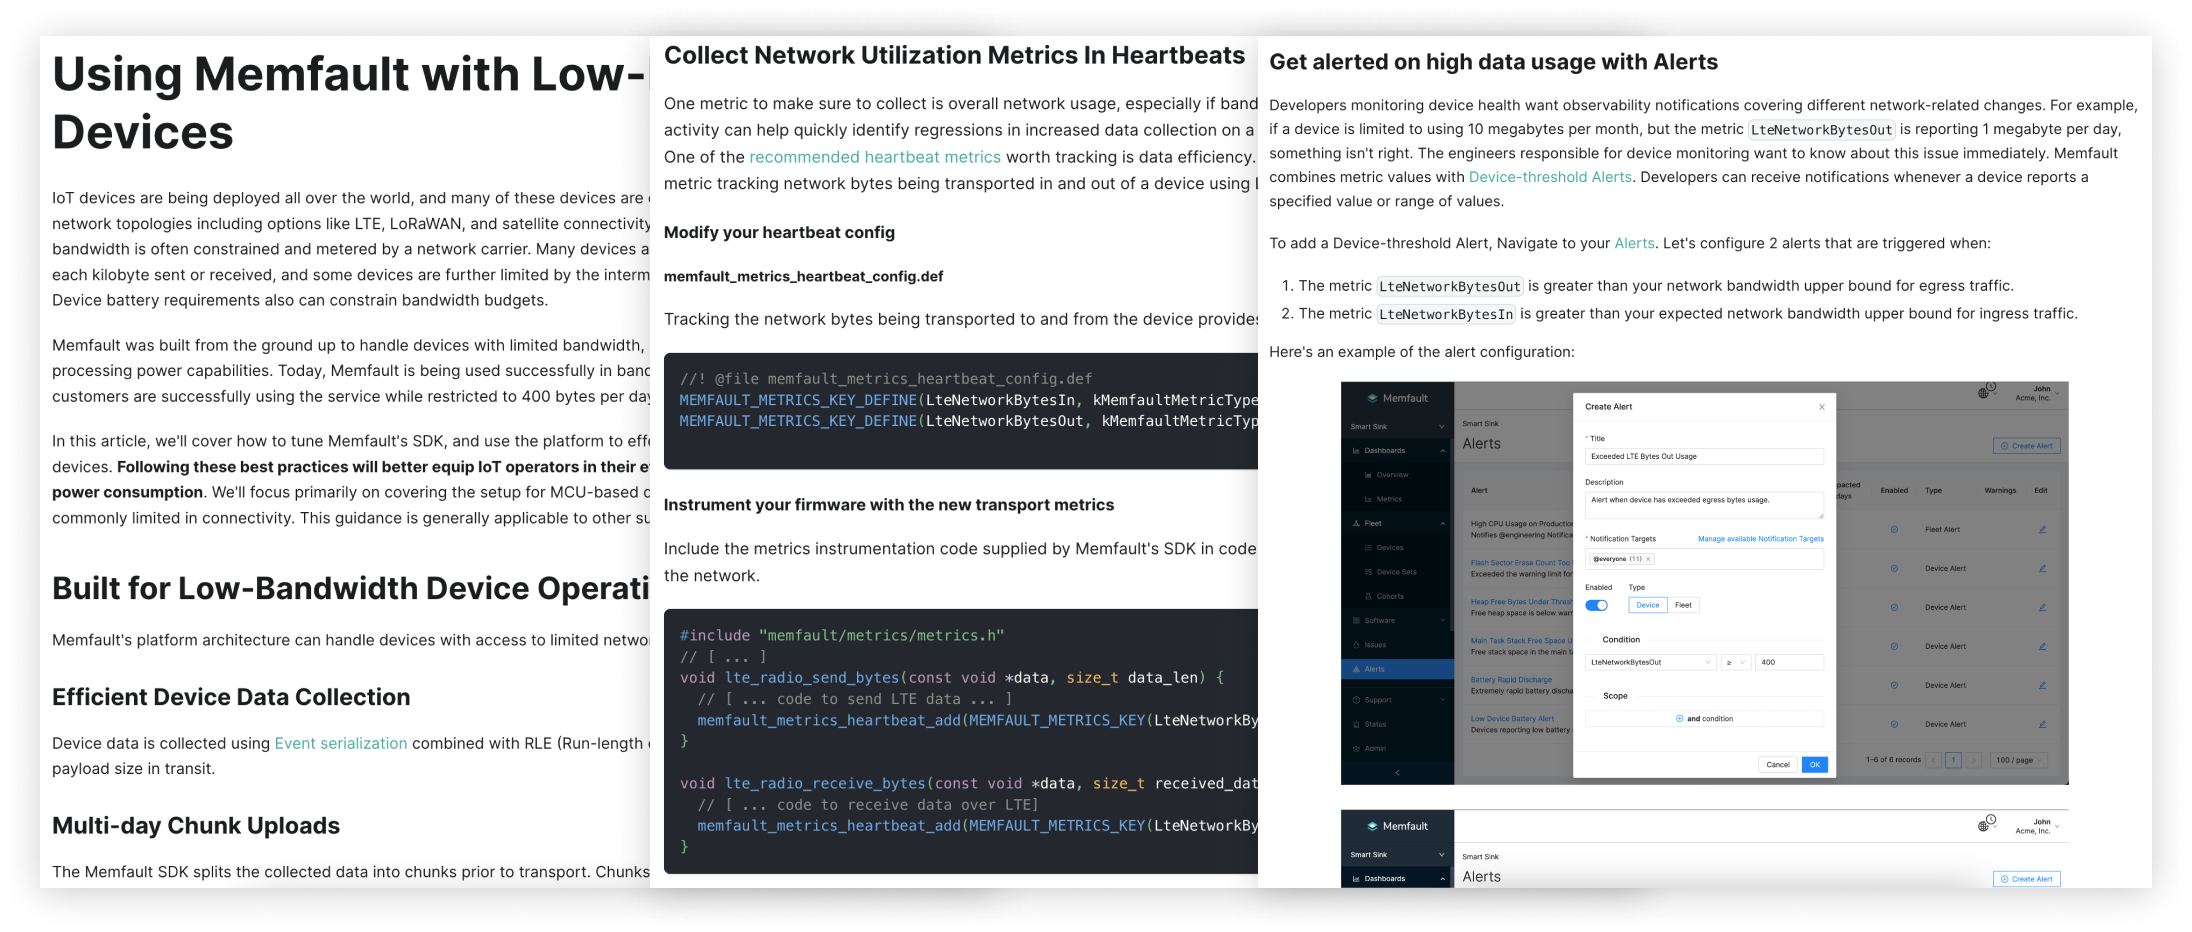
Memfault was built from the ground up to handle devices with limited bandwidth, intermittent connectivity, and minimal processing power capabilities. Following the guidelines and code examples in the recently published Using Memfault with Low-Bandwidth Devices article, IoT operators can save on network costs and lower the power consumption of their devices.

General
- Added: Documentation on best practices when using Memfault with low-bandwidth devices
- Added: Documentation of Fleet Sampling feature
- Added: UI feedback under Issue Details page in the case of malformed log data
- Improved: Various UI glitches and improvements (Improved error messages when Fleet Sampling quotas are reached, device serial is invalid or Symbol File is missing, matching the bar colors of Reboot Reasons chart with the colors of the labels in the legend)
- Improved: Displaying Trace title instead of the Issue title under Issue Details page as they may differ
- Improved: Re-processing logic works on viewed trace instead of the most recent trace
- Fixed: Glitches when processing Qualcomm crash reports (Certain crash reports not getting processed, error when uploading a report with no events, filtering out events containing only a few small memory regions)
- Fixed: Aborting a staged OTA rollout for large fleets could fail
- Fixed: Metric search in Device Timeline not returning any results
- Fixed: Incorrect parsing of negative metric ranges
- Fixed: Possible timeouts/performance issues when uploading symbol files in projects with a large number of software versions
- Fixed: Broken formatting of Slack notifications for Device Alerts when the alert had a special character in its title
- Fixed: Normalized Metric and Issue charts showing data only for the past two weeks
- Changed: Showing Trace title instead of message under Issue Detail → Recent Traces
- Changed: Top & New Issues Charts no longer take Issues with no recent Traces into account
- Changed: Received Traces chart under Overview page no longer takes Traces with future dates into account
- Changed: Received Traces chart now only shows the data received and occurred within the last 14 days or 8 weeks, instead of received within the last 14 days and occurred over all time
MCU
- Fixed: Coredump processing failures due to corrupted log buffers
- SDK versions
0.36.0,
0.36.1
and
0.37.0
were released. Some highlights:
- Added: Support for just-released ESP-IDF v5 (Thanks @jlubawy for the patch)
- Added: Auto-OTA (and auto-Wi-Fi-join) feature to the ESP32 example app
- Added:
MemfaultSdkMetric_UnexpectedRebootDidOccurmetric for tracking crash-free hours
Android
- Added: Support for Device and Fleet level alerts
- Improved: Logcat processing failing when a row with a UTF-8 encoding issue encountered
- We did not publish a new version of the Android Bort AOSP SDK in December.
Linux
- Changed: Filtering out Traces with archived software versions under Issues page
- SDK version
1.2.0
was released. Some highlights:
- Added:
New
memfaultctlcommand to interact withmemfaultd - Added: Developer Mode to reduce rate limits applied to coredump uploads during development
- Added: Support for running the Docker container on Apple silicon without Rosetta emulation
- Improved: Coredump compression with gzip to reduce storage and network usage
- Fixed:
swupdategetting into a bad state after reloadingmemfaultd - Changed:
memfaultd --(enable|disable)-dev-collectionandmemfaultctl -sare now replaced by equivalent commands onmemfaultctland will be removed in a future version
- Added:
New
CLI
- We did not publish a new version of the memfault-cli in December.