Introduction
Memfault is a complete device monitoring solution integrating into any embedded device utilizing ARM Cortex-M, ARM Cortex-R, or ESP32 MCUs, running bare-metal or an RTOS, and using any data path.
The typical compiled SDK size is 5KB of flash and requires 1.5KB of RAM. It is highly configurable so that it can work in more constrained environments.
How does it work?
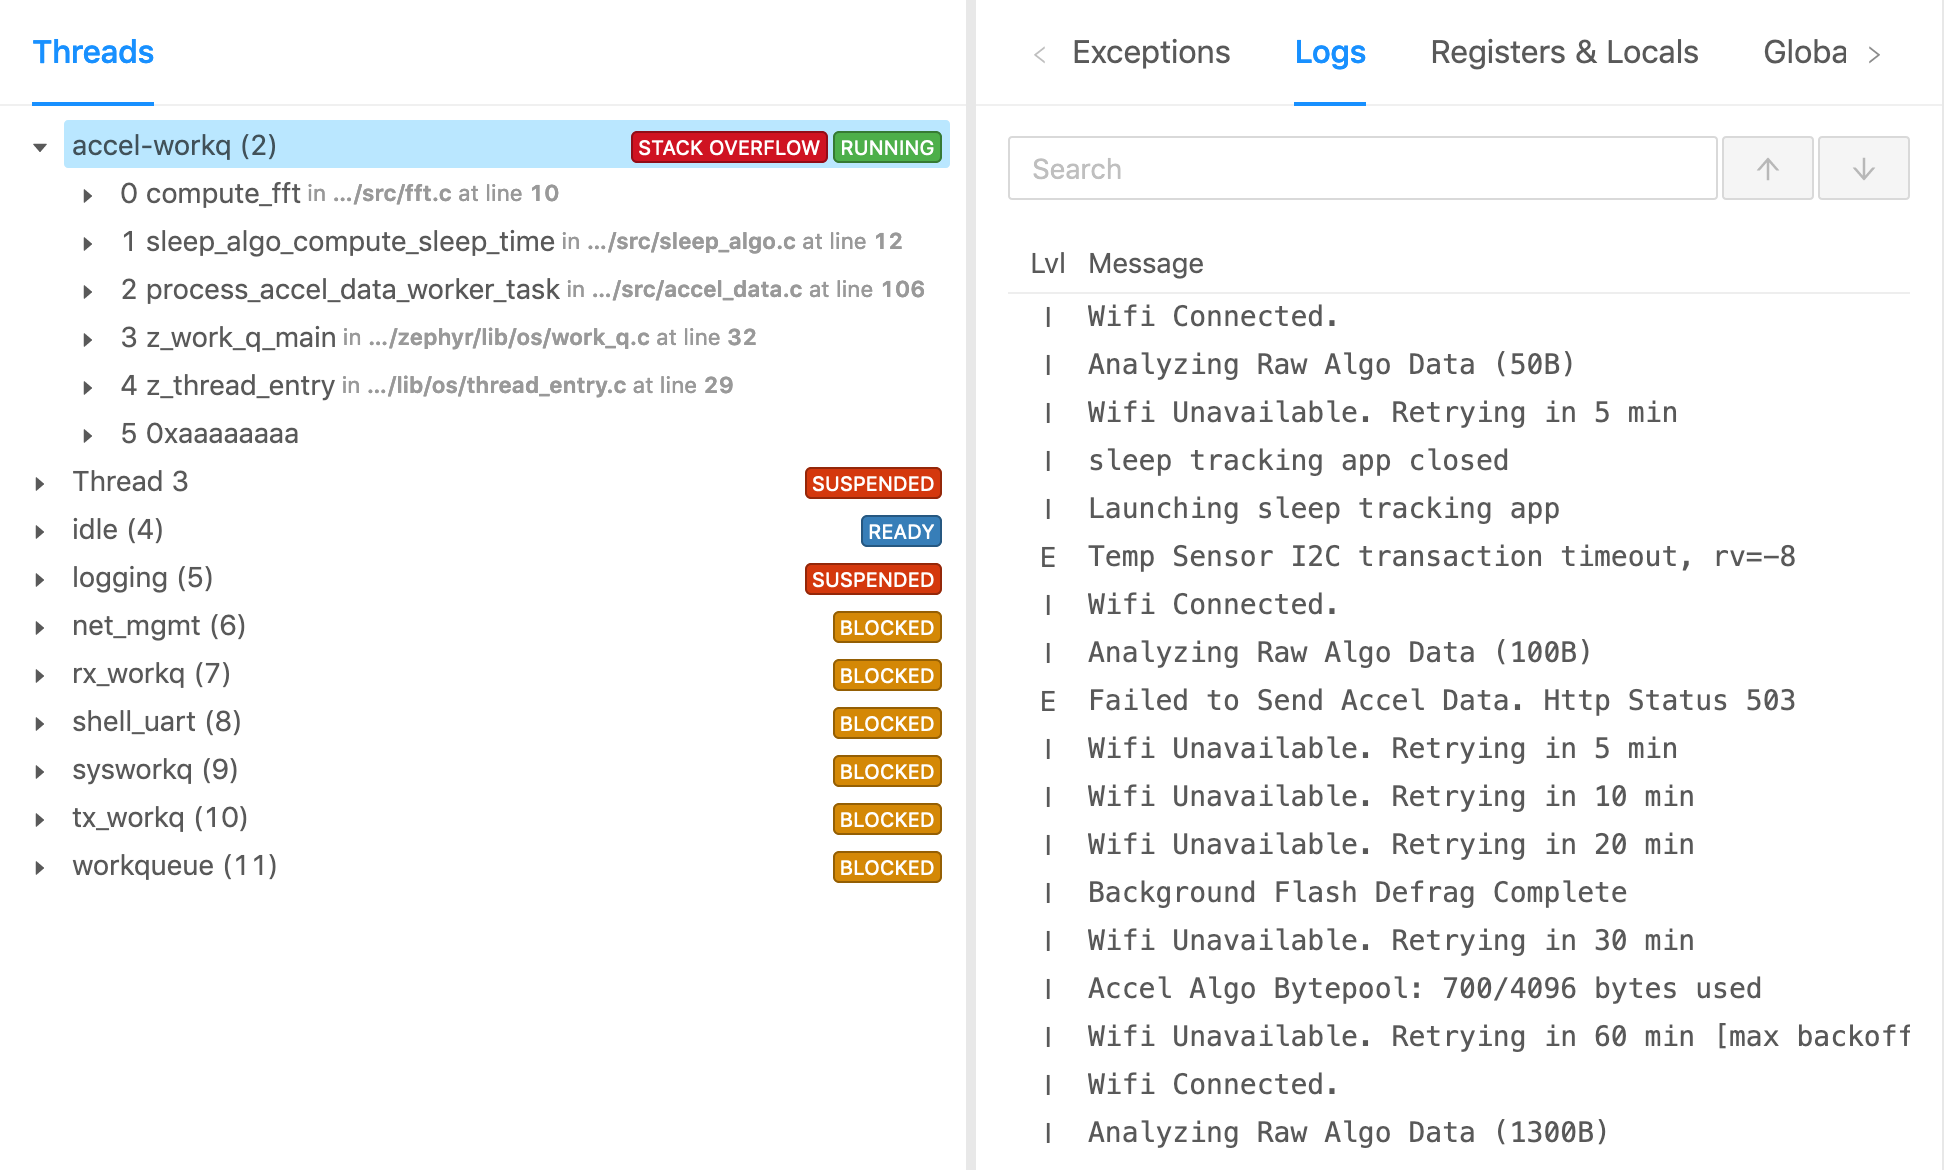
- The Memfault Firmware SDK collects device coredumps (including backtraces, fault registers, etc.), logs, reboot reasons, and metrics.
- The SDK forms collected data into packets, called chunks, as small as 9 bytes to be sent over whatever transport you use (e.g., Bluetooth, LTE, Wi-Fi, LoRa, Zigbee, or proprietary protocols).
- The Memfault cloud reassembles data structures from received chunks and analyzes the contents. Memfault produces traces, metric readings, and other data from these chunks to associate with individual devices and aggregate across your fleet.
- Memfault groups traces together into issues and sends notifications when problems are detected. Memfault offers powerful ways to drill into issues and dashboards to examine fleet health.
Adding the Memfault Firmware SDK to your device will provide rich diagnostics, including:
Coredump Collection
Device Metrics
Reboot Reason Tracking
Error Tracking with Trace Events
Getting Started
The Memfault Firmware SDK is designed as a collection of components, so you can include only what is needed for your project.
Integration Guides
We have step-by-step guides which cover how to add the SDK to a project, capture an error, and publish data to the Memfault cloud:
The following assumes you already have a Memfault account. If you don't yet have an account, reach out to us!
| MCU Architecture | Getting Started Guide |
|---|---|
| ARM Cortex-M | ARM Cortex-M Integration Guide |
| nRF Connect SDK | nRF Connect SDK Integration Guide |
| ESP32 ESP-IDF (Xtensa and RISC-V) | ESP32 ESP-IDF Integration Guide |
| ESP8266 | ESP8266 RTOS Integration Guide |
| Dialog DA1469x | DA1469x Integration Guide |
| NXP MCUXpresso RT1060 | NXP MCUXpresso SDK for i.MX RT Guide |
| Zephyr RTOS | Zephyr Integration Guide |
| ARM Cortex-R | ARM Cortex-R Integration Guide |
Modules
Once the memfault-firmware-sdk is in place, a number of modules can easily be integrated into the system:
- Coredumps - Allows one to collect the system state when the device hangs, crashes or asserts unexpectedly.
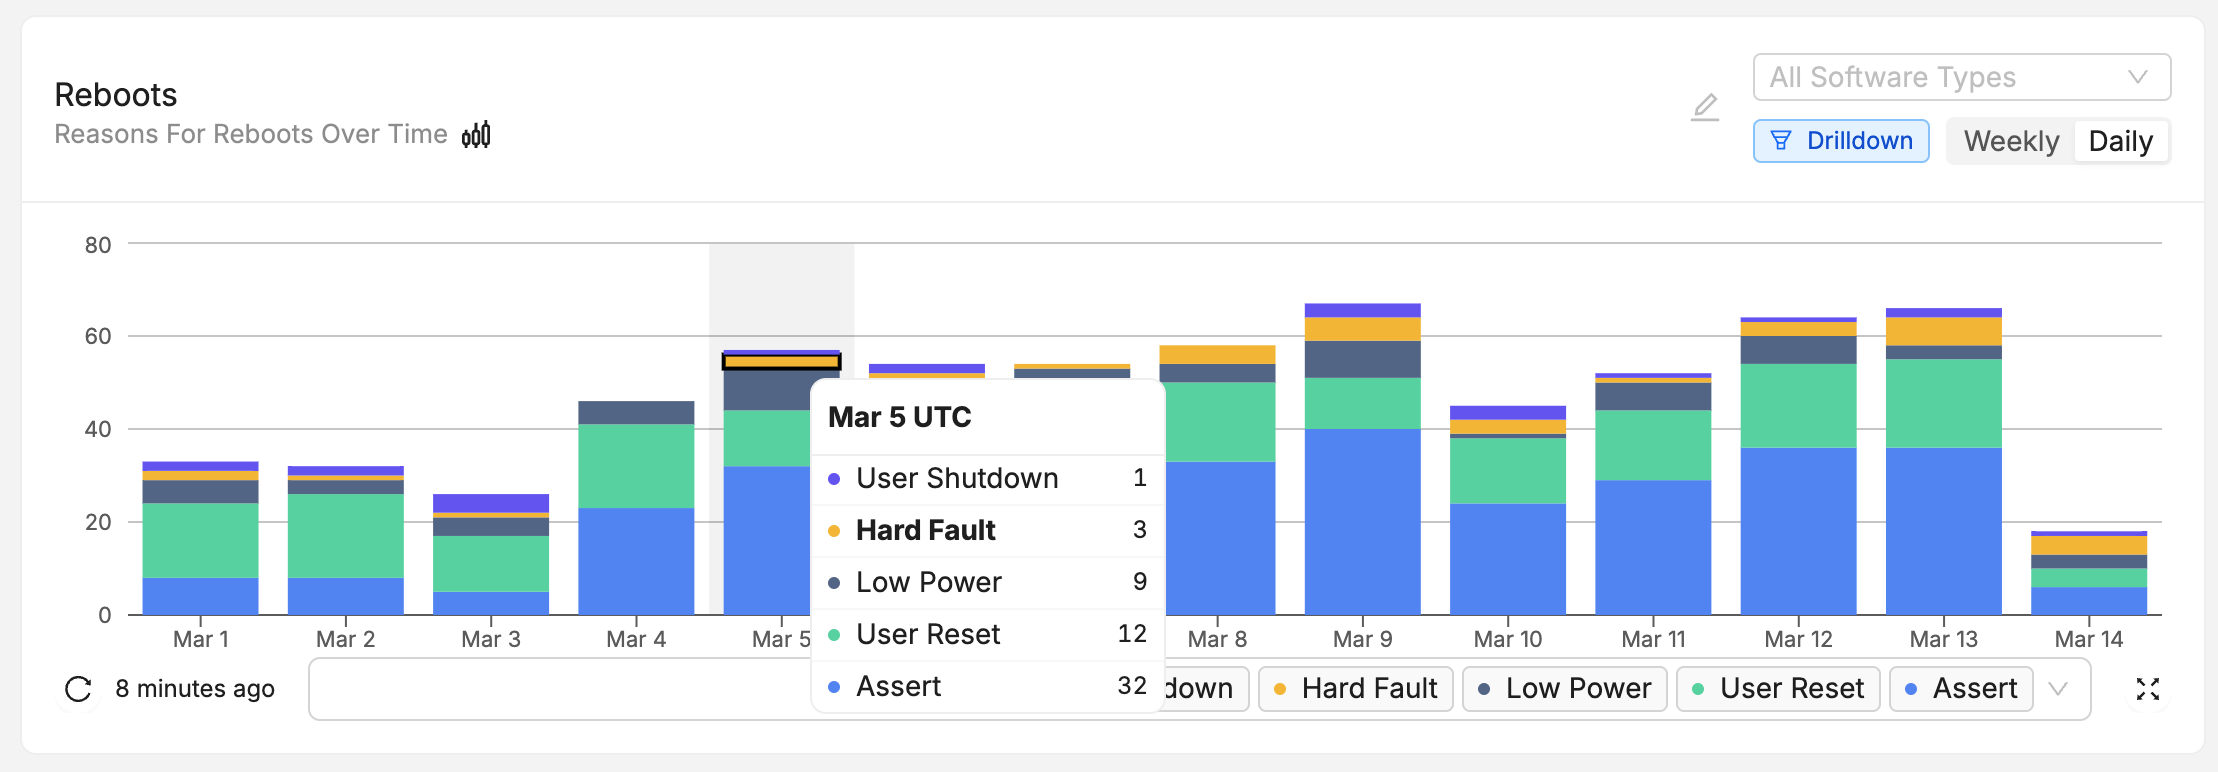
- Reboot Reasons - allows one to collect why devices are rebooting in the field (whether it be due to a crash, brownout or a firmware update). Summaries and aggregates can then be viewed from the Memfault web application.
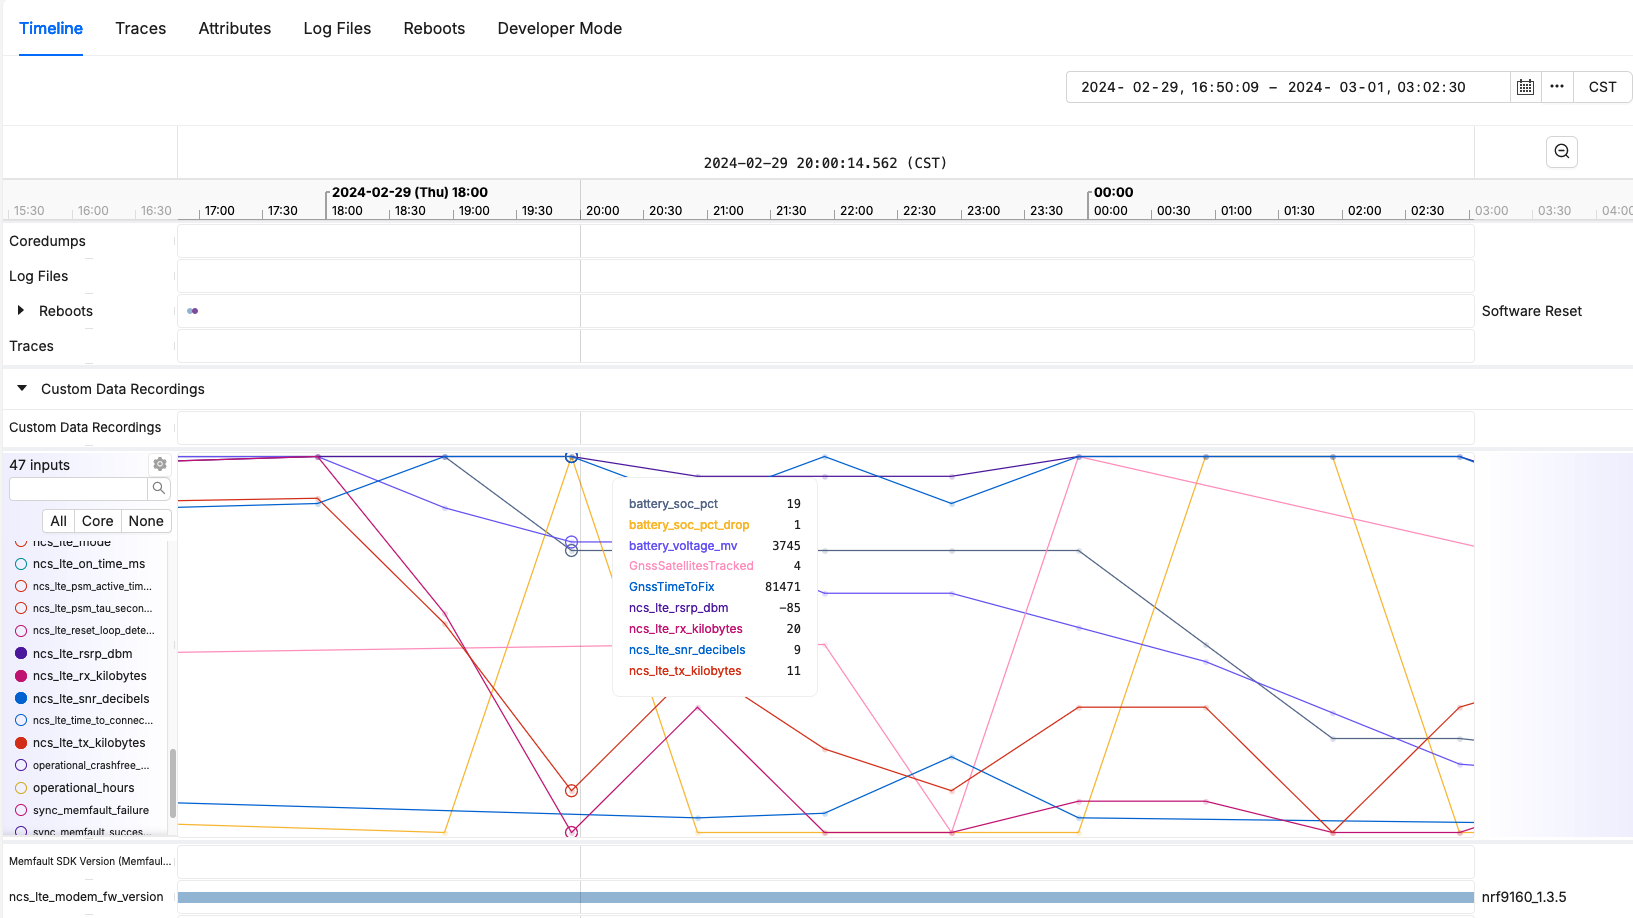
- Device Metrics - A flexible way to collect system health vitals that are important to your application (whether it be battery life, connectivity statistics, performance measurements or something else!). From the Memfault web application, metrics are plotted over time for any device and fleet wide summaries can be viewed via dashboards.
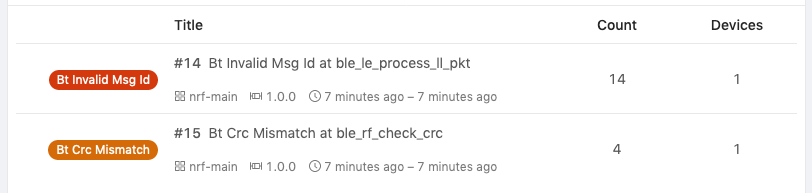
- Trace Events - allows one to collect lightweight events (<40 bytes) when error conditions occur. These events can be collected while the system is running and can be used to discover how often unexpected errors are occurring (flash write failures, I2C bus timeouts, etc).
Design Documents
The Memfault data collection system was designed from the ground up with embedded devices in mind. Deeper explorations into the designs of the subsystems can be found below:
- Event Serialization - Describes how Memfault event serialization was optimized for embedded applications and how it compares against other serialization strategies.
- Data Transport - Examines how data is shuttled from the device to the cloud
Example Projects
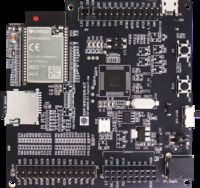
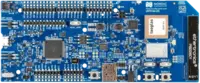
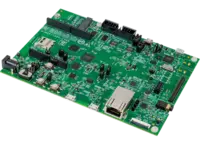
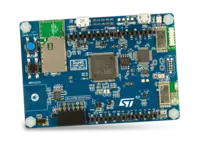
We provide fully functional example projects for specific development boards. These examples can be used as a quick way to try out Memfault without needing to modify an existing project.
| Board | Thumbnail | Example Project |
|---|---|---|
Note:other ESP32 boards should work similarly |
| From the Memfault SDK: |
| Nordic maintains an example app included with the nRF Connect SDK: The Memfault SDK includes a basic example: | |
Note: other NXP RT10xx boards should be nearly compatible with the example application source, but will require a different MCUXpresso SDK for hardware support |
| Note: a detailed integration guide can be found here |
| From the Memfault SDK: | |
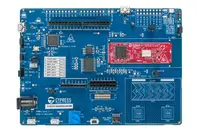
PSoC™ 64 Standard Secure - AWS Wi-Fi BT Pioneer Kit (CY8CKIT-064S0S2-4343W) |
| From the Memfault SDK: |
| Detailed integration guide: Example project: | |
| From the Memfault SDK: | |
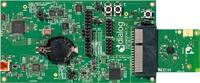
Dialog SmartBond™ DA14695 Bluetooth® Low Energy 5.2 USB Development Kit |
| Detailed integration guide: From the Memfault SDK: |