Espressif ESP32 ESP-IDF Integration Guide
This tutorial will go over integrating the Memfault Firmware SDK into a system that is using Espressif's ESP-IDF for an ESP32 chip. It assumes you already have a working project/toolchain for the ESP32. If you do not, the official getting started guide is a great resource!
This integration is tested on the ESP32-WROVER-KIT V4.1 and several other variants (including ESP32-S3, ESP32-C3, and ESP32-C6 variants, among others), but applies similarly to any ESP32-based board.
An example project demonstrating the result of this integration can be found here, for reference:
https://github.com/memfault/esp32-standalone-example
Memfault also maintains a full demonstration project in the Memfault Firmware
SDK, under
examples/esp32
Supported ESP-IDF Versions
Memfault targets supporting new ESP-IDF releases as they arrive. If a version is not included below, please contact us and we'll let you know the status!
- ✅ >= v4.4.0, <= v5.4 tested and supported
Integration Checklist
Follow these steps to integrate the Memfault Firmware SDK into an ESP-IDF project:
- 1. Add the Memfault SDK
- 2. Enable Coredump Collection in
sdkconfig - 3. Create a Coredump Flash Partition
- 4. (Optional) Implement
memfault_platform_get_device_info() - 5. Initializing Memfault
- 6. Configure Memfault Project Key
- 7. Regenerate
sdkconfigand recompile
Detailed Walkthrough
1. Add the Memfault SDK
Add the Memfault ESP Component to your project using the IDF Component Manager:
idf.py add-dependency "memfault/memfault-firmware-sdk^1.12.0"
2. Enable Coredump Collection in sdkconfig
By default, the esp-idf uses the CONFIG_ESP32_ENABLE_COREDUMP_TO_NONE=y. You
will need to update sdkconfig (either via idf.py menuconfig or manually) to
CONFIG_ESP32_ENABLE_COREDUMP_TO_FLASH=y. The change you will see in the
sdkconfig file will look something like:
diff --git a/sdkconfig b/sdkconfig
index a49446d..83a81a8 100644
--- a/sdkconfig
+++ b/sdkconfig
@@ -274,7 +274,7 @@ CONFIG_ESP32_DEFAULT_CPU_FREQ_MHZ=160
 CONFIG_TRACEMEM_RESERVE_DRAM=0x0
 # CONFIG_ESP32_ENABLE_COREDUMP_TO_FLASH is not set
 # CONFIG_ESP32_ENABLE_COREDUMP_TO_UART is not set
-CONFIG_ESP32_ENABLE_COREDUMP_TO_NONE=y
+CONFIG_ESP32_ENABLE_COREDUMP_TO_FLASH=y
This can also be done in sdkconfig.defaults if your project does not version
control the sdkconfig file (will require a fullclean build to take effect).
Note: The remainder of the COREDUMP settings, including
CONFIG_ESP_COREDUMP_DATA_FORMAT_ELF, do not affect the Memfault coredump. They
are specific to the ESP-IDF coredump features.
3. Create a Coredump Flash Partition
You will need to allocate an internal flash partition to store panic data. Edit
your partitions.csv file to add a coredump partition. If you do not have a
partitions.csv file you can create one from the template below and place it in
your top-level project directory where the sdkconfig file is located.
Depending on your chip's Flash size you may need to modify the storage
partition size in order to fit the coredump partition. Check the Flash chip
size in menuconfig, see (Top) → Serial flasher config and check the "Flash
Size" entry. Be sure to specify a custom partition file in the sdkconfig (see
note below).
Depending on what data is included in the coredump, the size of the coredump
partition might also need to be increased to a larger size, like 512K. The
memfault_coredump_storage_compute_size_required()
function in the Memfault SDK can be used to compute the maximum coredump size,
which can vary depending on user configuration.
Note that the default Memfault coredump regions are defined by the
memfault_platform_coredump_get_regions() function in the Memfault SDK's
ESP-IDF port:
ports/esp_idf/memfault/common/memfault_platform_coredump.c,
but can be adjusted to suit the user's needs, either via Kconfig options or by
implementing a separate memfault_platform_coredump_get_regions() to override
the built-in weakly defined one.
# Name,   Type, SubType, Offset,  Size,  Flags
nvs,      data, nvs,     0x9000,  0x6000,
phy_init, data, phy,     0xf000,  0x1000,
factory,  app,  factory, 0x10000, 1M,
storage,  data, fat,     ,        1M,
coredump, data, coredump,,        256K,
The coredump flash partition size must be aligned to 4096 bytes (4KB).
Be sure to indicate the actual name you chose for the partition file in the
sdkconfig file. This can be done easily by running idf.py menuconfig,
selecting (Top) → Partition Table, and setting the name of the "Custom
partition CSV file". Optionally, you can edit the sdkconfig file directly
(search for the variables prefixed with CONFIG_PARTITION_TABLE_):
CONFIG_PARTITION_TABLE_CUSTOM=y
CONFIG_PARTITION_TABLE_CUSTOM_FILENAME="partition-table.csv"
4. (Optional) Implement memfault_platform_get_device_info()
- Memfault SDK 1.4.0+
- Memfault SDK <1.4.0
As of Memfault Firmware SDK 1.4.0, the SDK provides a default implementation
of the memfault_platform_get_device_info() dependency function. This populates
the Memfault Device Info data with MAC address and some default version values.
This default implementation can be overridden using the Kconfig flag
CONFIG_MEMFAULT_DEFAULT_GET_DEVICE_INFO=n.
The port implementation memfault_esp_port_get_device_info() can also be used
in a custom implementation of memfault_platform_get_device_info() to override
the default values, if it's useful to do so.
When a panic occurs, information is collected to uniquely identify the device
and version of software running. Add an implementation of the function
memfault_platform_get_device_info() to your project (either to an existing c
file, or a new one that's included in the project CMakeLists.txt). The
memfault_platform_get_device_info() function sets the fields shown in the
returned sMemfaultDeviceInfo struct:
This needs to be safe to call from the exception handler so if you are reading
data from subsystems which uses locking, e.g. esp_efuse_*, you will need to
pre-populate the data on bootup, for example with a
memfault_platform_get_device_info_boot() function, called prior to
memfault_boot() on system startup
#include "memfault/core/platform/device_info.h"

void memfault_platform_get_device_info(sMemfaultDeviceInfo *info) {
  // !FIXME: Populate with platform device information
  //
  // *NOTE* All fields must be populated, and the values assigned to the fields
  // must have static lifetime: the data is accessed when this function returns.
  // In this example, the fields are string literals, which are placed either
  // inline into .text data tables, or in .rodata, and the pointers are valid
  // for the lifetime of the program
  //
  // See https://mflt.io/version-nomenclature for more context
  *info = (sMemfaultDeviceInfo) {
    // Set the device serial to a unique value.
    // It is typically set to a unique identifier like a serial number
    // or MAC address.
    // This is used to de-deduplicate data in Memfault cloud
    .device_serial = "DEMOSERIAL",
    // Set the device software type.
    // It can be simply "app" for a single-chip device, otherwise it
    // should match the component name, eg "ble", "sensor" etc.
    // This is used to filter devices in the Memfault UI
    .software_type = "app-main",
    // Set the device software version.
    // If using Memfault OTA, this should exactly match the OTA Release
    // Version name for the installed image
    .software_version = "1.0.0-dev",
    // Set the device hardware revision.
    // This is used to filter/group devices in the Memfault UI
    .hardware_version = "evt",
  };
}
For ESP32 devices, the base MAC address is an option for generating device
serial numbers for test purposes. It is accessible from the esp_read_mac()
function included from esp_mac.h. Do not use the other MAC address loading
functions until esp_read_mac has been called at least once, as they only
return the in memory copy of the MAC address while esp_read_mac properly
fetches it from flash if it has not been loaded yet.
See an example implementation in the Memfault SDK esp32 example, which can be copied into your project as a starting point.
Note: there is a non-zero chance of overlapping addresses from Espressif, so it is not recommended for large production fleets of devices. As many as 20 duplicates in a set of 4000 chips have been reported in ESP-IDF user forums.
5. Initializing Memfault
You will need to initialize the SDK from your application. This can be done
simply by adding a call to memfault_boot() from your main_app() during
system boot. We recommend doing this as early as possible in your initialization
process, so Memfault components can begin capturing data. Be sure to first
initialize any dependencies used by memfault_platform_get_device_info() as
this is called within memfault_boot.
Here's a code example:
#include "memfault/esp_port/core.h"

void app_main() {
  memfault_boot();

  // Remainder of your main task
}
6. Configure Memfault Project Key
The Project Key is set via a Kconfig variable, MEMFAULT_PROJECT_KEY.
In ESP-IDF this can be set in a few different places:
-
add a line to
sdkconfig.defaults:CONFIG_MEMFAULT_PROJECT_KEY="your-project-key" -
set it in
sdkconfig, either viaidf.py menuconfigor by directly editing the file -
set it into an extra sdkconfig file, for example
sdkconfig.memfault_project_key, and include the file when building:idf.py build -DSDKCONFIG_DEFAULTS="sdkconfig.defaults;sdkconfig.memfault_project_key"
7. Regenerate sdkconfig and recompile
Assuming that your project has already been built before adding Memfault you will need to rebuild now that the Memfault SDK has been integrated into your ESP-IDF project.
Note that below we recommend doing a fullclean build. This is not strictly
required, but can help pick up all the cmake changes. See
the ESP-IDF documentation
for details
idf.py fullclean
idf.py menuconfig  # Verify your settings if necessary
idf.py build
Testing things out
- With UART console
- No UART console
If you built a project with a UART console the Memfault ESP-IDF port registers some extra CLI commands so you can easily try things out! Flash and connect to the esp32 dev board's UART console.
idf.py flash monitor
You may need to select a specific serial port, see idf.py --help for details.
As a first step you can try collecting and sending a coredump with the following commands:
# force a crash
esp32> crash 3
# wait for reboot
# join network
esp32> join <SSID> <PASSWORD>
# Post data
esp32> post_chunks
If you built a project without a UART console you can test a coredump by inserting an assert that will fail, e.g.
   // [...]
   MEMFAULT_ASSERT(0);
Testing Data Uploaded to Memfault
Now it's time to see data decoded in the Memfault platform. To do that, we first
need to upload the generated symbol file (for ESP-IDF projects, it's usually
build/<your project name>.elf), then trigger some test data collection on
device, and then upload the data to Memfault for analysis.
Upload Symbol File
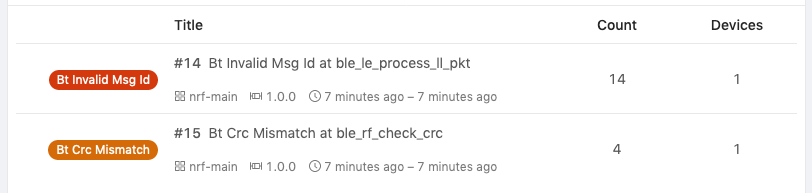
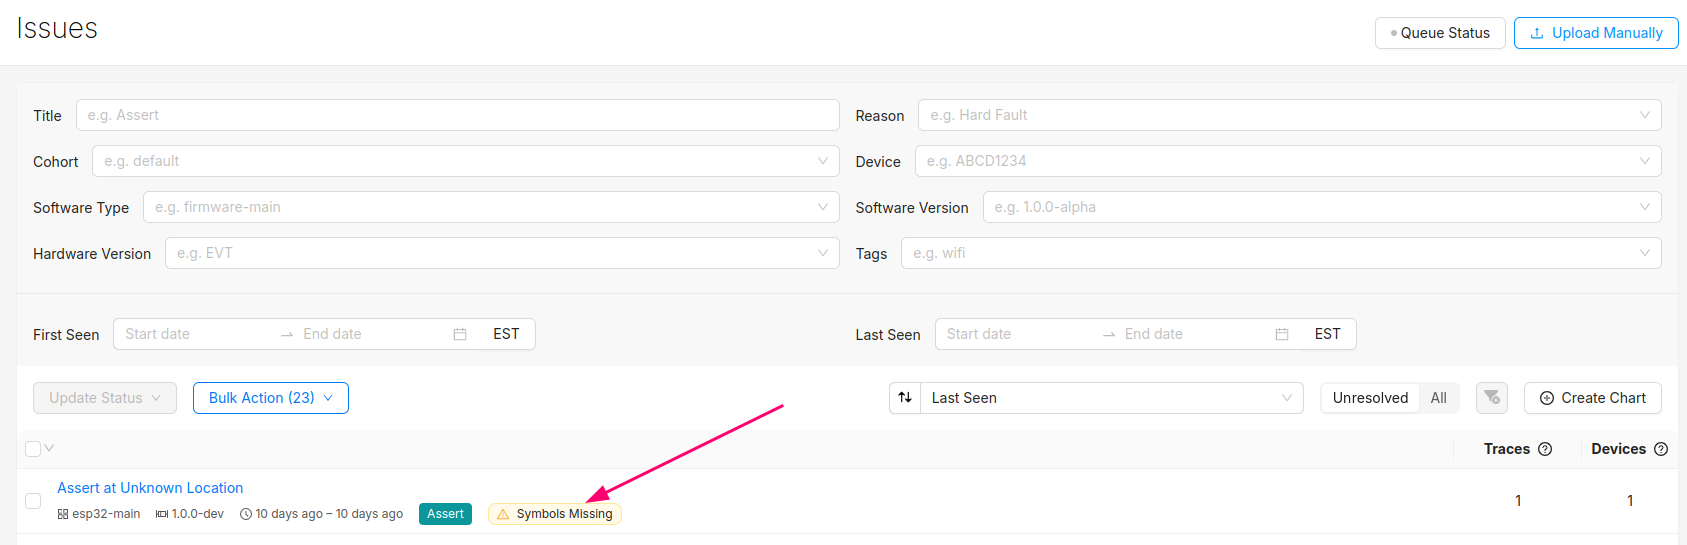
At this point, you should be able to generate test events and crashes and push the data to the Memfault UI.
You can confirm the error traces and crashes have arrived successfully by navigating to the "Issues" page- there should be a new issue with the "Symbols Missing" label:
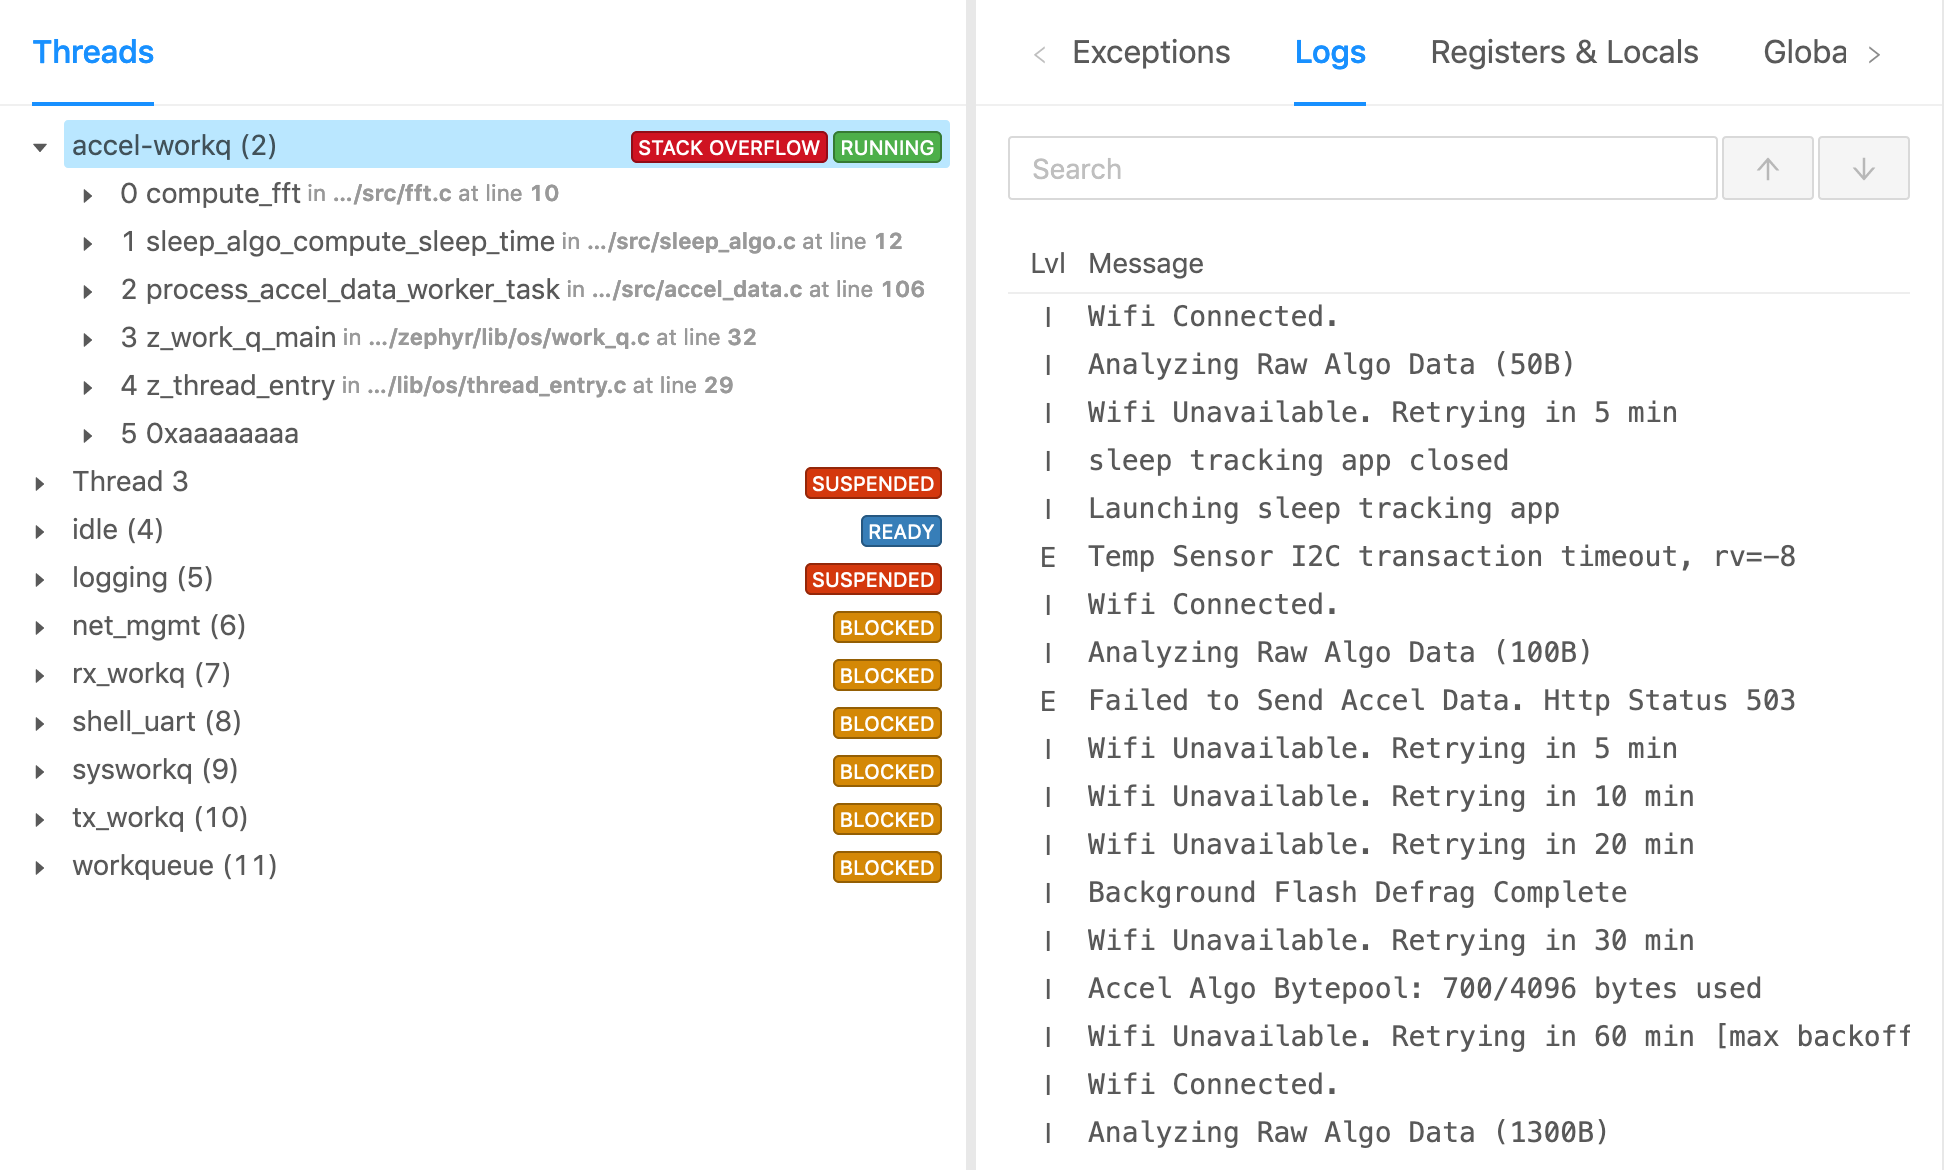
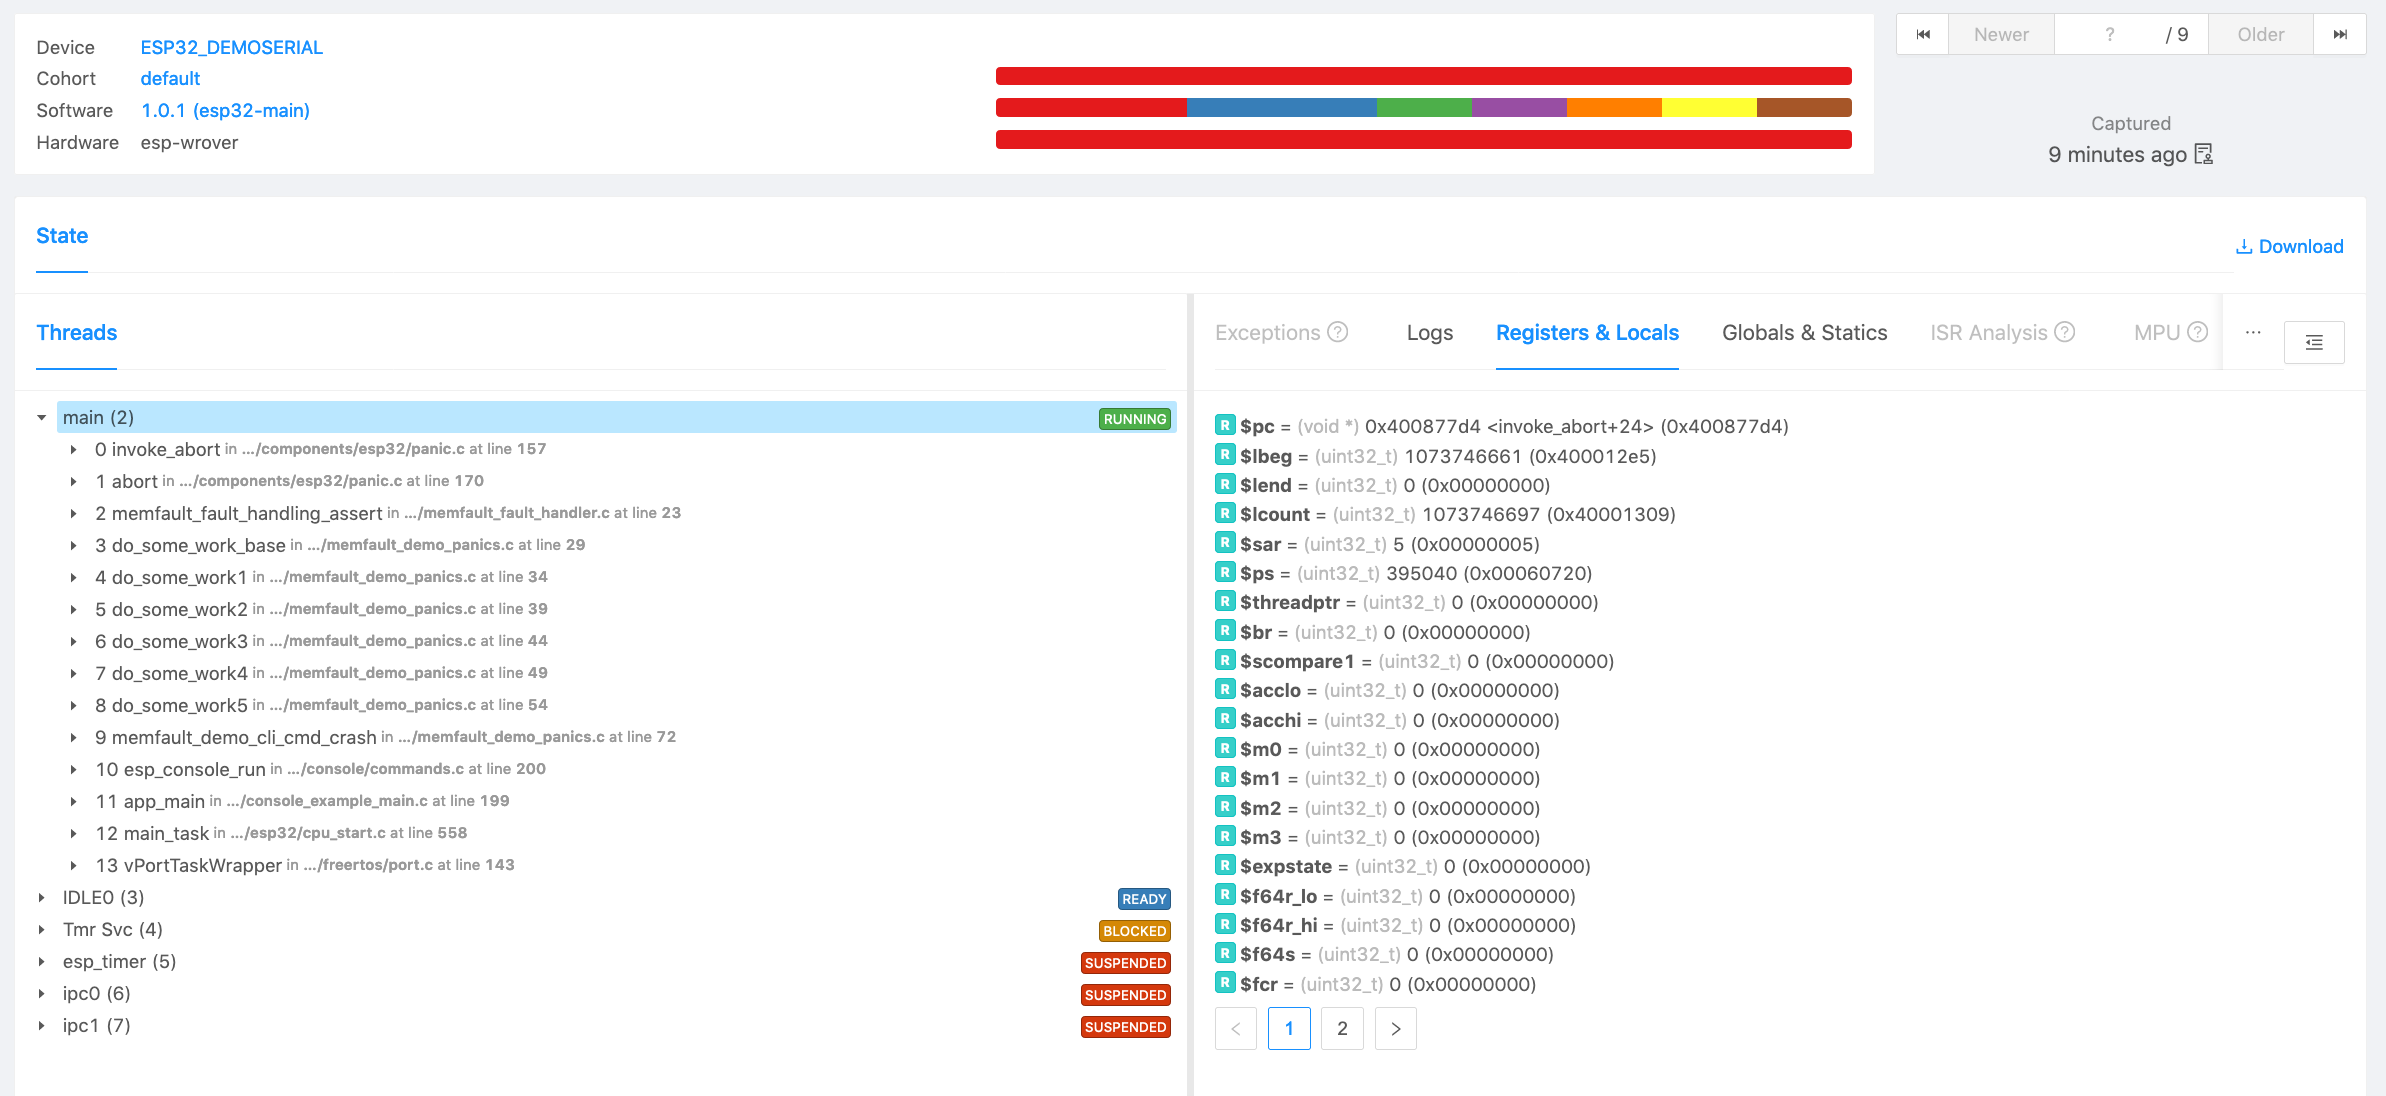
Clicking into the Issue will show the trace and a message that the symbol file is missing. It can be uploaded by clicking the button highlighted below:
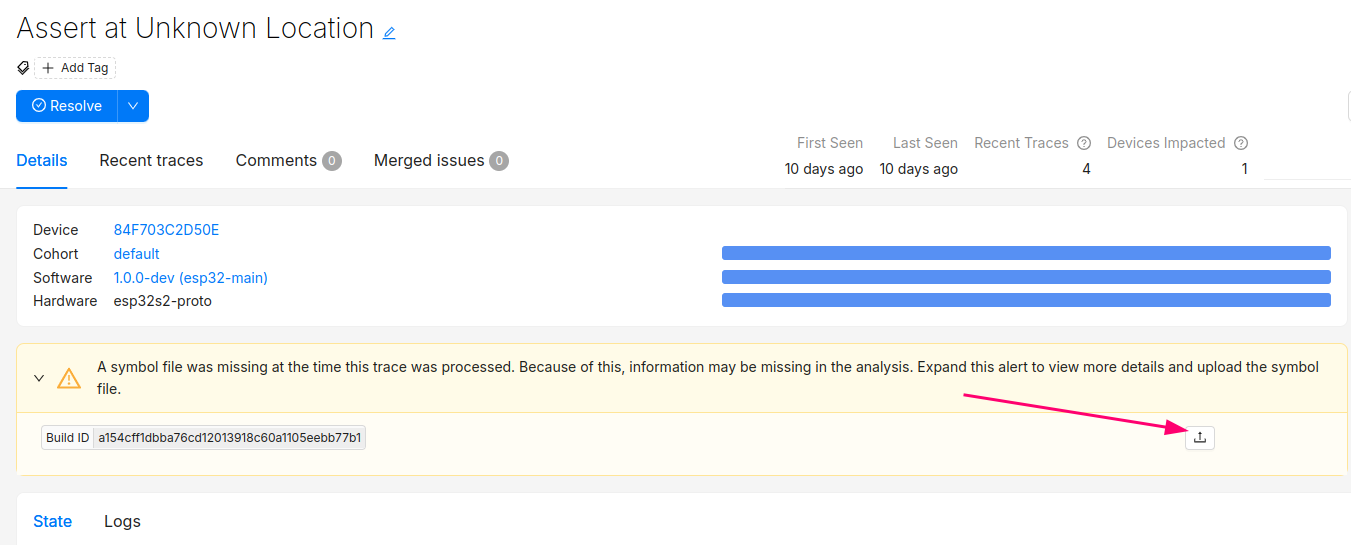
After this step, you will see the processed trace in the list of issues!
The Issue created when the symbol file is missing can now be set to resolved. It's good practice to always upload a symbol file before devices send any data.
Symbol files can also be uploaded from the Software → Symbol Files tab (follow this deep link to be brought to the symbol file upload point in the UI):
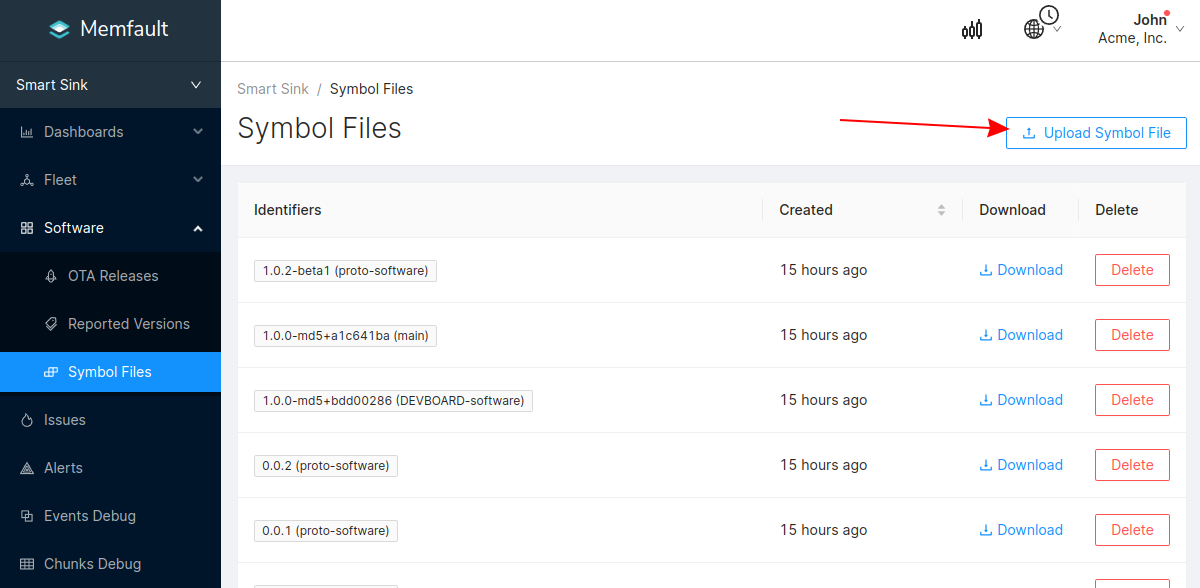
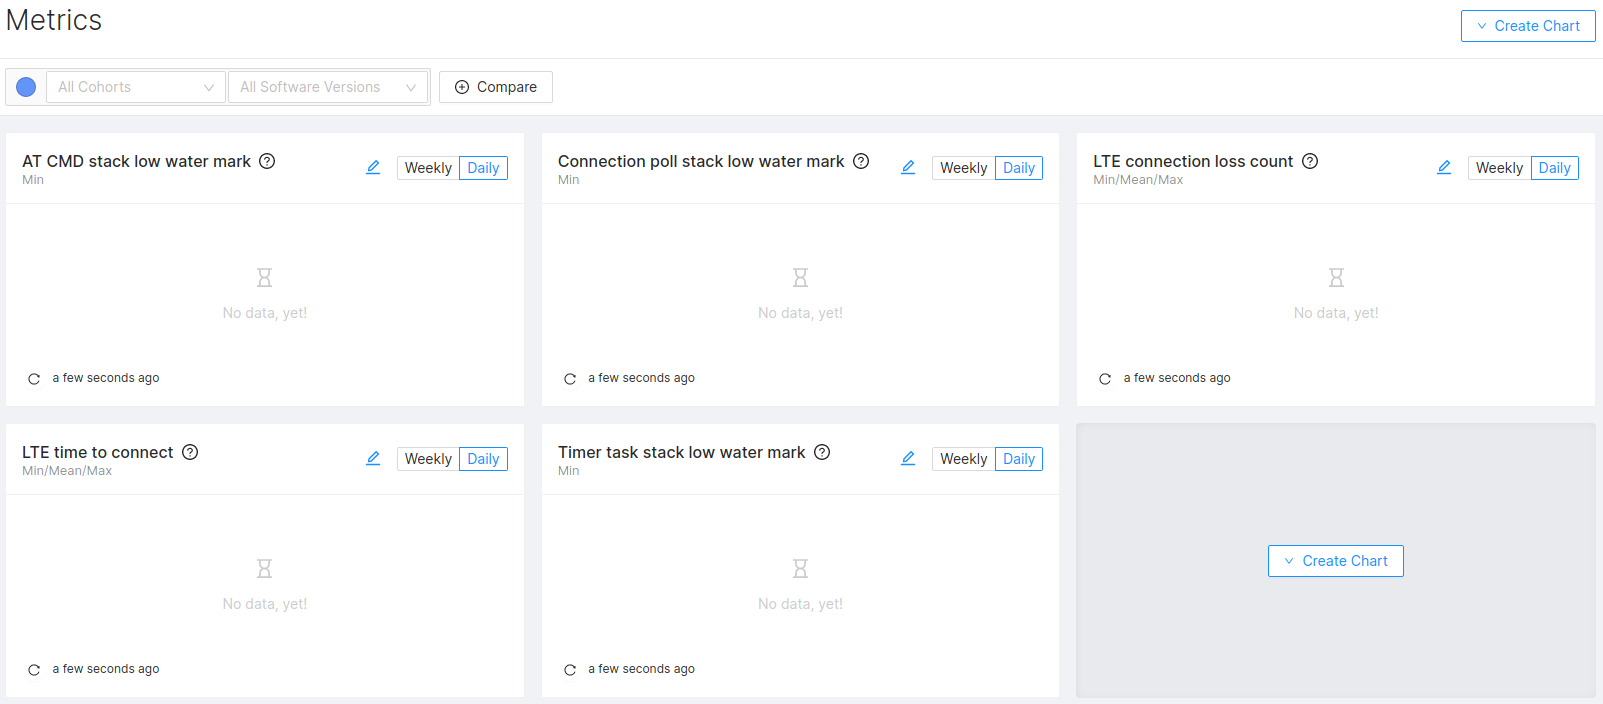
In addition to supporting decoding trace/coredump data, symbol files are also required for decoding Metrics.
You can programmatically upload symbol files with the Memfault CLI tool.
Symbol files should be uploaded to Memfault before devices send any data, to ensure all device data can be decoded.
Sending Data to the Memfault Cloud
At this point, the Memfault SDK is able to recognize crashes, track reboots, and
store metrics. Most of this information is stored in RAM, except for coredumps
which we keep in flash. To send that information to the cloud we need to call
the memfault_esp_port_http_client_post_data() function.
We recommend running it at a periodic interval. If there is no new data to send,
the call reduces to a no-op. The same function can also be invoked via the
Memfault CLI with the
post_chunks command.
int rv = memfault_esp_port_http_client_post_data();
if (rv != 0) {
  MEMFAULT_LOG_ERROR("Unable to post Memfault data, error %d", rv);
}
The Memfault SDK implements an optional uploader task that will call this post function at a custom interval (1 hour by default). To leverage this utility, set the following configs:
# Enable automatic periodic posting of Memfault data
CONFIG_MEMFAULT_HTTP_PERIODIC_UPLOAD=y

# Set the desired upload interval. 3600 (1 hour) is the default
CONFIG_MEMFAULT_HTTP_PERIODIC_UPLOAD_INTERVAL_SECS=<interval>
See additional Kconfig settings for configuring the upload task in the Kconfig reference!
Troubleshooting Data Transfer
If you encounter any issues in your data transfer implementation, Memfault has tools to help debug!
- To troubleshoot data not getting uploaded or processed correctly by the Memfault cloud, take a look at the Integration Hub → Processing Log view. This provides a filterable, chronological view of recent errors that have occurred while processing received data. See this documentation page for more information on the Integration Hub.
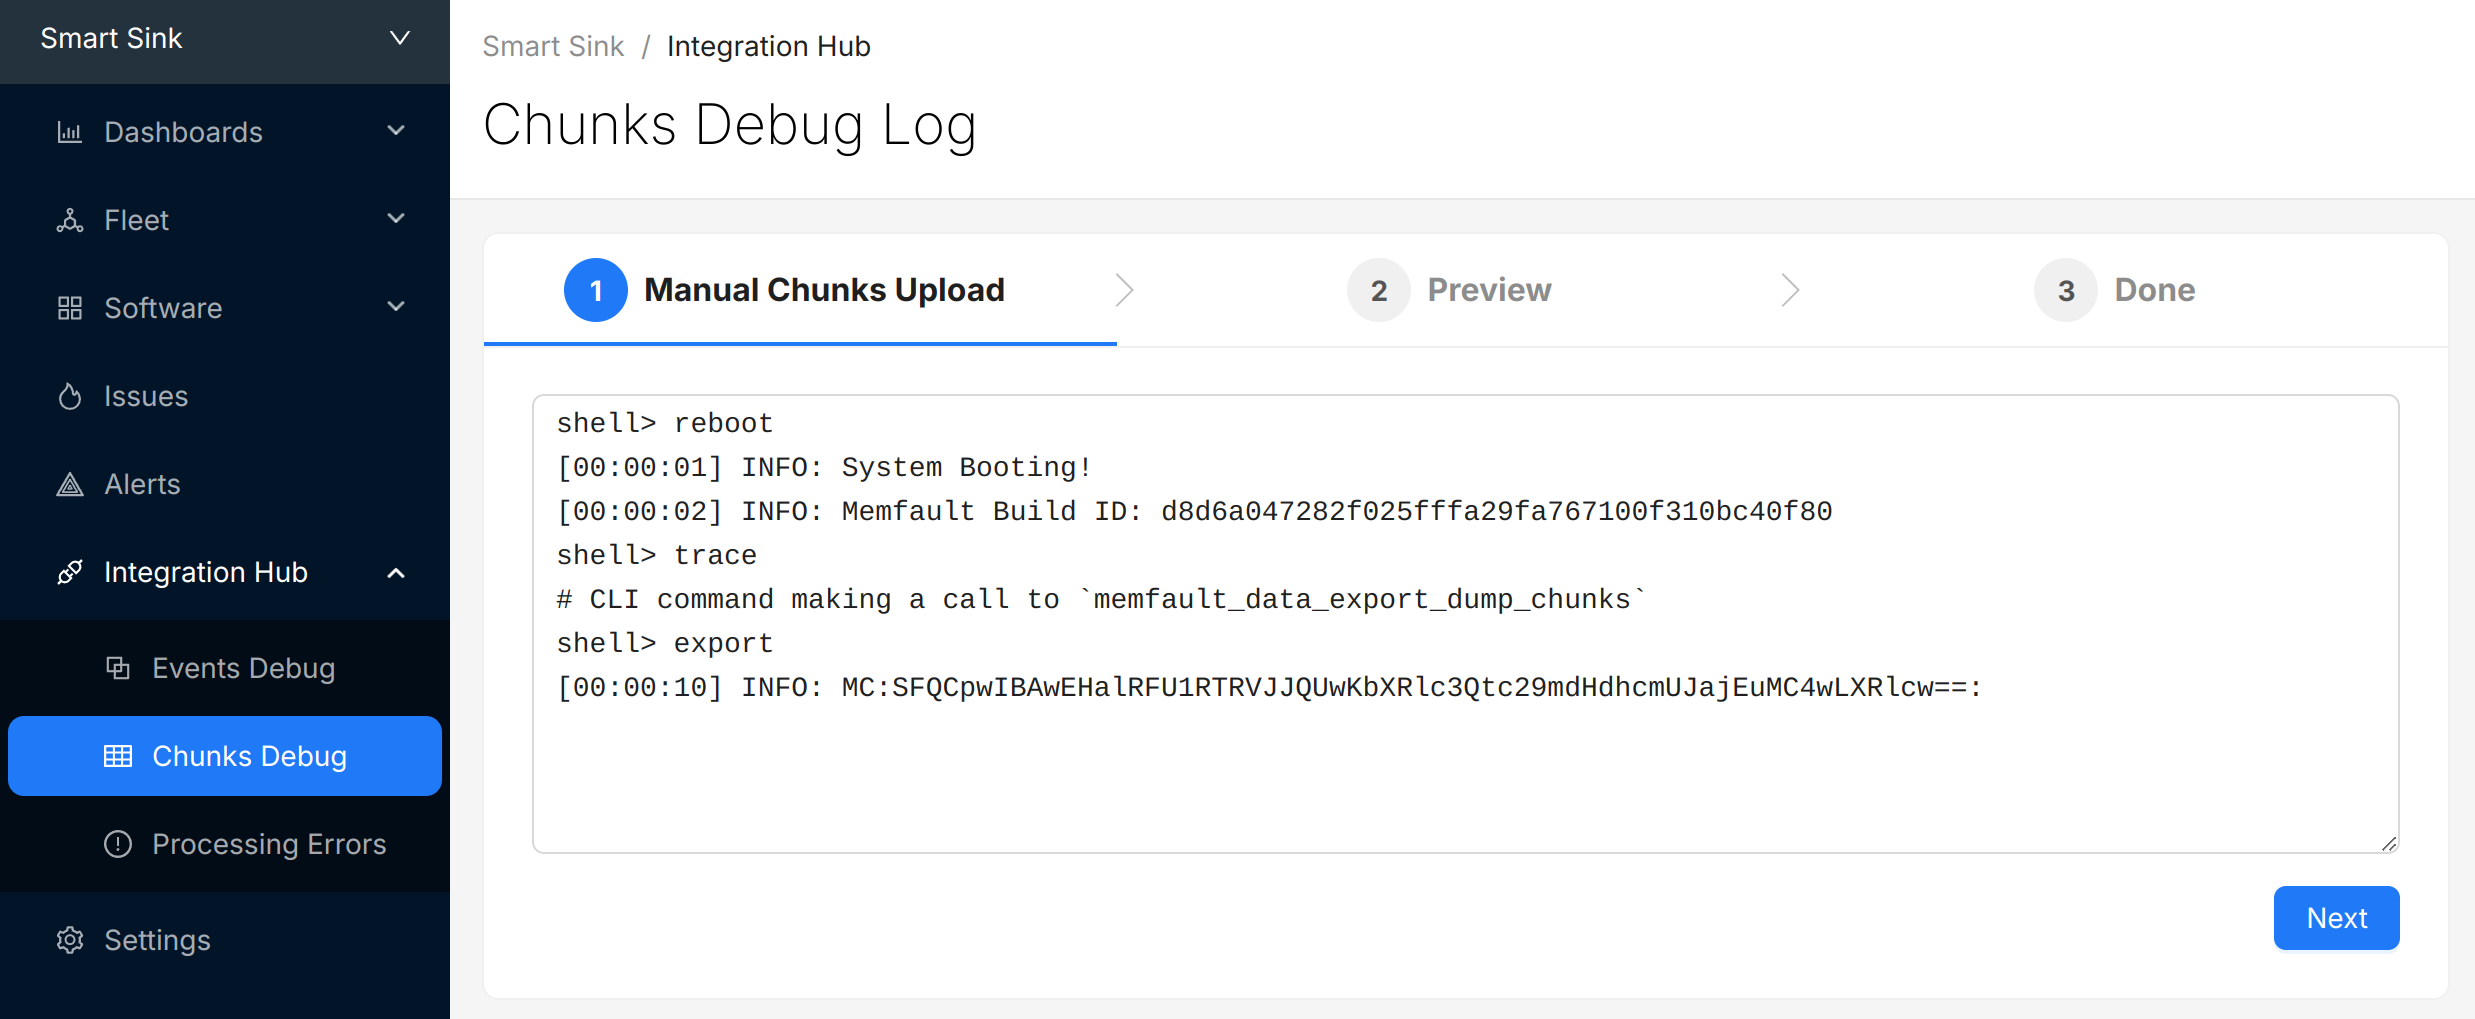
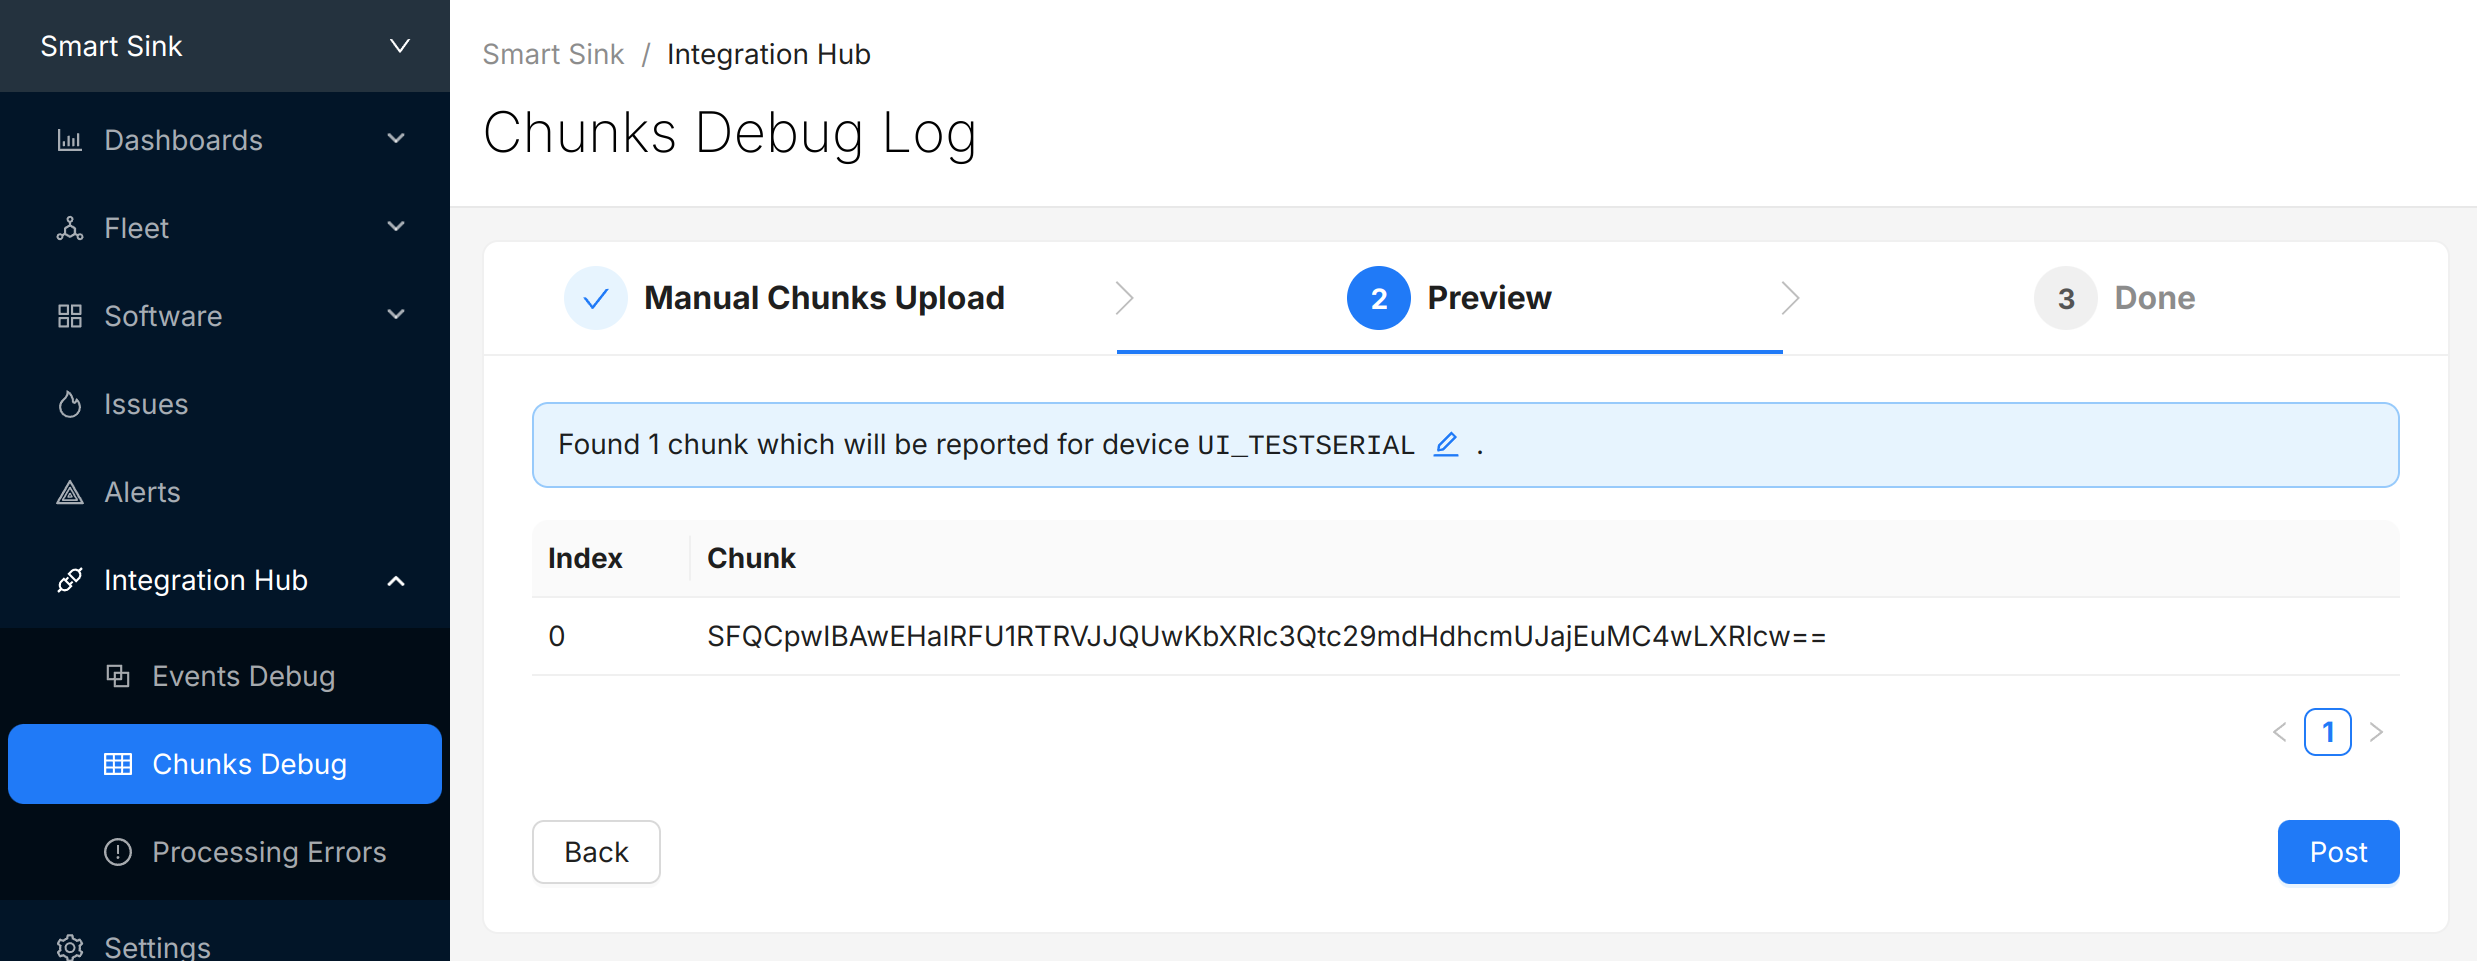
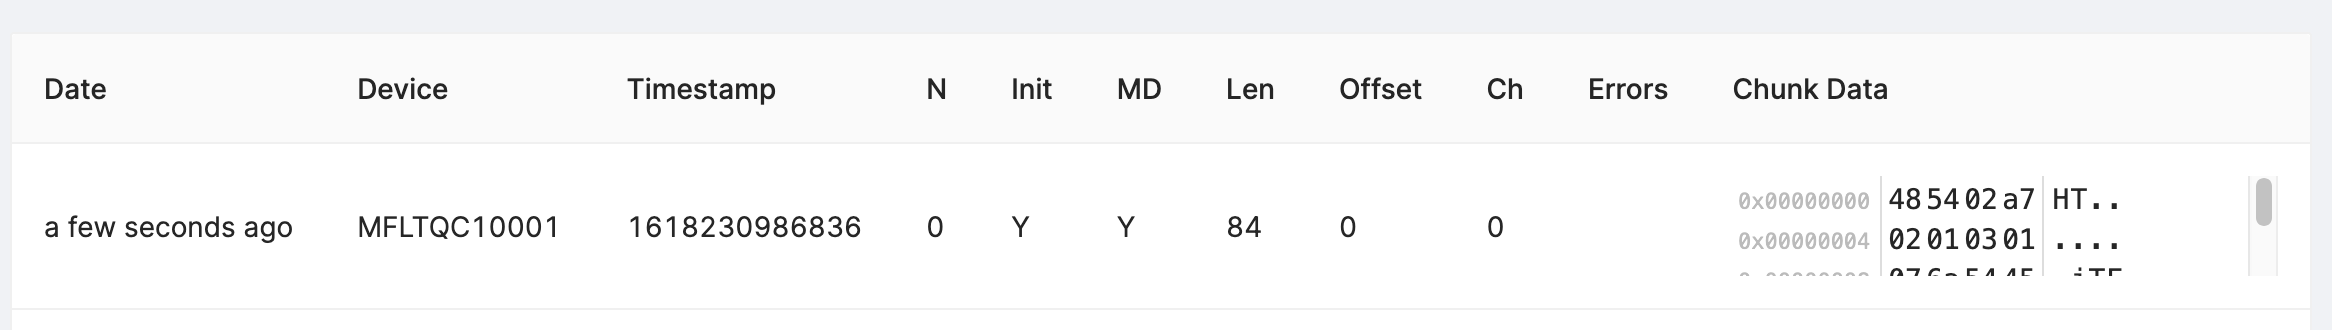
- A view you can use toview the raw "Chunk" data payloadsthat have arrived for your project.
- Precanned Data Payloads you can pass through your `user_transport_send_chunk_data()` implementation to test data transfer in isolation.
- Server-side rate limiting will apply to the device you're using to work on the integration process. Once you can see the device on the Memfault Web App, consider enabling Server-Side Developer Mode for it on the Memfault Web App to temporarily bypass these limits.
ESP-IDF Metrics
The Memfault SDK provides a number of built-in metrics for ESP-IDF projects, including but not limited to the following:
| Metric Name | Description |
|---|---|
esp_chip_revision | The ESP32 chip and revision, for example esp32c6-0.0 or esp32s3-0.2 |
flash_spi_erase_bytes | Total number of bytes erased on the SPI flash |
flash_spi_manufacturer_id | The 24-bit RDID value of the SPI flash chip, for example "c84017" = GigaDevice GD25Q64 8MiB |
flash_spi_total_size_bytes | Total size of the SPI flash chip in bytes |
flash_spi_write_bytes | Total number of bytes written to the SPI flash |
heap_allocated_blocks_count | Number of currently allocated heap blocks |
heap_free_bytes | Number of free bytes in the heap |
heap_largest_free_block_bytes | Size of the largest free block in the heap |
heap_min_free_bytes | Minimum number of free bytes ever in the heap |
idle_task_run_time_percent | Idle task run time percent for single core devices |
idle0_task_run_time_percent + idle1_task_run_time_percent | Idle task run time percent for dual core devices |
mbedtls_mem_max_bytes | Maximum bytes allocated by mbedTLS |
mbedtls_mem_used_bytes | Current bytes allocated by mbedTLS |
network_rx_bytes | Total number of bytes received over the network |
network_tx_bytes | Total number of bytes transmitted over the network |
tcp_drop_count | Number of dropped TCP packets |
tcp_rx_count | Number of received TCP packets |
tcp_tx_count | Number of transmitted TCP packets |
thermal_cpu_c | CPU temperature in Celsius (not supported on original ESP32) |
udp_drop_count | Number of dropped UDP packets |
udp_rx_count | Number of received UDP packets |
udp_tx_count | Number of transmitted UDP packets |
wifi_ap_oui | OUI (Organizationally Unique Identifier) of the associated Wi-Fi access point |
wifi_connected_time_ms | Time in milliseconds the device has been connected to Wi-Fi |
wifi_disconnect_count | Number of times the device has disconnected from Wi-Fi |
wifi_primary_channel | The primary channel ID of the associated Wi-Fi access point |
wifi_security_type | The authentication mode of the associated Wi-Fi access point, for example WPA2_PSK |
wifi_sta_min_rssi | Minimum RSSI (signal strength) observed on the Wi-Fi station interface |
wifi_standard_version | The Wi-Fi version of the associated Wi-Fi access point, for example 802.11n |
The following metrics are only enabled when
CONFIG_MEMFAULT_DEEP_SLEEP_SUPPORT=y, and can be disabled with
CONFIG_MEMFAULT_DEEP_SLEEP_METRICS=n:
| Metric Name | Description |
|---|---|
active_time_ms | Time spent out of deep sleep |
deep_sleep_time_ms | Time spent in deep sleep |
deep_sleep_wakeup_count | Number of times the device woke up from deep sleep |
Frequently Asked Questions
Sizing the Coredump Partition
If your coredump partition size is insufficient to store a full RAM coredump,
the Memfault SDK will truncate the coredump to fit the available space. This
usually results in a useful coredump (active stack and thread stacks are
prioritized in the
ESP-IDF port memfault_platform_coredump_get_regions() implementation).
If you prefer to capture all of allocated RAM, either:
- Increase the
coredumppartition size to fit the maximum coredump size. You can use thememfault_coredump_storage_check_size()function to determine the maximum coredump size, which can vary depending on user configuration. It's recommended to call that function after system initialization. Note: ESP-IDF projects don't natively permit changing the partition table via an OTA update, so this option is generally useful only before devices are deployed - Configure Memfault to use the inactive OTA slot to store coredumps. The
inactive OTA slot is generally only used when downloading a new OTA release,
before it's applied, so it's usually safe to re-use the partition for
coredumps. Use the
CONFIG_MEMFAULT_COREDUMP_USE_OTA_SLOT=yKconfig flag to enable this mode. - Customize the
ESP-IDF port
memfault_platform_coredump_get_regions()implementation to store less data in the coredump (for example, removing the.bss,.data, or heap regions). This isn't required, because the Memfault coredump writer will safely truncate to fit available storage, but it will avoid the "Coredump Truncated to fit" warning from the Trace view in the UI.
Assert when initializing ESP-IDF Event Loop
Several ESP-IDF examples use the Event Loop library, and initialize it with this code:
// Create default event loop
ESP_ERROR_CHECK(esp_event_loop_create_default());
Memfault makes use of the default event loop for Wi-Fi metrics (enabled by
default, controlled with CONFIG_MEMFAULT_ESP_WIFI_METRICS), and calls
esp_event_loop_create_default() during memfault_boot().
The esp_event_loop_create_default() function can be safely called multiple
times- but returns ESP_ERR_INVALID_STATE if it's already initialized. The
above ESP_ERROR_CHECK macro will cause the application to assert in that case,
which is not desirable.
Instead, Memfault recommends using the following pattern to safely initialize the default event loop:
// Try to create default event loop. If it's already created, it returns
// ESP_ERR_INVALID_STATE, equivalent to ESP_OK here.
esp_err_t err = esp_event_loop_create_default();
ESP_ERROR_CHECK(err == ESP_ERR_INVALID_STATE ? ESP_OK : err);
Deep Sleep Support
See the guide at Deep Sleep Support for details on enabling support for tracking Metrics across deep sleep cycles.
Software Bill of Materials (SBOM) Generation
Espressif provides a utility, esp-idf-sbom, to generate an SBOM in SPDX
format:
https://github.com/espressif/esp-idf-sbom
To generate an SBOM for your project, follow these steps:
-
Build the project as usual with
idf.py build. -
Run the
esp-idf-sbomutility:# install the tool if needed
$ pip install esp-idf-sbom
$ esp-idf-sbom create build/project_description.json --output-file memfault_demo_app.spdx
The output file, here memfault_demo_app.spdx, is the one to upload to
Memfault.