Using Memfault with Low-Bandwidth Devices
IoT devices are being deployed all over the world, and many of these devices are connected to the internet using a variety of network topologies including options like LTE, LoRaWAN, and satellite connectivity. Without a standard Wi-Fi connection, bandwidth is often constrained and metered by a network carrier. Many devices are bandwidth-constrained due to the cost of each kilobyte sent or received, and some devices are further limited by the intermittent availability of their network source. Device battery requirements also can constrain bandwidth budgets.
Memfault was built from the ground up to handle devices with limited bandwidth, intermittent connectivity, and minimal processing power capabilities. Today, Memfault is being used successfully in bandwidth-constrained environments, and some customers are successfully using the service while restricted to 400 bytes per day!
In this article, we'll cover how to tune Memfault's SDK, and use the platform to effectively operate bandwidth-constrained IoT devices. Following these best practices will better equip IoT operators in their efforts to reduce network costs and device power consumption. We'll focus primarily on covering the setup for MCU-based devices since these fleets are more commonly limited in connectivity. This guidance is generally applicable to other supported platforms as well.
Built for Low-Bandwidth Device Operations
Memfault's platform architecture can handle devices with access to limited network bandwidth.
Efficient Device Data Collection
Device data is collected using Event serialization combined with RLE (Run-length encoding) compression which minimizes payload size in transit.
Multi-day Chunk Uploads
The Memfault SDK splits the collected data into chunks prior to transport. Chunks prepared for Memfault are buffered on the device. If a chunk upload begins and cannot be completed during the initial connection, devices will queue the remaining chunks and continue uploading them when reconnected to the network. This is a default behavior of the SDK. It's especially useful for scenarios where network bandwidth is constrained and connectivity is unstable. You can read more about how data is sent to Memfault in Data from Firmware to the Cloud.
Enable Low-Bandwidth Platform Features
Memfault provides a variety of features that can accommodate devices with bandwidth constraints. These are best practices crafted from working with customers who have deployed low-bandwidth devices in the field.
Use Compact Logs
Compact logs control whether human-readable ASCII logs are persisted or whether Memfault's compact log system is used. Enabling compact logs will save up to 85% of log data usage. Follow the guide on Enabling Compact Logs if you want to collect logs more efficiently without disabling them entirely.
Optimizing Coredump Collection
Coredumps provide valuable insights for developers while troubleshooting device faults and asserts, such as stack traces and register values. Below are a few modifications available for capturing coredumps more efficiently.
Reduce Coredump Size
While useful, Coredump collection can inflate network expenses due to the average size of a coredump. Memfault addresses these concerns by providing control over coredump size. Ideally, you can shrink the average size of a coredump to around 512 bytes. Follow the guidelines available in choosing what to store in a coredump for configuring what data should be included in coredumps.
Fundamentally, nothing about your Memfault user experience changes when collecting smaller coredumps. You will still see issues generated with coredump data included and logs flowing from the device. This doesn't change even if you chose a more constrained integration path and did not store all device RAM. To see a debugging session in action, watch Memfault 101.
The primary tradeoff here is reduced data resolution. There may be device issues where having additional context in the coredump is useful for debugging purposes.
Coredump Sampling
Collecting data from a percentage of diagnostic events occurring in the field using a sampling mechanism will reduce the volume of coredumps sent to Memfault. This involves implementing custom sampling functionality in your firmware so devices send a configurable percentage of coredumps. That way engineers can still access device issues while consuming less bandwidth.
Use Metrics Selectively
Metrics are a great way to monitor devices. Each metric you collect increases payload size by between 6-8 bytes. Collecting metrics selectively will decrease the amount of bandwidth your fleet requires while giving you insights about overall device health.
Check out the power of metrics webinar for a more detailed overview of metrics Memfault recommends to track.
Use OTA Delta Releases
If you're using Memfault OTA and you need firmware update binaries to be as small as possible, using Delta Releases is a potential strategy. However, they come with additional complexities and it's worth carefully considering whether they are worth it. Get more in-depth coverage from our docs on Delta Releases. You can also check out a post on Interrupt about OTA delta updates.
Recommended Bandwidth Optimized Device Configurations
Memfault's SDK can be tuned for achieving minimal data collection:
- Collect Network Utilization Metrics In Heartbeats
- Set a longer Heartbeat interval of 6+ hours
- Reduce the number of Metrics pulled from devices
- Verify
MEMFAULT_EVENT_INCLUDE_DEVICE_SERIALis disabled - Verify
MEMFAULT_DATA_SOURCE_RLE_ENABLEDis enabled - Increase minimum logging level
MEMFAULT_RAM_LOGGER_DEFAULT_MIN_LOG_LEVEL - Disable Coredump Collection
Take a look at the default configuration
default_config.h.
Familiarizing yourself with the standard config, or minimally knowing one exists
and where to find it, is helpful.
Remember, apply these best practices based on your specific bandwidth constraints.
Let's walk through the recommended configurations:
This assumes you've already integrated the Memfault SDK.
Collect Network Utilization Metrics In Heartbeats
One metric to make sure to collect is overall network usage, especially if bandwidth is metered. Collecting device network activity can help quickly identify regressions in increased data collection on a per-device basis. Memfault can help with this. One of the recommended Heartbeat metrics worth tracking is data efficiency. Let's step through an example of how to add a metric tracking network bytes being transported in and out of a device using LTE as the primary network transport:
Modify your Heartbeat config
memfault_metrics_heartbeat_config.def
Tracking the network bytes being transported to and from the device provides operators with insight into their data flow.
//! @file memfault_metrics_heartbeat_config.def
MEMFAULT_METRICS_KEY_DEFINE(LteNetworkBytesIn, kMemfaultMetricType_Unsigned)
MEMFAULT_METRICS_KEY_DEFINE(LteNetworkBytesOut, kMemfaultMetricType_Unsigned)
Instrument your firmware with the new transport metrics
Include the metrics instrumentation code supplied by Memfault's SDK in code paths where data is being sent or received over the network.
#include "memfault/metrics/metrics.h"
// [ ... ]
void lte_radio_send_bytes(const void *data, size_t data_len) {
  // [ ... code to send LTE data ... ]
  MEMFAULT_METRIC_ADD(LteNetworkBytesOut, data_len);
}

void lte_radio_receive_bytes(const void *data, size_t received_data_len) {
  // [ ... code to receive data over LTE]
  MEMFAULT_METRIC_ADD(LteNetworkBytesIn, received_data_len);
}
Verify Heartbeat includes data transport metrics
After deploying the new software version with new metrics configured, view the
Integration Debug / Processing Log
and open a Received Heartbeat. The Heartbeat should contain
LteNetworkBytesOut and LteNetworkBytesIn key-value pairs if the instrumented
code paths have been called. Refer to
Data Transfer Troubleshooting
if you don't see any values in the metrics payload.
Increase Heartbeat Interval
By default, Heartbeats are collected every 3600 seconds. Decreasing the
frequency of Heartbeats saves bandwidth without sacrificing data accuracy. For
example, if hourly Heartbeats are used and 1000 bytes are sent every hour over
an LTE radio, each Heartbeat will have a value of 1000 for LteNetworkBytesOut.
If daily Heartbeats are used, then the Heartbeat value for LteNetworkBytesOut
will be 24000 bytes. The quality of the data remains the same even when the
resolution is decreased.
Let's modify the collection interval to 6 hours.
Add the following to your project's memfault_platform_config.h:
memfault_platform_config.h
//! @file memfault_platform_config

#define MEMFAULT_METRICS_HEARTBEAT_INTERVAL_SECS 21600
Before removing any metrics or disabling collection entirely, consider increasing the Heartbeat interval to 24+ hours. It's preferable to reduce Heartbeat collection interval over removing useful metric values. They're a very efficient way to provide device information.
Note that the 6-hour collection interval is a guideline. Adjust based on your use case. Take a look at the article monitoring fleet health with Heartbeat metrics on Interrupt.
Verify MEMFAULT_EVENT_INCLUDE_DEVICE_SERIAL is disabled
Omitting the device serial from each event saves between 10-20 bytes per
payload. This is disabled by default in the Memfault SDK configuration. If it
has been modified, remove the configuration from your
memfault_platform_config.h file to use the default configuration value
disabling event serial inclusion.
Verify MEMFAULT_DATA_SOURCE_RLE_ENABLED is enabled
Run-length Encoding (RLE) compresses data on the fly which improves efficiency
when device data is in transit. This is enabled by default in the Memfault SDK
configuration. If it has been modified, remove the configuration from your
memfault_platform_config.h file to use the default configuration value
enabling data source RLE.
Enabling RLE means you can't use Async Data Source Mode.
Increase minimum logging level MEMFAULT_RAM_LOGGER_DEFAULT_MIN_LOG_LEVEL
Increasing the minimum logging level will increase the minimum log severity that's buffered by the Memfault Logging component. Depending on a particular system's logging setup, this can make better use of the log buffer space when that's captured as part of a coredump. We recommend collecting only warning and error logs when device bandwidth is limited. The exact collection level and instrumentation will depend on your logging implementation. You can learn more about how Memfault collects logs in the docs.
//! @file memfault_platform_config

//! Controls default log level that will be saved to https://mflt.io/logging
#ifndef MEMFAULT_RAM_LOGGER_DEFAULT_MIN_LOG_LEVEL
#define MEMFAULT_RAM_LOGGER_DEFAULT_MIN_LOG_LEVEL kMemfaultPlatformLogLevel_Warning
#endif
Note the technical tradeoff of reduced log collection is limiting the availability of useful context when debugging device issues.
Disable Coredump Collection
We recommend collecting coredumps whenever possible. Use this suggestion in very specific situations when your devices have extremely limited bandwidth.
Removing different data types such as coredumps from the Memfault packetizer
saves precious bytes being transmitted each time a device sends data to
Memfault. Use the data packetizer mask kMfltDataSourceMask_Event for only
collecting the lightweight data sources (reboots, Heartbeats, Trace Events).
This configuration is only set at runtime. Modify any instances you're using the
utility API
memfault_packetizer_set_active_sources():
memfault_packetizer_set_active_sources(kMfltDataSourceMask_Event);
Coredumps will still be saved on the device. Disabling this configuration only
ensures coredumps are not sent to Memfault. When you have physical access to the
device you'll still be able to review coredumps. Check out more info in the
data_packetizer.h
file.
Debugging Low-Bandwidth Devices
Now that we've established different Memfault methods that effectively reduce data collection, let's evaluate how these configurations provide valuable data for fixing an issue on a bandwidth-constrained device. Importantly, we've established that even with limited bandwidth, Memfault can collect essential diagnostic data including coredumps, metrics, and logs.
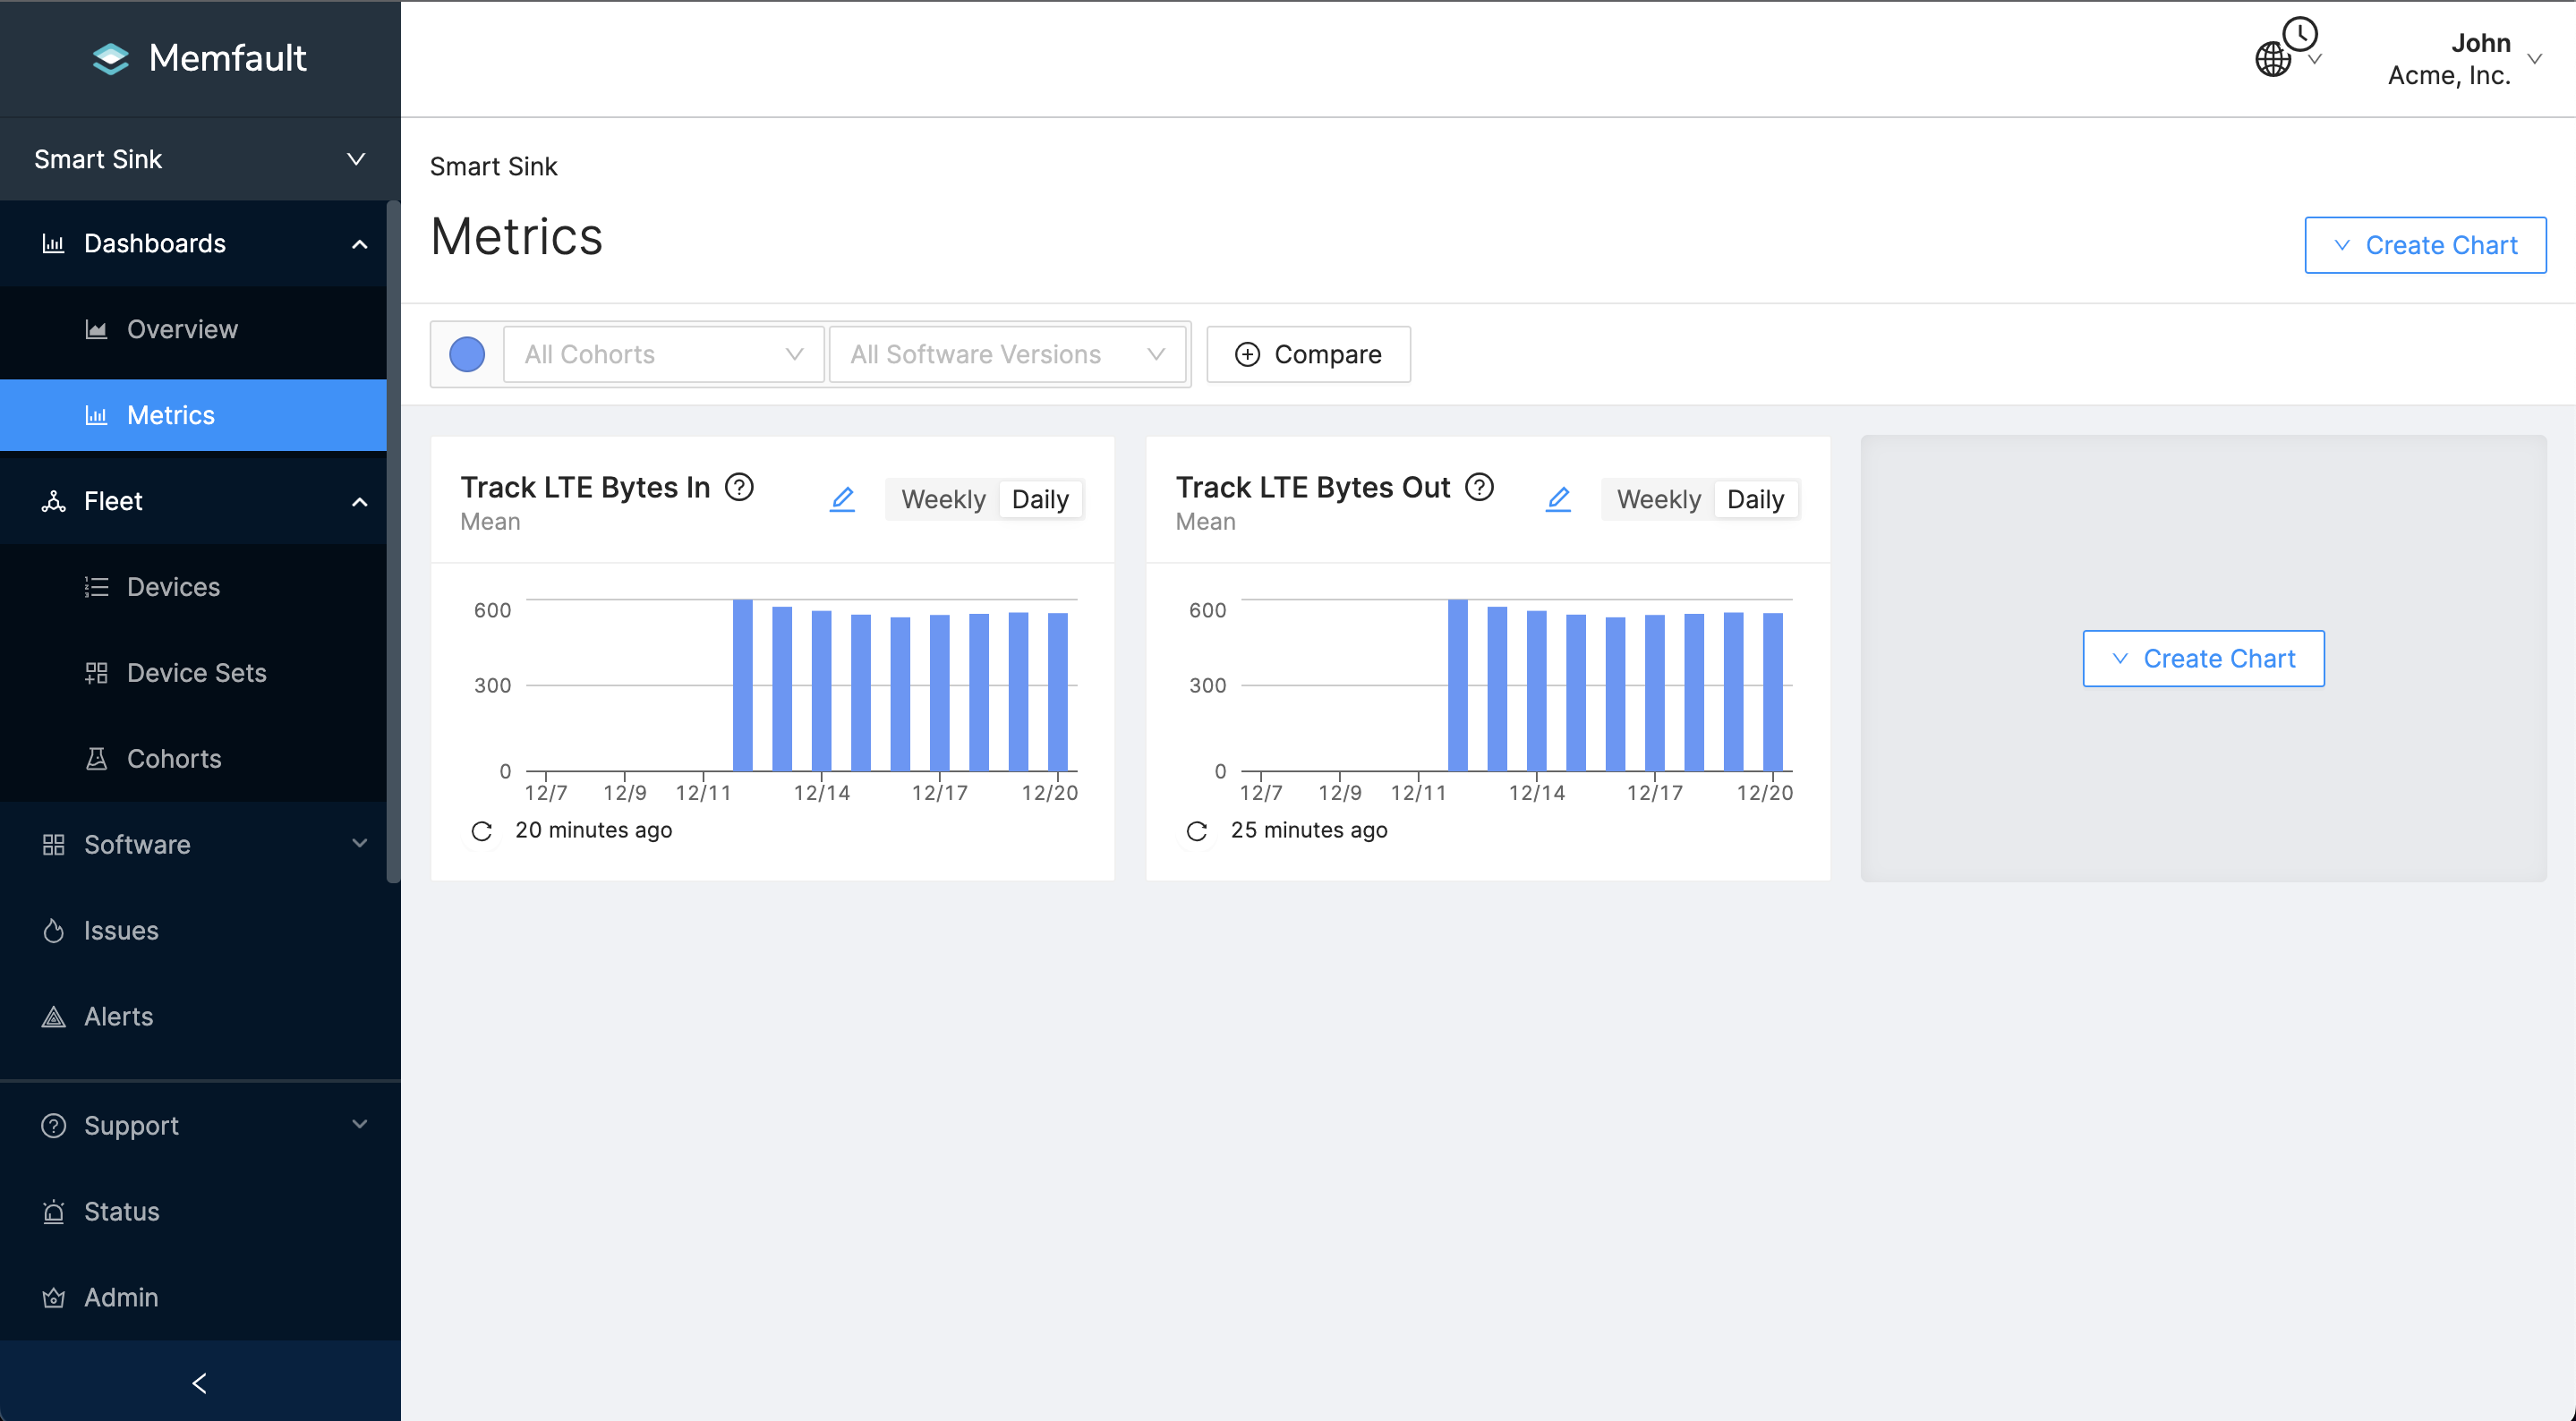
Track Data Usage with Metric Charts
Viewing metrics on the Memfault dashboard is useful for quickly spotting trends in fleet bandwidth usage. Navigate to the Metric Chart and create the following charts:
- Aggregate the mean of metric
LteNetworkBytesOut. - Aggregate the mean of metric
LteNetworkBytesIn.
Here's an example of the metric chart configuration:
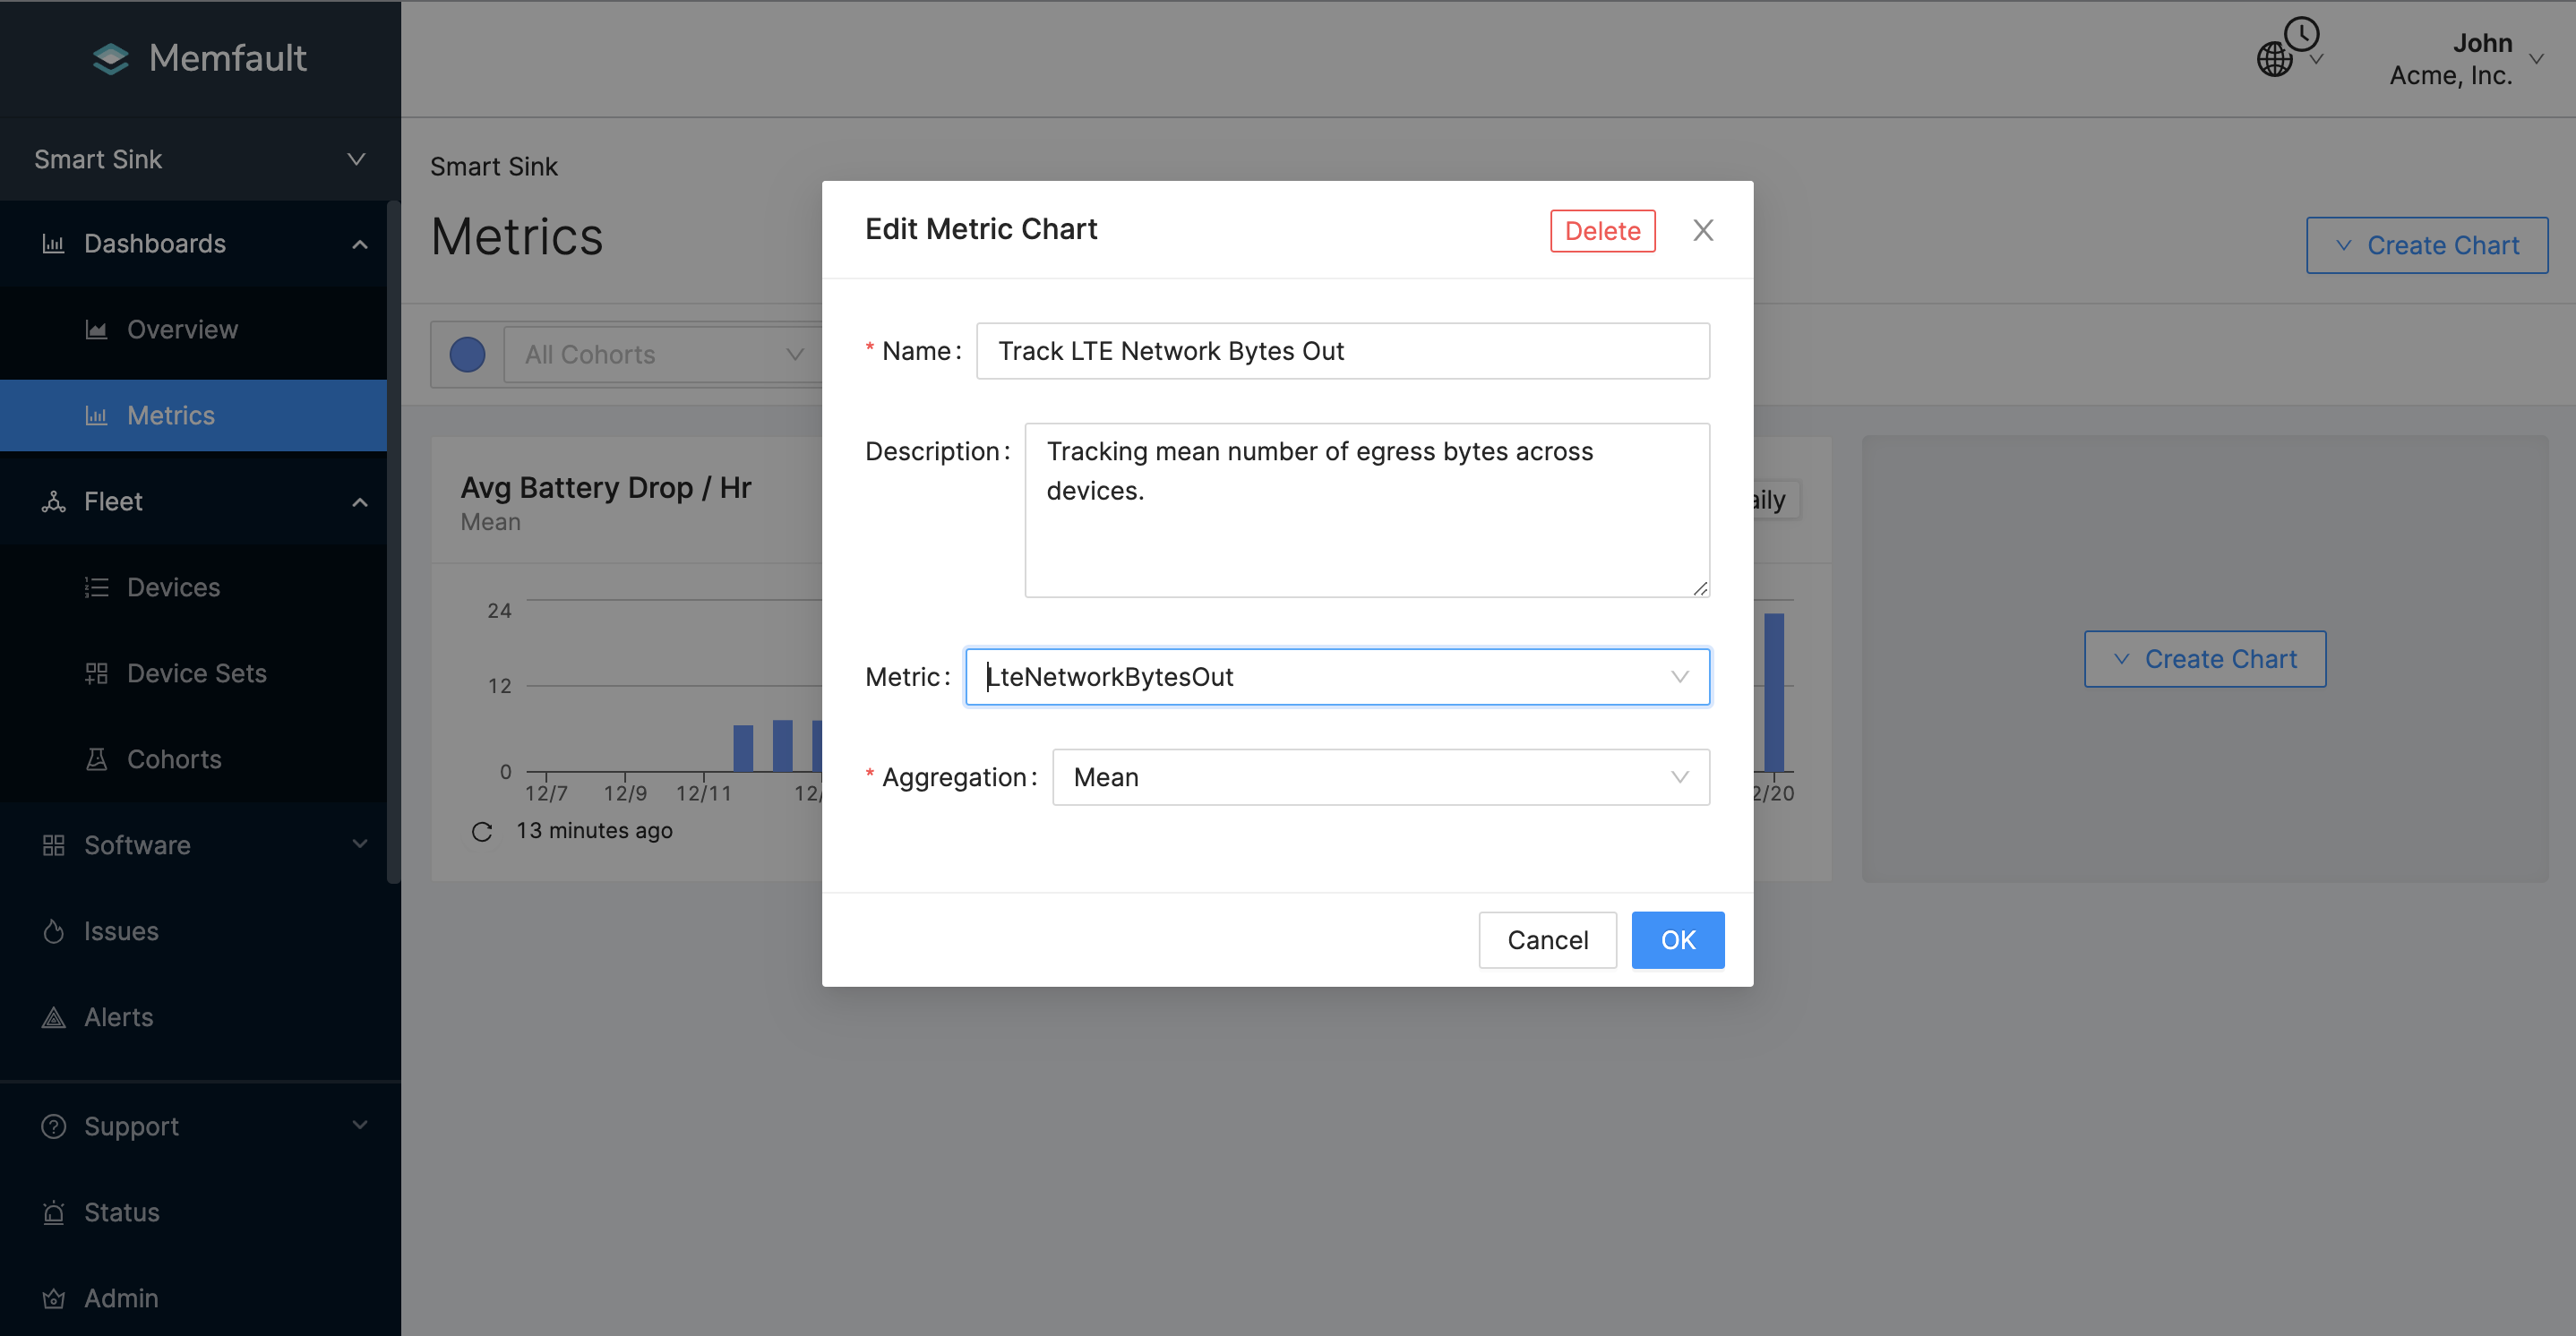
Between firmware updates, network consumption regressions are common. Tracking these metrics will highlight historical changes in bandwidth consumption. Combined with threshold alerts, metric dashboards are powerful tools for analyzing device performance across different software versions. When a new version is deployed, developers can monitor these dashboards and alerts for anomalous network consumption. This analysis becomes even more interesting when leveraging Memfault's OTA. You can create a new release and activate a staged rollout. This allows for more confident testing of new software versions on a percentage of devices in the field. If the new version contains code causing an increase in network utilization, the version rollout can be reverted without the entire fleet being impacted by the issue.
Get alerted on high data usage with Alerts
Developers monitoring device health want observability notifications covering
different network-related changes. For example, if a device is limited to using
10 megabytes per month, but the metric LteNetworkBytesOut is reporting 1
megabyte per day, something isn't right. The engineers responsible for device
monitoring want to know about this issue immediately. Memfault combines metric
values with
Device Threshold Alerts.
Developers can receive notifications whenever a device reports a specified value
or range of values.
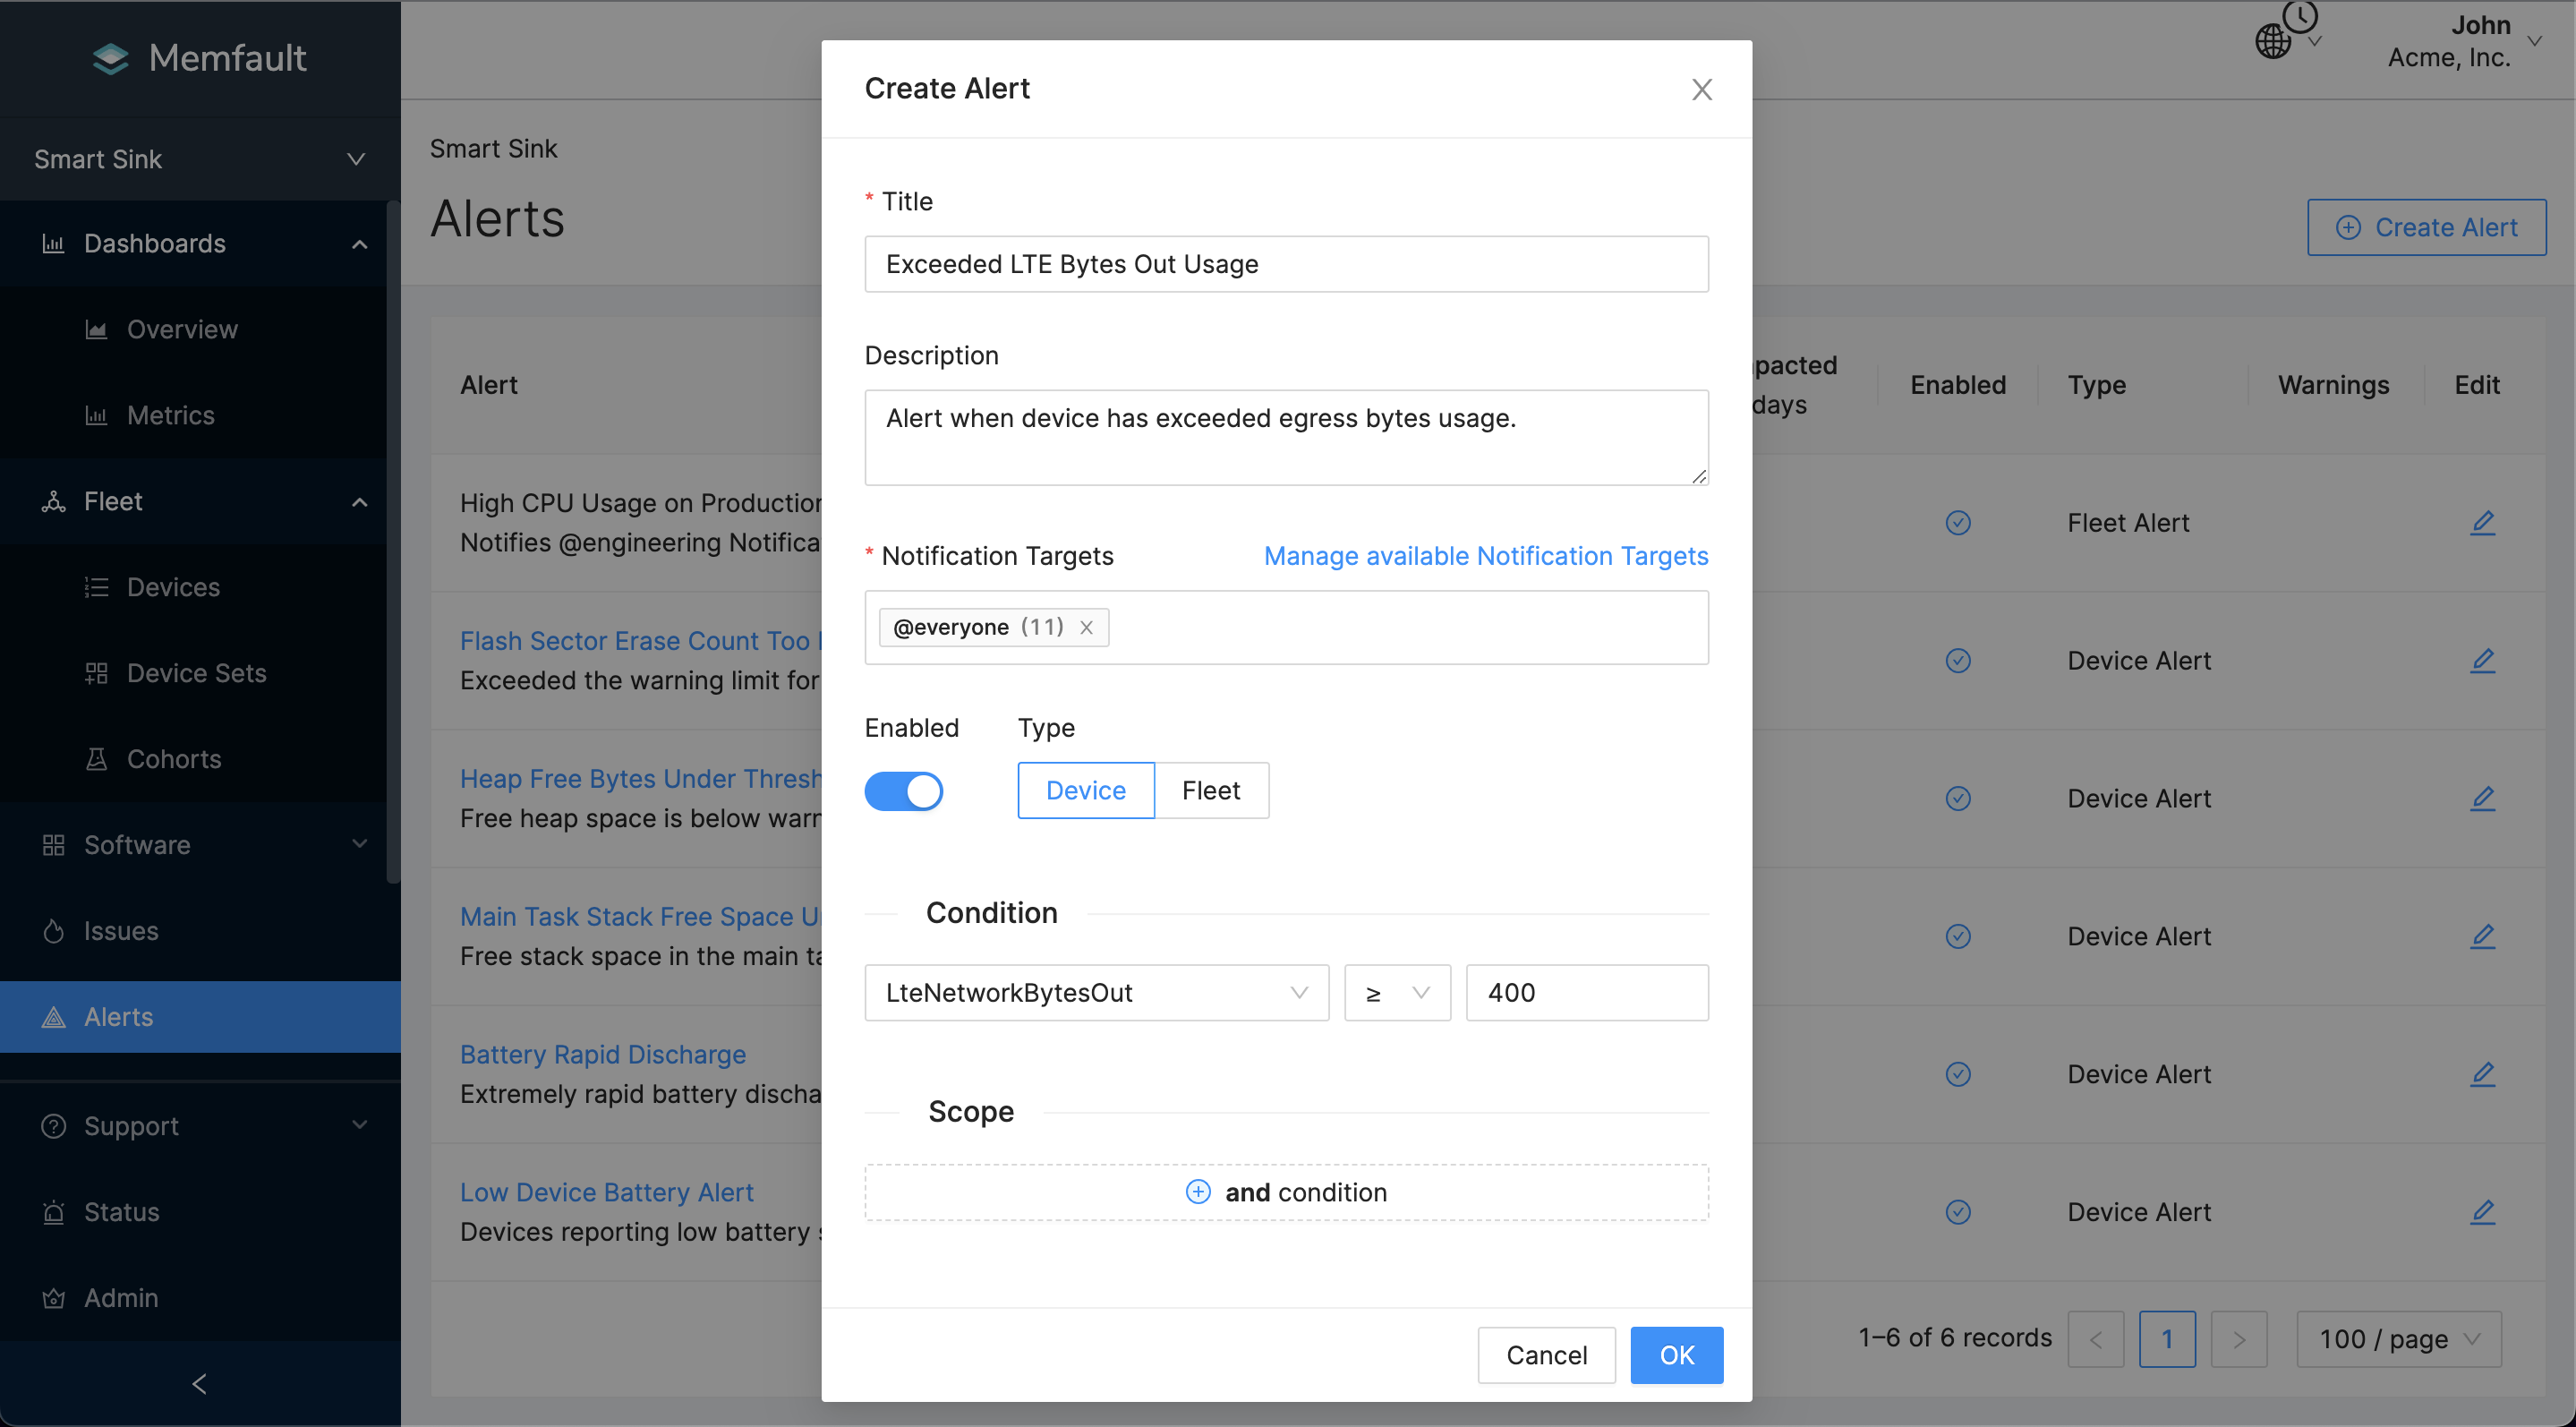
To add a Device Threshold Alert, Navigate to your Alerts. Let's configure 2 alerts that are triggered when:
- The metric
LteNetworkBytesOutis greater than your network bandwidth upper bound for egress traffic. - The metric
LteNetworkBytesInis greater than your expected network bandwidth upper bound for ingress traffic.
Here's an example of the alert configuration:
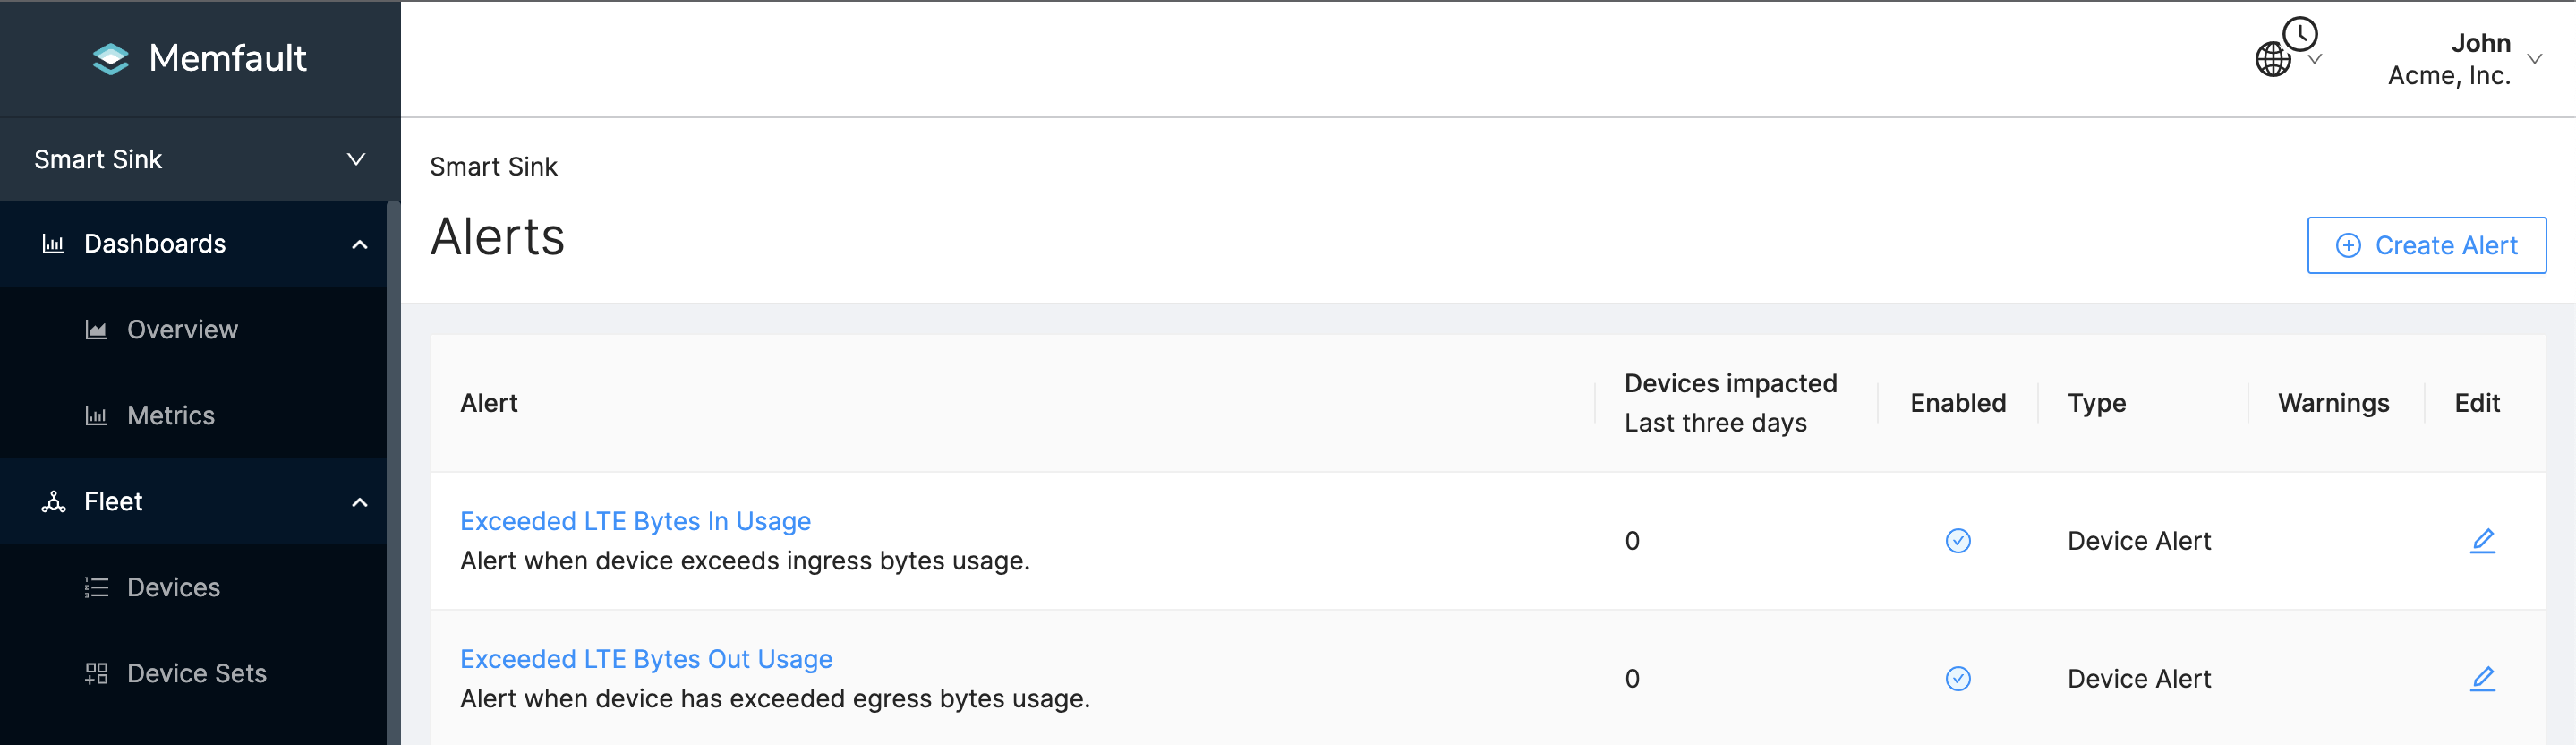
Whenever a device exceeds these thresholds, developers will get a notification and can jump into finding the root cause of the spike in bandwidth usage. Moreover, you can use these alerts to pinpoint outlier devices consuming more bandwidth than the average device in a fleet.