November 2021
Comparison Mode for Metric Charts
Since the introduction of Custom Metrics, Memfault provided various ways to define charts for plotting Fleet-wide aggregations (sum, count, min, max, mean). These charts are often used to visualize trends over time (e.g. "hours between recharge") or to detect anomalies (e.g. "attempt until successful connect") for a subset of the Fleet. The controls in the top-right corner allow for ad-hoc filtering by Cohort and/or software version.
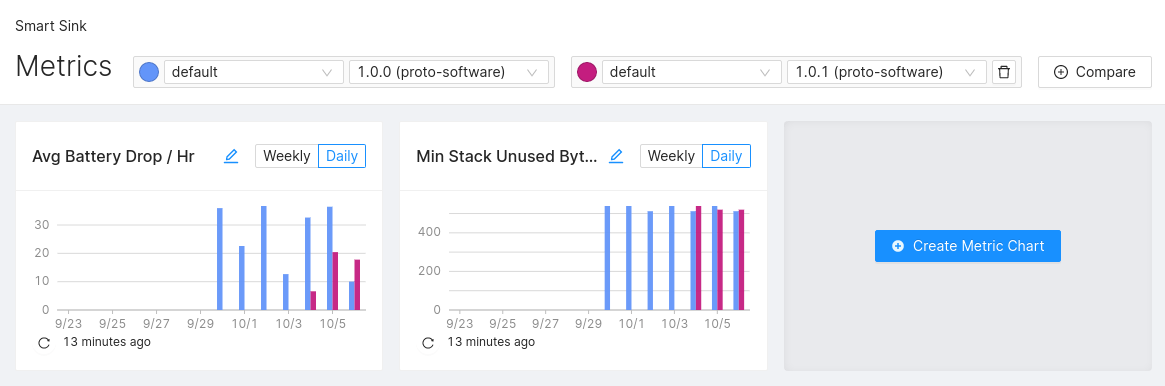
With the advent of the Chart Comparison Mode, users can now apply up to 4 such filters simultaneously to plot the resulting data series side-by-side inside each custom chart.
Use this feature to visually compare your beta Cohort against the production Fleet or to see at a glance if there are any regressions for key metrics between the last software versions.
Linked Devices
Sometimes, products span across multiple devices: Each pair of wireless earplugs has a left and right version, for each smart home installation there may be multiple components in a network, or some related device information lives outside of Memfault, and your workflow benefits from quick navigation to another software system.
Memfault's Linked Devices provide convenient navigation in these scenarios. It builds these connections by looking at Device Attributes that can be edited in the UI, updated via API, or sent from devices at any time.
MCU Heap Visualization
Memfault can now track and visualize heap allocations with any coredump on a growing number of MCU Architectures starting with ARM Cortex-M, nRF Connect SDK, ESP32 ESP-IDF, ESP8266, and Dialog DA1469x.
This optional debugging feature tags all heap allocations with their respective size, address, and location of code that allocated it. Use it to understand memory distribution, heap fragmentation, or to find memory leaks in an out-of-memory situation in the field.
Managing Rate Limits
Memfault's frontend is now more upfront with the visualization of quotas and rate limits that may affect large projects.
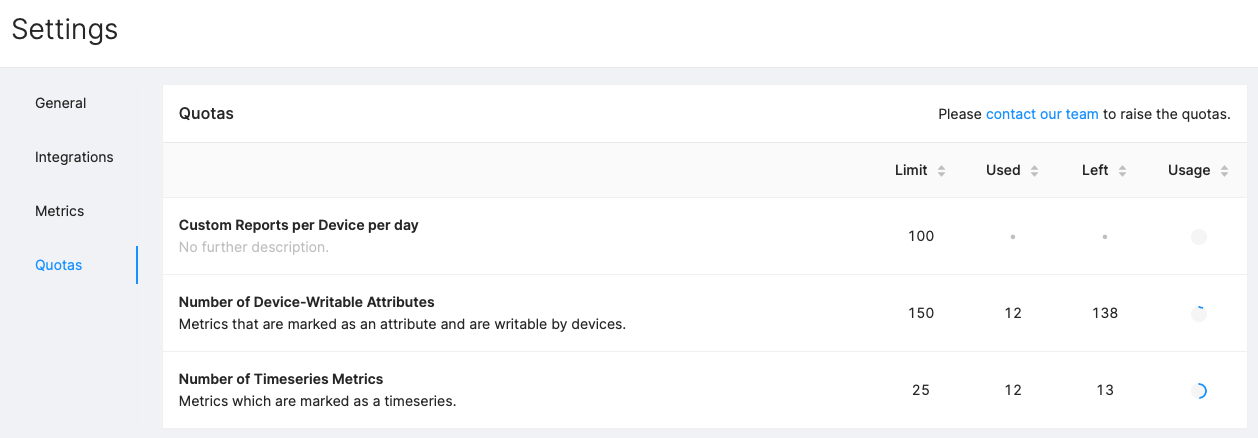
When managing Timeseries Metrics and Device Attributes, Memfault informs about the number of remaining metrics for Fleet-wide analytics. The dedicated page at Settings→Quotas presents an overview.
General
- Various UI improvements: Creating new elements in the UI follow a similar flow throughout Memfault, places that enumerate software versions consistently use their human-readable form, and unexpected errors no longer prevent interactions in the frontend.
- The Qualcomm QCC51xx support has received further compatibility improvements
when processing coredumps (
.xed/.xcd). - There is now detailed documentation on how Memfault handles ordering of version numbers and on Metrics and Device Attributes.
MCU SDK
In November, two SDK versions 0.27.2 and 0.27.3 were released. Here are some highlights:
- The Mynewt integration now supports the Memfault demo shell
via
mflt_shell_init(), see the Mynewt port README.md for details. Huge thanks to @t3zeng for providing this implementation! - Add support for ESP-IDF v4.3.1. This update should fix the bootlooping issue seen when using the port with v4.3.1+ of ESP-IDF.
- Add support for
LOG2deferred mode on Zephyr. This should fix bootloops when enablingLOG2. - Fix a build error for the Nordic Connect SDK v1.7.99 development version
- Update the esp32 and zephyr examples to use
1.0.0-devinstead of1.0.0+<6 digits of build id>for the version specifier. Build id is no longer required for symbol file reconciliation and the+character is a reserved character for URI schemes; this impacted OTA release requests. See this document for Memfault's recommended versioning strategy - Add a reboot reason port for the STM32F7xx family.
Android SDK
There was no new version of the Memfault Android SDK in November.