Android Custom Metrics
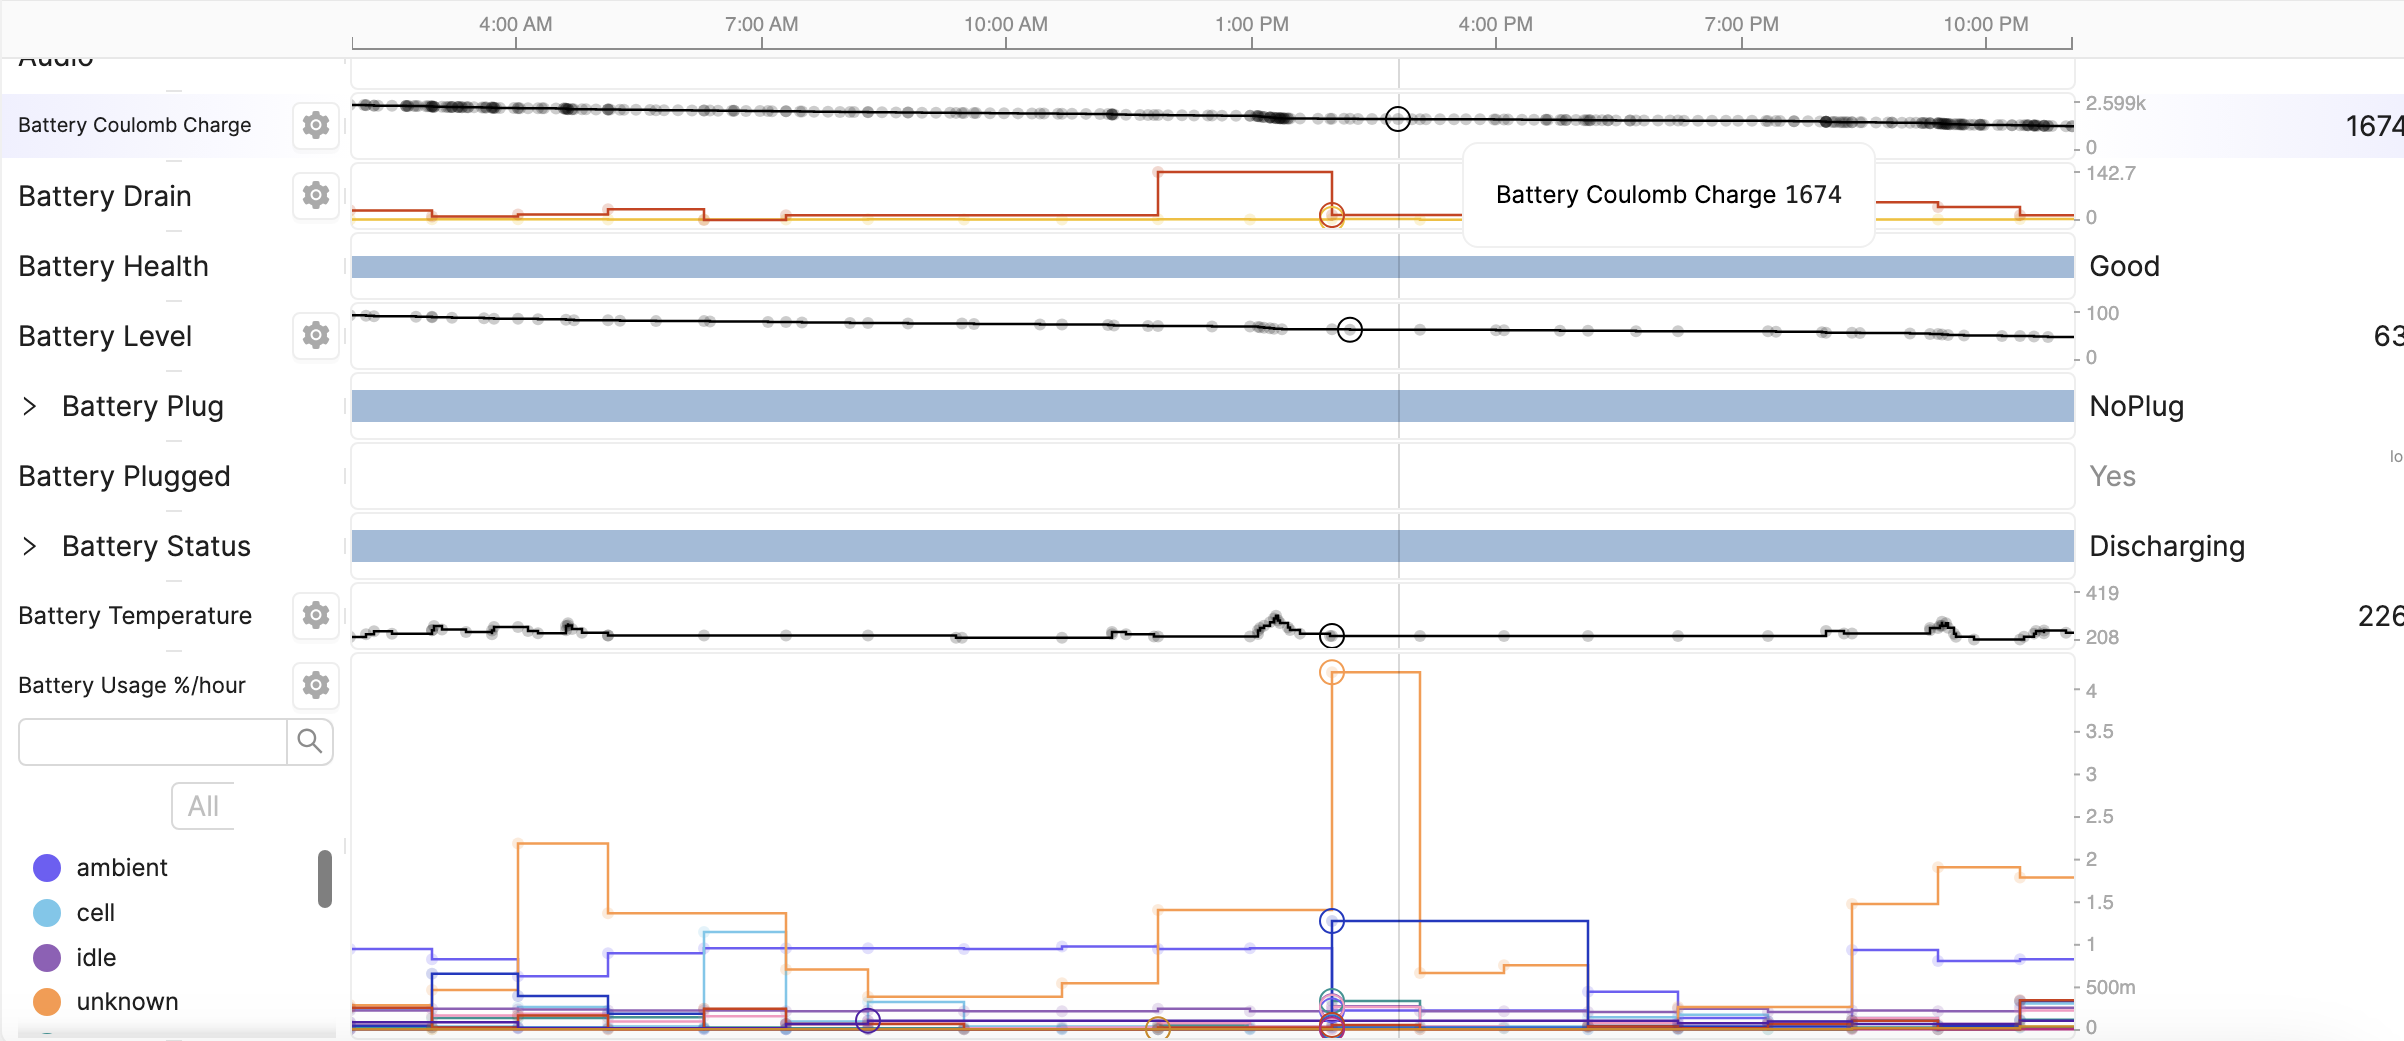
Memfault will collect various AOSP metrics automatically once integrated, like battery health, wakelock counts, foregrounded apps and so on. See Built-in Metrics for more details.
In addition to the built-in metrics, it is also possible to define custom metrics for your own domain-specific use cases. In this guide, we describe how to use Memfault's Reporting library to collect different kinds of metrics.
Reporting Library
For example, with the Reporting library, you can record 60 temperature values, one for every minute in an hour, using the below Kotlin API (Java and C++ APIs are also available).
Reporting.report()
  .distribution(name = "device_temp", aggregations = listOf(MIN, MEAN, MAX)).record(value)
Memfault will show all 60 recorded temperature values on the Device Timeline in
high resolution, and produce 3 Heartbeat
metrics (device_temp.min, device_temp.mean, device_temp.max), as a result
of the MIN, MEAN, and MAX aggregations.
High Resolution Telemetry (HRT)
Every value recorded by the Reporting library is uploaded and displayed in high resolution on the device timeline.
These values are not available for use as Timeseries or Attribute metrics.
Multiple values per hour can be recorded and visualized using HRT.
HRT is supported from 4.4.0 onwards.
Only devices with the Debugging Fleet Sampling resolution enabled will have their HRT values uploaded.
Metric Aggregrations
When you use the Reporting library, you can define an aggregations on the values that are recorded, so that a single aggregate metric will be produced in the Heartbeat report, at the end of the Heartbeat interval (usually 1 hour). This single aggregate metric is available for use as Timeseries or Attributes metrics.
Only devices with the Monitoring Fleet Sampling resolution enabled will have their aggregations uploaded.
See Metrics for more details on how metrics can be configured and used in the Memfault dashboard.
Including the Reporting library SDK
Metrics can be recorded from any application on Android, by including the appropriate library. Kotlin/Java/C/C++ applications are supported across the Gradle/Make/Soong build systems. Instructions for integrating the Reporting library in each configuration are available below.
Ask us if your configuration is not supported here!
- Gradle/Maven (Kotlin)
- Make (Java)
- Make (C/C++)
- Soong/BP (C/C++)
For apps that are built outside of the AOSP build system using Gradle, the
easiest way to include the reporting-lib
published on Maven Central.
Ensure that Maven Central is included in your project's root build.gradle
file:
repositories {
   mavenCentral()
   ...
}
Then in your app's build.gradle file, add:
dependencies {
    implementation 'com.memfault.bort:reporting-lib:1.5'
    ...
}
The Reporting library should then be accessible by importing the Reporting
class.
import com.memfault.bort.reporting.Reporting
// ...
Reporting.report()...
Once the Android SDK has been
integrated, a
target called memfault-reporting-lib will be available.
This is a static Java library that will need to be linked to your app's build target.
This is supported from Android SDK 4.9.0.
Add the following to your app's Android.mk file when using the AOSP Make build
system:
LOCAL_STATIC_ANDROID_LIBRARIES := memfault-reporting-lib
The Reporting library should then be accessible in the library by importing the
Reporting class.
import com.memfault.bort.java.reporting.Reporting;
// ...
Reporting.report()...;
Once the Android SDK has been
integrated, a
target called libmflt-reporting will be available.
This is a native (C/C++) library that will need to be linked to your app's build target.
Add the following to your app's Android.mk file:
LOCAL_SHARED_LIBRARIES := libmflt-reporting
The Reporting library should then be available by importing the reporting.h
header.
#include <reporting.h>
//...

metric_report_t report = metric_report_new();

metric_counter_t counter = metric_report_counter(report, ...);
Once the Android SDK has been
integrated, a
target called libmflt-reporting will be available.
This is a native (C/C++) library that will need to be linked to your app's build target.
Add the following to your app's Android.bp file:
shared_libs: ["libmflt-reporting"],
The Reporting library should then be available by importing the reporting.h
header.
#include <reporting.h>
//...

metric_report_t report = metric_report_new();

metric_counter_t counter = metric_report_counter(report, ...);
Recording Metrics
The Android SDK creates a Metric Report on a regular schedule (roughly once per hour). This report contains the aggregated values for all metrics which were reported over the period. This metrics will also be shown in high resolution on the Device timeline.
For example, if we create a counter metric and invoke its increment method 5
times during a reporting period, the Metric Report will contain this value (5).
Its value will be reset for the next reporting period.
The regular "heartbeat" metric Report is accessed using:
- Kotlin
- Java
- C
- C++
Reporting.report()
Reporting.report()
metric_report_t report = metric_report_new();
The report should be destroyed once no longer required, if appropriate for your application lifecycle:
metric_report_destroy(report);
auto report = std::make_unique<Report>();
Custom Reporting periods may be available in a future release of the SDK.
Individual metrics are created with methods on the Report class e.g.
- Kotlin
- Java
- C
- C++
Reporting.report().counter("my-counter")
Reporting.report().counter("my-counter");
metric_report_counter(report, "my-counter", true);
report->counter("native_counter_cpp");
We recommend creating variables to define each metric that you will use, so that configuration (naming, defining aggregations) only has to happen in one place e.g.
- Kotlin
- Java
- C
- C++
val distributionMetric = Reporting.report().distribution("my-distribution", numericAggs(NumericAgg.MEAN, NumericAgg.MIN))
Distribution distributionMetric = Reporting.report().distribution("my-distribution", Arrays.asList(NumericAgg.MEAN, NumericAgg.MIN));
metric_aggregation_t aggrs[] = {MEAN, MIN};
metric_distribution_t distribution = metric_report_distribution(report, "my-distribution", aggrs, 2);
The metric should be destroyed once no longer required, if appropriate for your application lifecycle:
metric_distribution_destroy(distribution);
auto distribution = report->distribution("my-distribution", {MEAN, MIN});
Then we can use this metric to record values from anywhere in our codebase:
- Kotlin
- Java
- C
- C++
distributionMetric.record(6.89)
distributionMetric.record(9.86)
distributionMetric.record(6.89);
distributionMetric.record(9.86);
metric_distribution_record_double(distribution, 6.89);
metric_distribution_record_double(distribution, 9.86);
distribution->record(6.89);
distribution->record(9.86);
Once the metric is recorded by the application, it will automatically show up in the Memfault dashboard app, where additional configuration is required to set the metric as Timeseries and/or Attributes.
Metric Types
The Reporting APIs provide convenience wrappers for several common types of metrics.
Counter
Tracks the number of times that an event occurred during each reporting period. As described above, the Android SDK will track all recorded values, and report the sum in the Metric Report.
Usage
Create a metric Counter named disconnection-events:
- Kotlin
- Java
- C
- C++
val disconnectionCounter = Reporting.report().counter("disconnection-events")
Counter disconnectionCounter = Reporting.report().counter("disconnection-events");
metric_counter_t disconnectionCounter = metric_report_counter(report, "disconnection-events", true);
auto disconnectionCounter = report->counter("disconnection-events");
Then record values:
- Kotlin
- Java
- C
- C++
disconnectionCounter.increment()
disconnectionCounter.incrementBy(4)
disconnectionCounter.incrementBy(7.9)
disconnectionCounter.increment();
disconnectionCounter.incrementBy(4);
disconnectionCounter.incrementBy(7.9);
metric_counter_increment(disconnectionCounter);
metric_counter_increment_by(disconnectionCounter, 4);
metric_counter_increment_by(disconnectionCounter, 7.9);
disconnectionCounter.increment();
disconnectionCounter.incrementBy(4);
disconnectionCounter.incrementBy(7.9);
This will create one metric in Memfault named disconnection-events.sum. In the
example above, this would have a value of 12.9 (1 + 4 + 7.9) for the
current reporting period. This metric can be disabled by setting
sumInReport = false when creating the metric (individual events will still be
shown in HRT on the Device Timeline).
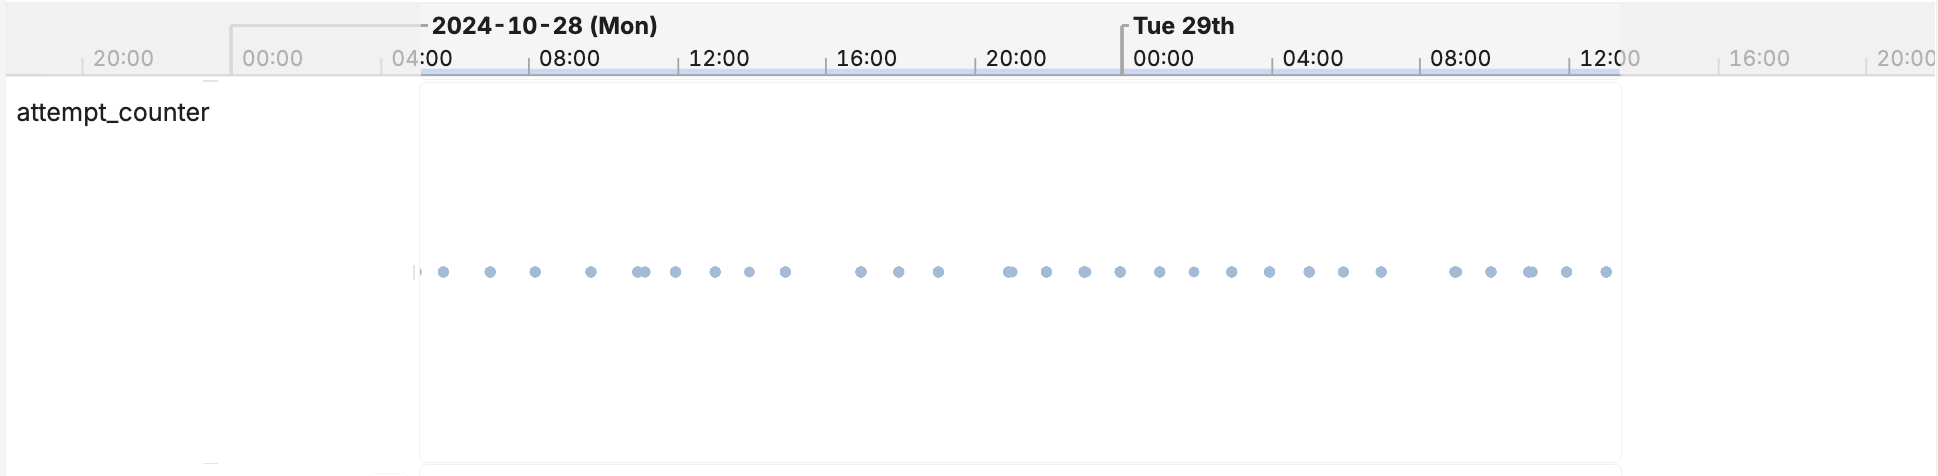
A Counter metric visualized in HRT.
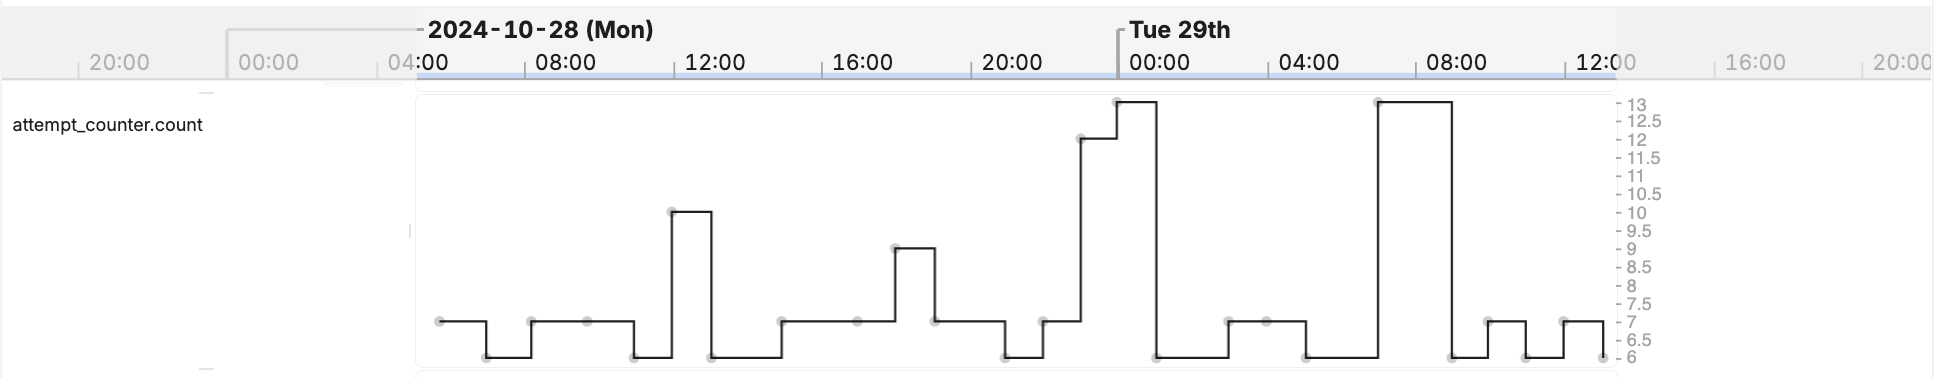
The same Counter metric visualized in hourly heartbeats.
Counters could be useful as either Timeseries Metrics (tracking trends over time), or simply for reviewing on Device Timeline.
Distribution
Tracks the distribution of a numerical value during the reporting period. Several aggregations are available to use.
Usage
Create a distribution metric named rssi, tracking the MEAN and MIN values:
- Kotlin
- Java
- C
- C++
val rssiMetric = Reporting.report().distribution("rssi", numericAggs(NumericAgg.MEAN, NumericAgg.MIN))
Distribution rssiMetric = Reporting.report().distribution("rssi", Arrays.asList(NumericAgg.MEAN, NumericAgg.MIN));
metric_aggregation_t aggrs[] = {MEAN, MIN};
metric_distribution_t rssiMetric = metric_report_distribution(report, "rssi", aggrs, 2);
auto rssiMetric = report->distribution("rssi", {MEAN, MIN});
Then record values periodically:
- Kotlin
- Java
- C
- C++
rssiMetric.record(-38.68)
rssiMetric.record(-39.83)
rssiMetric.record(-43.67)
rssiMetric.record(-78.89)
rssiMetric.record(-38.68);
rssiMetric.record(-39.83);
rssiMetric.record(-43.67);
rssiMetric.record(-78.89);
metric_distribution_record_double(rssiMetric, -38.68);
metric_distribution_record_double(rssiMetric, -39.83);
metric_distribution_record_double(rssiMetric, -43.67);
metric_distribution_record_double(rssiMetric, -78.89);
rssiMetric->record(-38.68);
rssiMetric->record(-39.83);
rssiMetric->record(-43.67);
rssiMetric->record(-78.89);
This will create one metric in Memfault to track each requested aggregation:
rssi.mean: the mean RSSI value seen in the reporting period (i.e. the average signal strength).rssi.min: the minimum RSSI value seen in the reporting period (i.e. the worst signal strength).
The available distribution aggregations are defined in the NumericAgg enum:
MIN | Minimum value recorded during the period. Appends the |
MAX | Maximum value recorded during the period. Appends the |
SUM | Sum of all values recorded during the period. Appends the
|
MEAN | Mean value recorded during the period. Appends the |
COUNT | Number of values recorded during the period. Appends the
|
All values will be shown in HRT on timeline. Entries will only be created in the Metric Report for each requested aggregation.
A Distribution metric visualized in HRT.
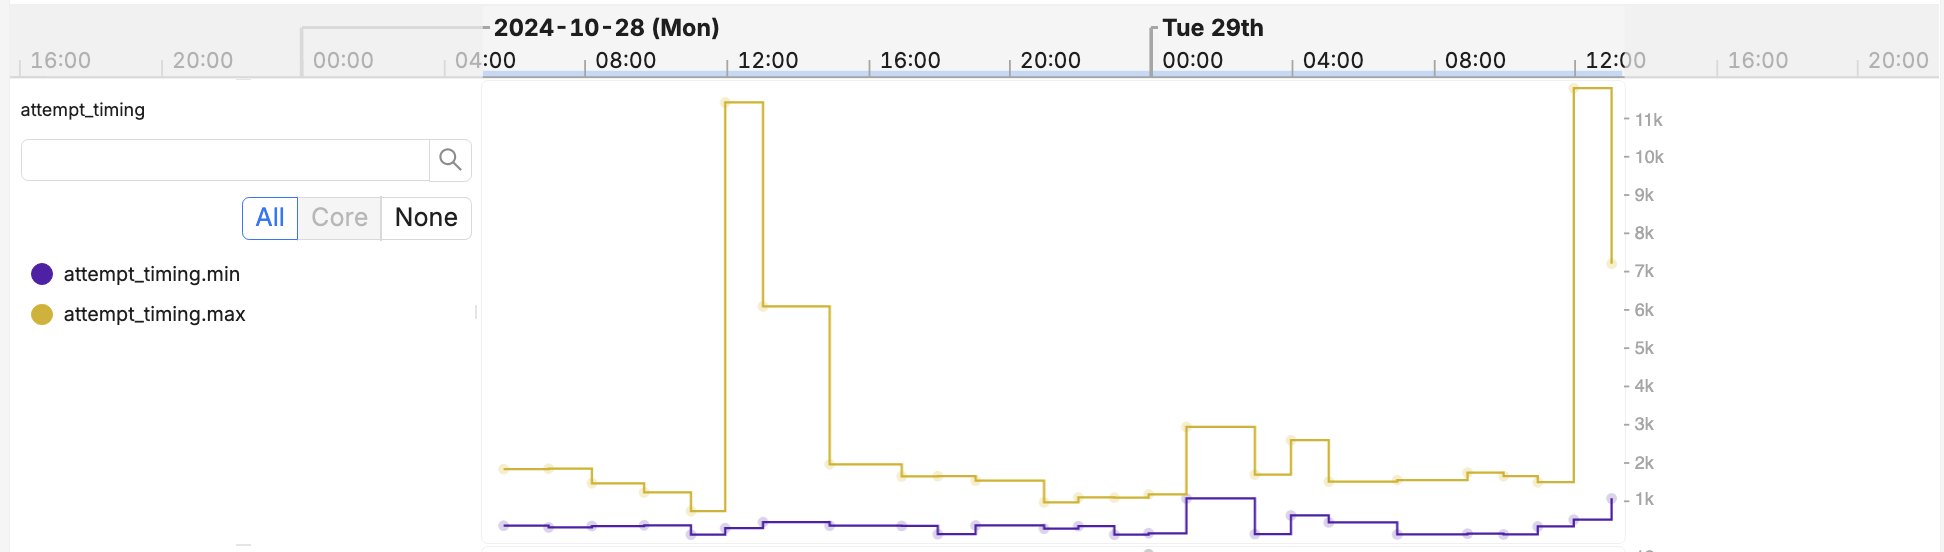
The same Distribution metric visualized in hourly heartbeats.
Distributions may be well suited to track selected metrics over time across the fleet, as Timeseries Metrics — while also useful on the Device Timeline as part of the Metric Report.
State Tracker
Tracks state transitions for visualizing on the Device timeline, and to perform time-based aggregations.
For example, we can use State Trackers to track the connection state of a peripheral device, or enabled state of a device function.
All States are represented as a series of Strings. For Kotlin and Java, convenience helpers are provided for tracking Enums and Booleans.
Usage
Create a state tracker named connection-state, tracking the total time spent
in each state:
- Kotlin
- Java
- C
- C++
enum class ConnectionState {
    DISCONNECTED,
    CONNECTING,
    CONNECTED,
}
private val connectionStateMetric =
    Reporting.report().stateTracker<ConnectionState>(
      "connection-state",
      statsAggs(StateAgg.TIME_TOTALS)
    )
enum ConnectionState {
    DISCONNECTED,
    CONNECTING,
    CONNECTED,
}
StateTracker<ConnectionState> connectionStateMetric = Reporting.report().stateTracker("connection-state", Arrays.asList(StateAgg.TIME_TOTALS));
metric_aggregation_t aggrs[] = {TIME_TOTALS};
metric_string_state_tracker_t connectionStateMetric = metric_report_string_state_tracker(report, "connection-state", aggrs, 1);
auto connectionStateMetric = report->stringStateTracker("connection-state", {TIME_TOTALS});
Then record state transitions as they occur:
- Kotlin
- Java
- C
- C++
connectionStateMetric.state(DISCONNECTED)
connectionStateMetric.state(CONNECTING)
connectionStateMetric.state(CONNECTED)
connectionStateMetric.state(DISCONNECTED)
connectionStateMetric.state(DISCONNECTED);
connectionStateMetric.state(CONNECTING);
connectionStateMetric.state(CONNECTED);
connectionStateMetric.state(DISCONNECTED);
metric_string_state_tracker_state(connectionStateMetric, "DISCONNECTED");
metric_string_state_tracker_state(connectionStateMetric, "CONNECTING");
metric_string_state_tracker_state(connectionStateMetric, "CONNECTED");
metric_string_state_tracker_state(connectionStateMetric, "DISCONNECTED");
connectionStateMetric->state("DISCONNECTED");
connectionStateMetric->state("CONNECTING");
connectionStateMetric->state("CONNECTED");
connectionStateMetric->state("DISCONNECTED");
This creates one metric for each state:
state_DISCONNECTED.total_secs: total seconds spent in theDISCONNECTEDstate in the reporting period.state_CONNECTING.total_secs: total seconds spent in theCONNECTINGstate in the reporting period.state_CONNECTED.total_secs: total seconds spent in theCONNECTEDstate in the reporting period.
Note that we used TIME_TOTALS for this example. There are three available
aggregation types, defined in StateAgg:
TIME_TOTALS | Creates a metric per state, totalling the time (in seconds) spent in that
state. Appends the |
TIME_PER_HOUR | Creates a metric per state, showing time per hour (in seconds) spent in
that state. This is useful if reports are not exactly one hour long.
Appends the |
LATEST_VALUE | Creates one metric in the report, with the last recorded value at the end
of the reporting period. This is similar to using a
|
Even if no aggregation types are requested, all state transitions will be displayed on the Device Timeline by HRT.
A State Tracker metric visualized in HRT.
The same State Tracker metric visualized in hourly heartbeats.
Tracking time spent in selected states may be useful to track across the fleet
using Timeseries Metrics, while
LATEST_VALUE could be an interesting
Device Attribute to filter devices.
String / Number Properties
Track device properties using these metrics. The last reported value will be included in the Metric Report, at the end of the reporting period.
Usage
Create string/numeric property trackers (named
device-color/first-boot-time):
- Kotlin
- Java
- C
- C++
val deviceColor = Reporting.report().stringProperty("device-color")
val firstBootTime = Reporting.report().numberProperty("first-boot-time")
StringProperty deviceColor = Reporting.report().stringProperty("device-color");
NumberProperty firstBootTime = Reporting.report().numberProperty("first-boot-time");
metric_string_prop_t deviceColor = metric_report_string_prop(report, "device-color", true);
metric_number_prop_t firstBootTime = metric_report_number_prop(report, "first-boot-time", true);
auto deviceColor = report->stringProperty("device-color");
auto firstBootTime = report->numberProperty("first-boot-time");
Then record values for these properties:
- Kotlin
- Java
- C
- C++
deviceColor.update("orange")
firstBootTime.update(1642794263)
deviceColor.update("orange");
firstBootTime.update(1642794263);
metric_string_prop_update(deviceColor, "orange");
metric_number_prop_update(firstBootTime, 1642794263);
deviceColor->update("orange");
firstBootTime->update(1642794263);
This creates one metric for each property, with the last reported value for each reporting period:
device-color.latest: the latest value of this string property.first-boot-time.latest: the latest value of this numeric property.
This metric can be disabled by setting addLatestToReport = false when creating
the metric (all values will still be displayed on timeline as part of HRT).
Properties are likely to be useful as Device Attributes, so that we can search the fleet for devices with specific properties (and create Device Sets based on them). Please note that you cannot create charts with String properties.
Event
Tracks individual events. When using HRT, these will be displayed individually on the device timeline.
Usage
Create a metric event named failure:
- Kotlin
- Java
- C
- C++
val failureEvent = Reporting.report().event("failure")
Event failureEvent = Reporting.report().event("failure");
metric_event_t failureEvent = metric_report_event(report, "failure", false);
auto failureEvent = report->event("failure");
Then record events:
- Kotlin
- Java
- C
- C++
failureEvent.add("timeout")
failureEvent.add("code 403")
failureEvent.add("timeout");
failureEvent.add("code 403");
metric_event_add(failureEvent, "timeout");
metric_event_add(failureEvent, "code 403");
failureEvent->add("timeout");
failureEvent->add("code 403");
By default, this will not include any metrics in the Heartbeat report. Values
will only be visible on timeline using HRT. To include an event count in the
report, set countInReport = true when creating the metric. This will create a
metric called failure.count.
This API will replace Custom Events in a future release.
Success or Failure
Available from Android SDK 4.11+ and reporting-lib 1.3+.
Tracks the count of successful and failed operations. This is currently built as
a convenience wrapper around 2 Counters. In the future, metrics
recorded using SuccessOrFailure may be visualized in a more special way on
Memfault's dashboard than just 2 Counters would.
Usage
- Kotlin only
val apiSuccessOrFailure = Reporting.report().successOrFailure("api")
...
if (apiResult.isSuccessful) {
  apiSuccessOrFailure.success()
} else {
  apiSuccessOrFailure.failure()
}
This will create 2 metrics called api_successful and api_failure, visible in
HRT, and usable as a Heartbeat metric.
Sync
Available from Android SDK 4.11+ and reporting-lib 1.3+.
Tracks the count of successful and failed sync operations. This API is used to integrate with Memfault's Core Metrics to track a device's overall connectivity profile.
Usage
- Kotlin only
val syncSuccessOrFailure = Reporting.report().sync()
This will update 2 metrics corresponding to sync_successful and
sync_failure. Memfault will
automatically generate insights
if these metrics are recorded.
Sessions
Sessions enables support for aggregations across variable durations, by associating metrics to an activity, rather than the hourly Heartbeat.
For example, it may be more useful to record the duration, battery consumption, and type of a workout "session", to validate that there is no regression in average duration length or battery, when rolling out an update to a specific workout type.
Unlike hourly heartbeats, sessions must be explicitly started and finished.
Session names must match the ^[a-zA-Z0-9-_.]{1,64}$ regex.
- Kotlin
- Java
- C
- C++
// Start the named session.
Reporting.startSession("session-name")

// Increment a counter on the named session.
Reporting.session("session-name").counter("session-counter").increment()

// Finish the named session.
Reporting.finishSession("session-name")
// Start the named session.
Reporting.startSession("session-name");

// Increment a counter on the named session.
Reporting.session("session-name").counter("session-counter").increment();

// Finish the named session.
Reporting.finishSession("session-name");
// Start the named session.
metric_report_t session = metric_session_start("session-name");

// Increment a counter on the named session.
metric_counter_t counter = metric_report_counter(session, "session-counter", true);
metric_counter_increment(counter);
metric_counter_destroy(counter);

// Finish the named session.
metric_session_finish(session);
// Create the session for reference.
auto session = std::make_unique<Report>("session-name");

// Start the referenced session.
session->start();

// Update a property on the referenced session.
auto property = report->numberProperty("session-property");
property->update(0.0);
property->update(1.0);

// Finish the referenced session.
session->finish();
Sessions are supported from Android SDK 4.17.0 onwards, and requires the latest reporting-lib on each platform (Maven reporting-lib 1.5).
Sessions are rate-limited per device per day, spread across your entire fleet. Please reach out to support to increase the quota.
Sessions do not currently render in HRT.
Recommendations
We recommend creating a wrapper class to define the metrics that you will use in your application. This could even be in a shared library, if you plan to record the same metrics from multiple applications.
package com.memfault.bort

import com.memfault.bort.reporting.NumericAgg
import com.memfault.bort.reporting.Reporting
import com.memfault.bort.reporting.StateAgg

enum class ConnectionState {
    DISCONNECTED,
    CONNECTING,
    CONNECTED,
}

object RecordMetrics {
    val rssiMetric = Reporting.report().distribution("rssi", NumericAgg.MEAN, NumericAgg.MIN)
    val connectionStateMetric = Reporting.report().stateTracker<ConnectionState>("connection-state", StateAgg.TIME_TOTALS)
    val disconnectionCounter = Reporting.report().counter("disconnection-events")
    val deviceColor = Reporting.report().stringProperty("device-color")
    val firstBootTime = Reporting.report().stringProperty("first-boot-time")
}
We can then record values from wherever we like in the application, without having to recreate the metric configuration:
RecordMetrics.disconnectionCounter.incrementBy(4)
RecordMetrics.rssiMetric.record(-43.67)
RecordMetrics.connectionStateMetric.state(CONNECTED)
RecordMetrics.deviceColor.update("orange")
RecordMetrics.firstBootTime.update(1642794263)
Troubleshooting
- If you record metric values but don't see them appearing in the Memfault
timeline:
- Check that one of more aggregations are defined, for
distributionandstateTrackermetrics — otherwise no aggregations will be created in each Metric Report. - Wait for the Android SDK to create the next Metric Report (roughly once per hour) - this is the same process which populates the built-in battery metrics on the device timeline (so you can tell when this has happened).
- Check that one of more aggregations are defined, for