March 2024
Correlate Issues with Device Attributes
Users can now view the distribution of issues by device attributes in the issue view. Within the issue view users can now select an attribute from the drop down and see the distribution of that specific issue by the attribute selected in the same way as you can see distribution of issue by software version or hardware type. This is an extremely powerful tool to identify correlations between issues occurring across your fleet and things like production batch or device tree information such as chip type.
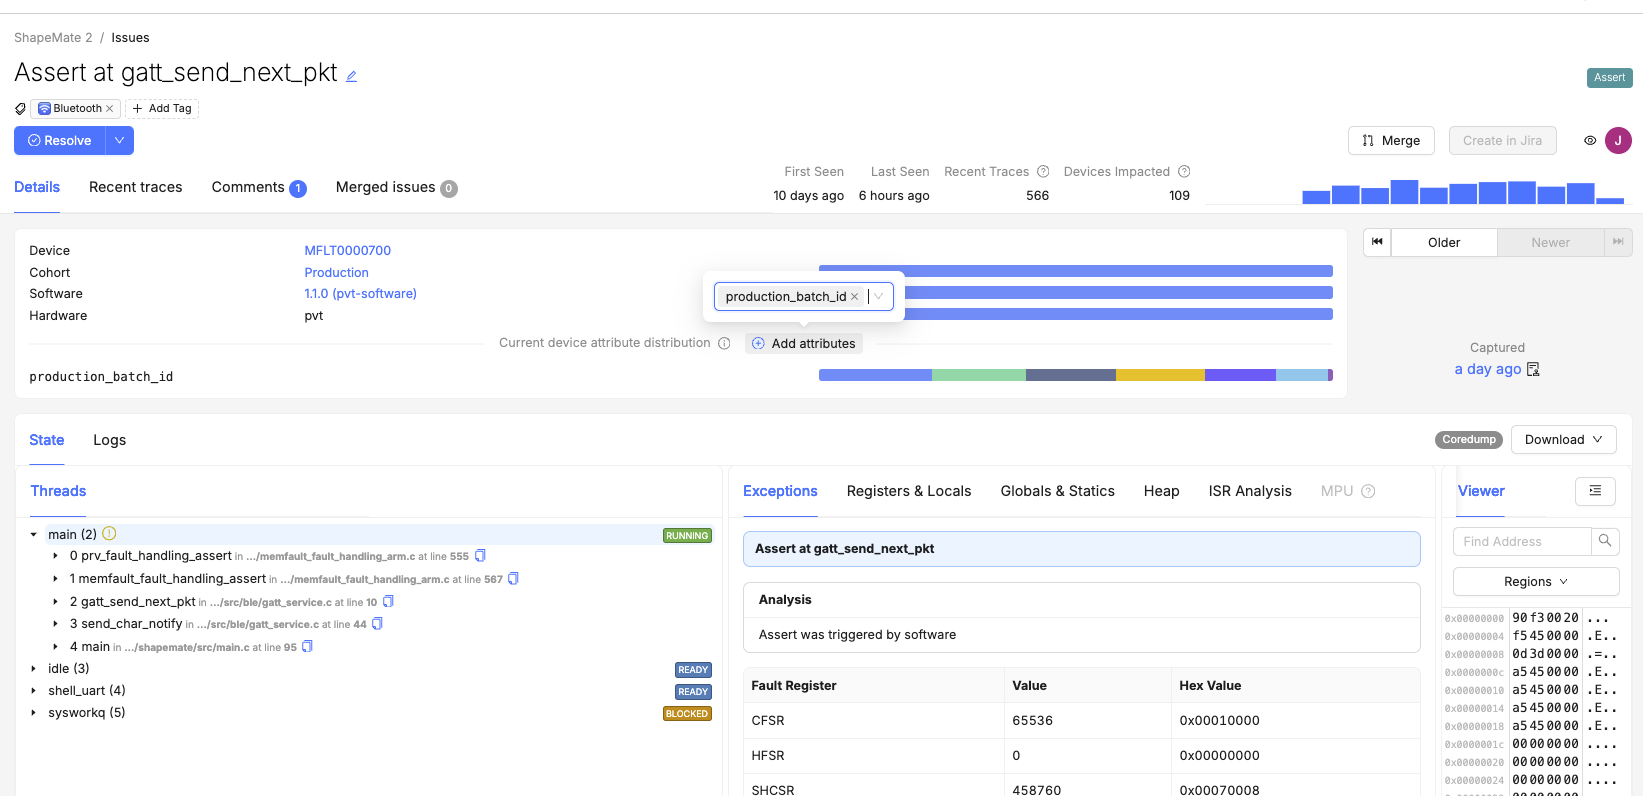
Currently correlations are best used for attributes that are fixed for the life of the device because the correlation is based on the most recently reported state of the attribute on the device and not the attribute at the time the issue occurred. This means it’s good for correlating with things like production batch, and not good for correlating with things like state of charge. For more information on issue attribute correlation please read our technical documentation.
Device Vitals: Improved Searching and Filtering
We have made a number of enhancements to our Device Vitals feature set designed to make it easier to go from top level insight to device level investigation. Firstly, we have introduced a set of templated dashboards for each Device Vital that can be selected when creating a new dashboard and will pre-populate with our recommended chart and card types.
We have also introduced two ways to get to a list of devices based on their performance on a specific Device Vital either by drilling down from a Device Vitals percentiles chart, or using Device Vital readings as a filter in device search.
We believe that some combination of Device Vitals should be central to the way teams measure the performance of devices and making it easier to get the insights and act on them unlocks more value, more easily. You can read more about all of our Device Vitals functionality in Memfault’s technical documentation.
Improved Device Timeline Navigation
We made several enhancements and improvements to the navigation experience within device timeline based on user feedback. The improvements include adding a time interval selection (e.g. 1 day or week), zoom and pan buttons.
Device timeline is central to the value Memfault provides, giving you the complete context of what’s happening on your devices. These improvements make it easier to isolate specific points of interest within the device timeline and move through the timeline more easily.
General
- Added: More functionality to enable monitoring and debugging with
Device Vitals:
- Filtering Devices by Device Vitals values on the Device Search page
- Ability to drilldown from percentile charts to a list of Devices
- Foundational Dashboards available out of the box for Device Vitals (Stability, Connectivity, Battery), Android, and Linux.
- Added: New Current Device Attribute distribution feature to analyze how different Device Attribute values correlate with an Issue across your fleet. This analysis is performed in real-time, reflecting the current state of Device Attributes when you load the Issue page.
- Added: Link from the device detail page to the Processing Log, automatically filtering logs on that device specifically.
- Added: Show Cohorts for which Releases are active & whether Release is must-pass-through in Release list page, and added additional filtering and sorting.
- Added: Display warning message when one or more populations in a percentile chart contains less than 100 devices. Interpolation of values is likely to happen and this can be confusing to the user.
- Added: Display comment count on Issue search results.
- Added: A button to copy a stacktrace entry filepath to the clipboard on the Issues page.
- Improved: Device Timeline now enables zoom in and out, plus step forward and backwards in time at a selected interval (e.g., 15 minutes, 1 hour, 1 day).
- Improved:
Device search
response speed improvements, re-enabling
last_seenas the default sorting order. - Improved: Pages within the project empty due to lack of data now have more prompts for how to get started with Memfault.
- Improved: Various UI glitches and improvements (filter error appearing when searching by “Last 7 days” in Issues, passing missing device filters from Reboot Reasons chart to the device search, display columns without overflowing on Issues search, show archived metrics toggle on Metric Settings)
- Changed: Increased the file size limit for symbol file uploads from 250mb to 500mb.
- Changed: Increased the friction for more dangerous OTA settings by adding a confirmation toggle.
MCU
- SDK versions
1.7.2,
1.7.3,
1.7.4,
and
1.7.5
were released. Some highlights:
- Added: New Kconfig flags in Zephyr for Memfault Core Metrics. See the documentation on Core Metrics for more information.
- Added: The Memfault Self-Test component boot check now prints all components that are booted (previously only un-booted components would print).
Android
- SDK version
4.14.0
was released. Some highlights:
- Added: A Windows batch script to install Bort Lite.
- Changed: Core battery metrics are not reported when there is no discharge (including on devices with no battery).
- Changed: When installing Bort Lite, automatically enable Dev Mode and collect metrics.
Linux
- We did not publish a new version of the Linux SDK in March 2024.
CLI
- CLI version 1.0.9 was
released:
- Add Miniterm help text when launching the
memfault consolecommand, to indicate how to exit the console (Ctrl-]).
- Add Miniterm help text when launching the