Introduction to Memfault
Memfault is a cloud platform that allows you and your team to continuously monitor devices, debug firmware issues, and deploy OTA updates to your fleet to ship hardware products at the speed of software.
- Memfault is embedded-first: embedded systems and devices running on any RTOS or operating systems such as Android or Linux are supported.
- It runs on any device: from powerful SoCs down to MCUs with the most constrained capabilities, Memfault will fit into your device's available flash, RAM, and bandwidth.
- Our SDKs are made with low and intermittent connectivity in mind: if your device can only send out a small amount of data, you'll be able to ration it in chunks of the size you choose, and we'll take care of transporting it for you. If your device relies on a companion (such as a mobile phone) for Internet access, you can use it as a bridge. You can also post data directly from your device.
- Privacy is built into Memfault: you have full control over what your Memfault-enabled devices send to our servers.
Our platform is a one-stop shop for:
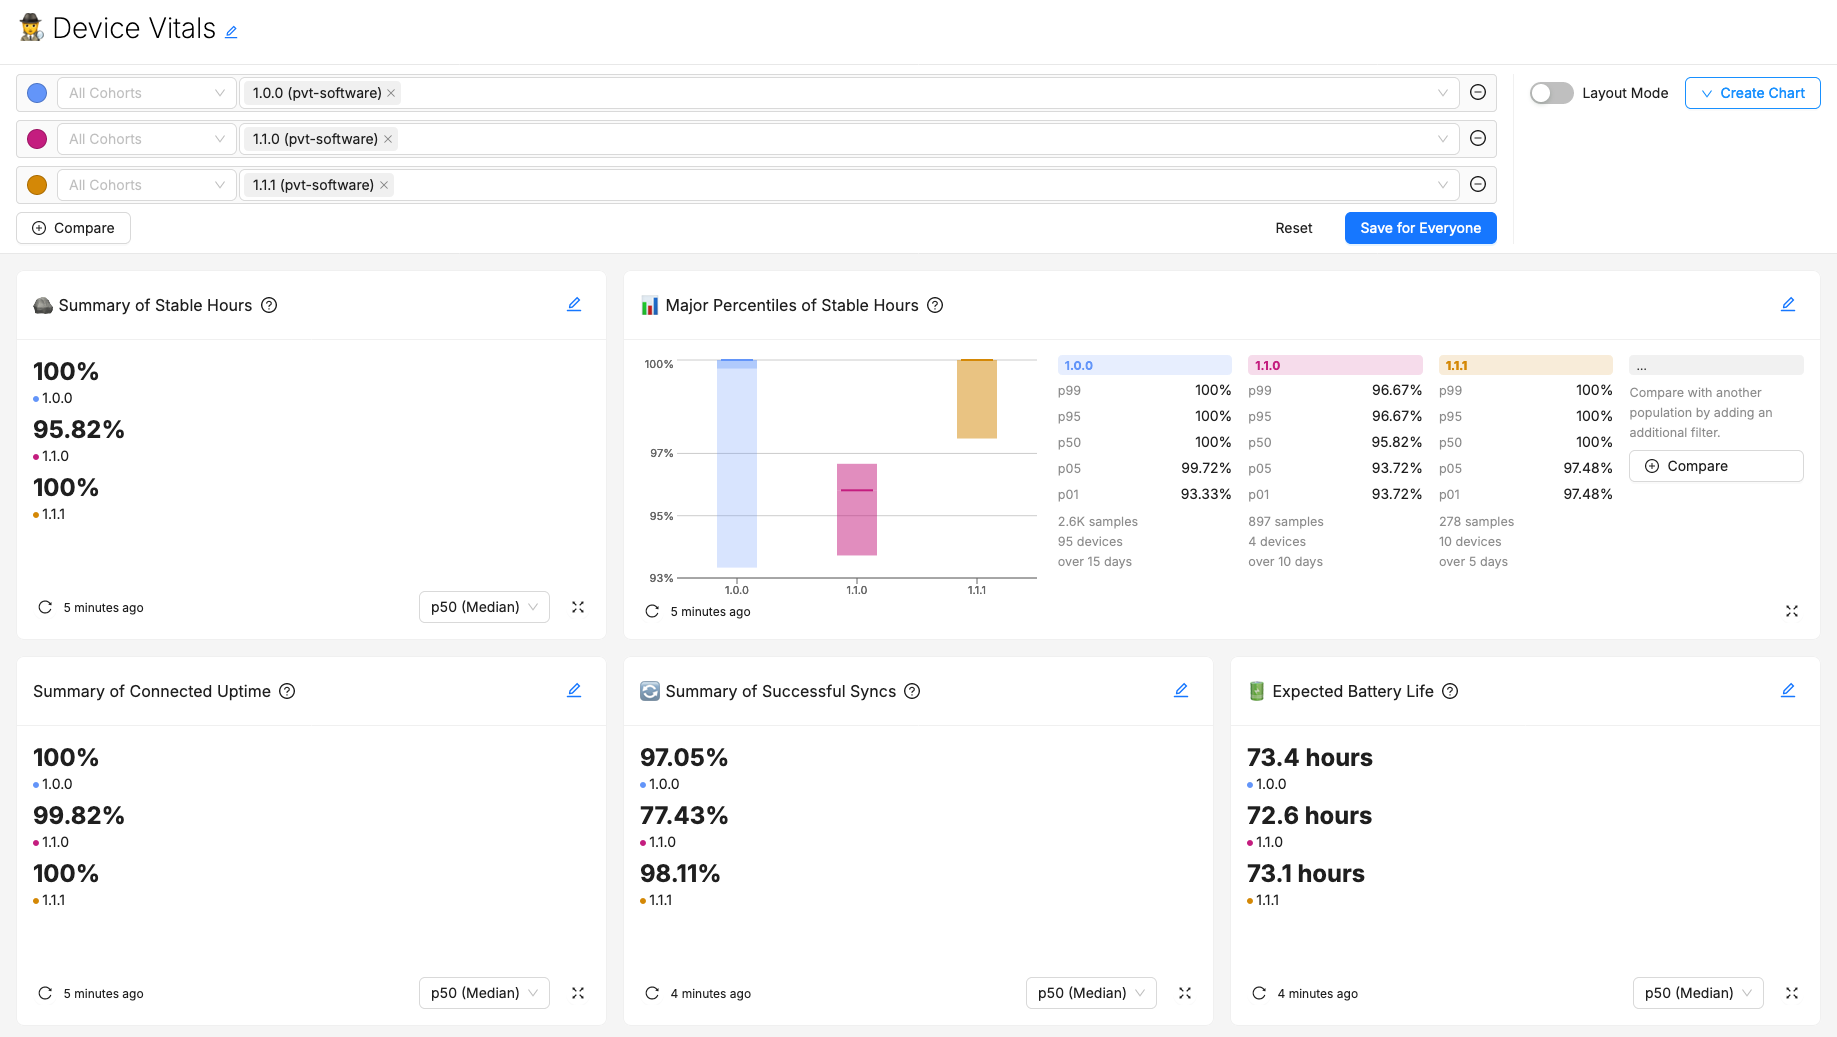
Memfault provides rich and detailed insights into your devices' behavior out of the box, and are highly configurable to fit your needs.
Our recently released Device Vitals provide out-of-the-box insights for your devices 🎉 (read more in the documentation).
Debugging
On your devices, Memfault keeps track of crashes automatically and will make crash reports available to you on the Memfault web application as soon as they're uploaded.
Our web application offers a rich and complete view into your collected MCU traces and Android exceptions and Bug Reports. With them, there's no need ship the device to your facility, or attach a debug probe to it. Even if you have the device at hand, you'll find Memfault traces to be a better place to debug, thanks to many helpful visualizations and connected data we display from our parsing. You'll find Memfault traces are useful to you even during development.
Reproducing customer issues is easier than ever before. Consider a workflow where a customer support agent files a ticket for engineering that already includes a Memfault link to the particular device that's having issues, or even a link to the trace itself.
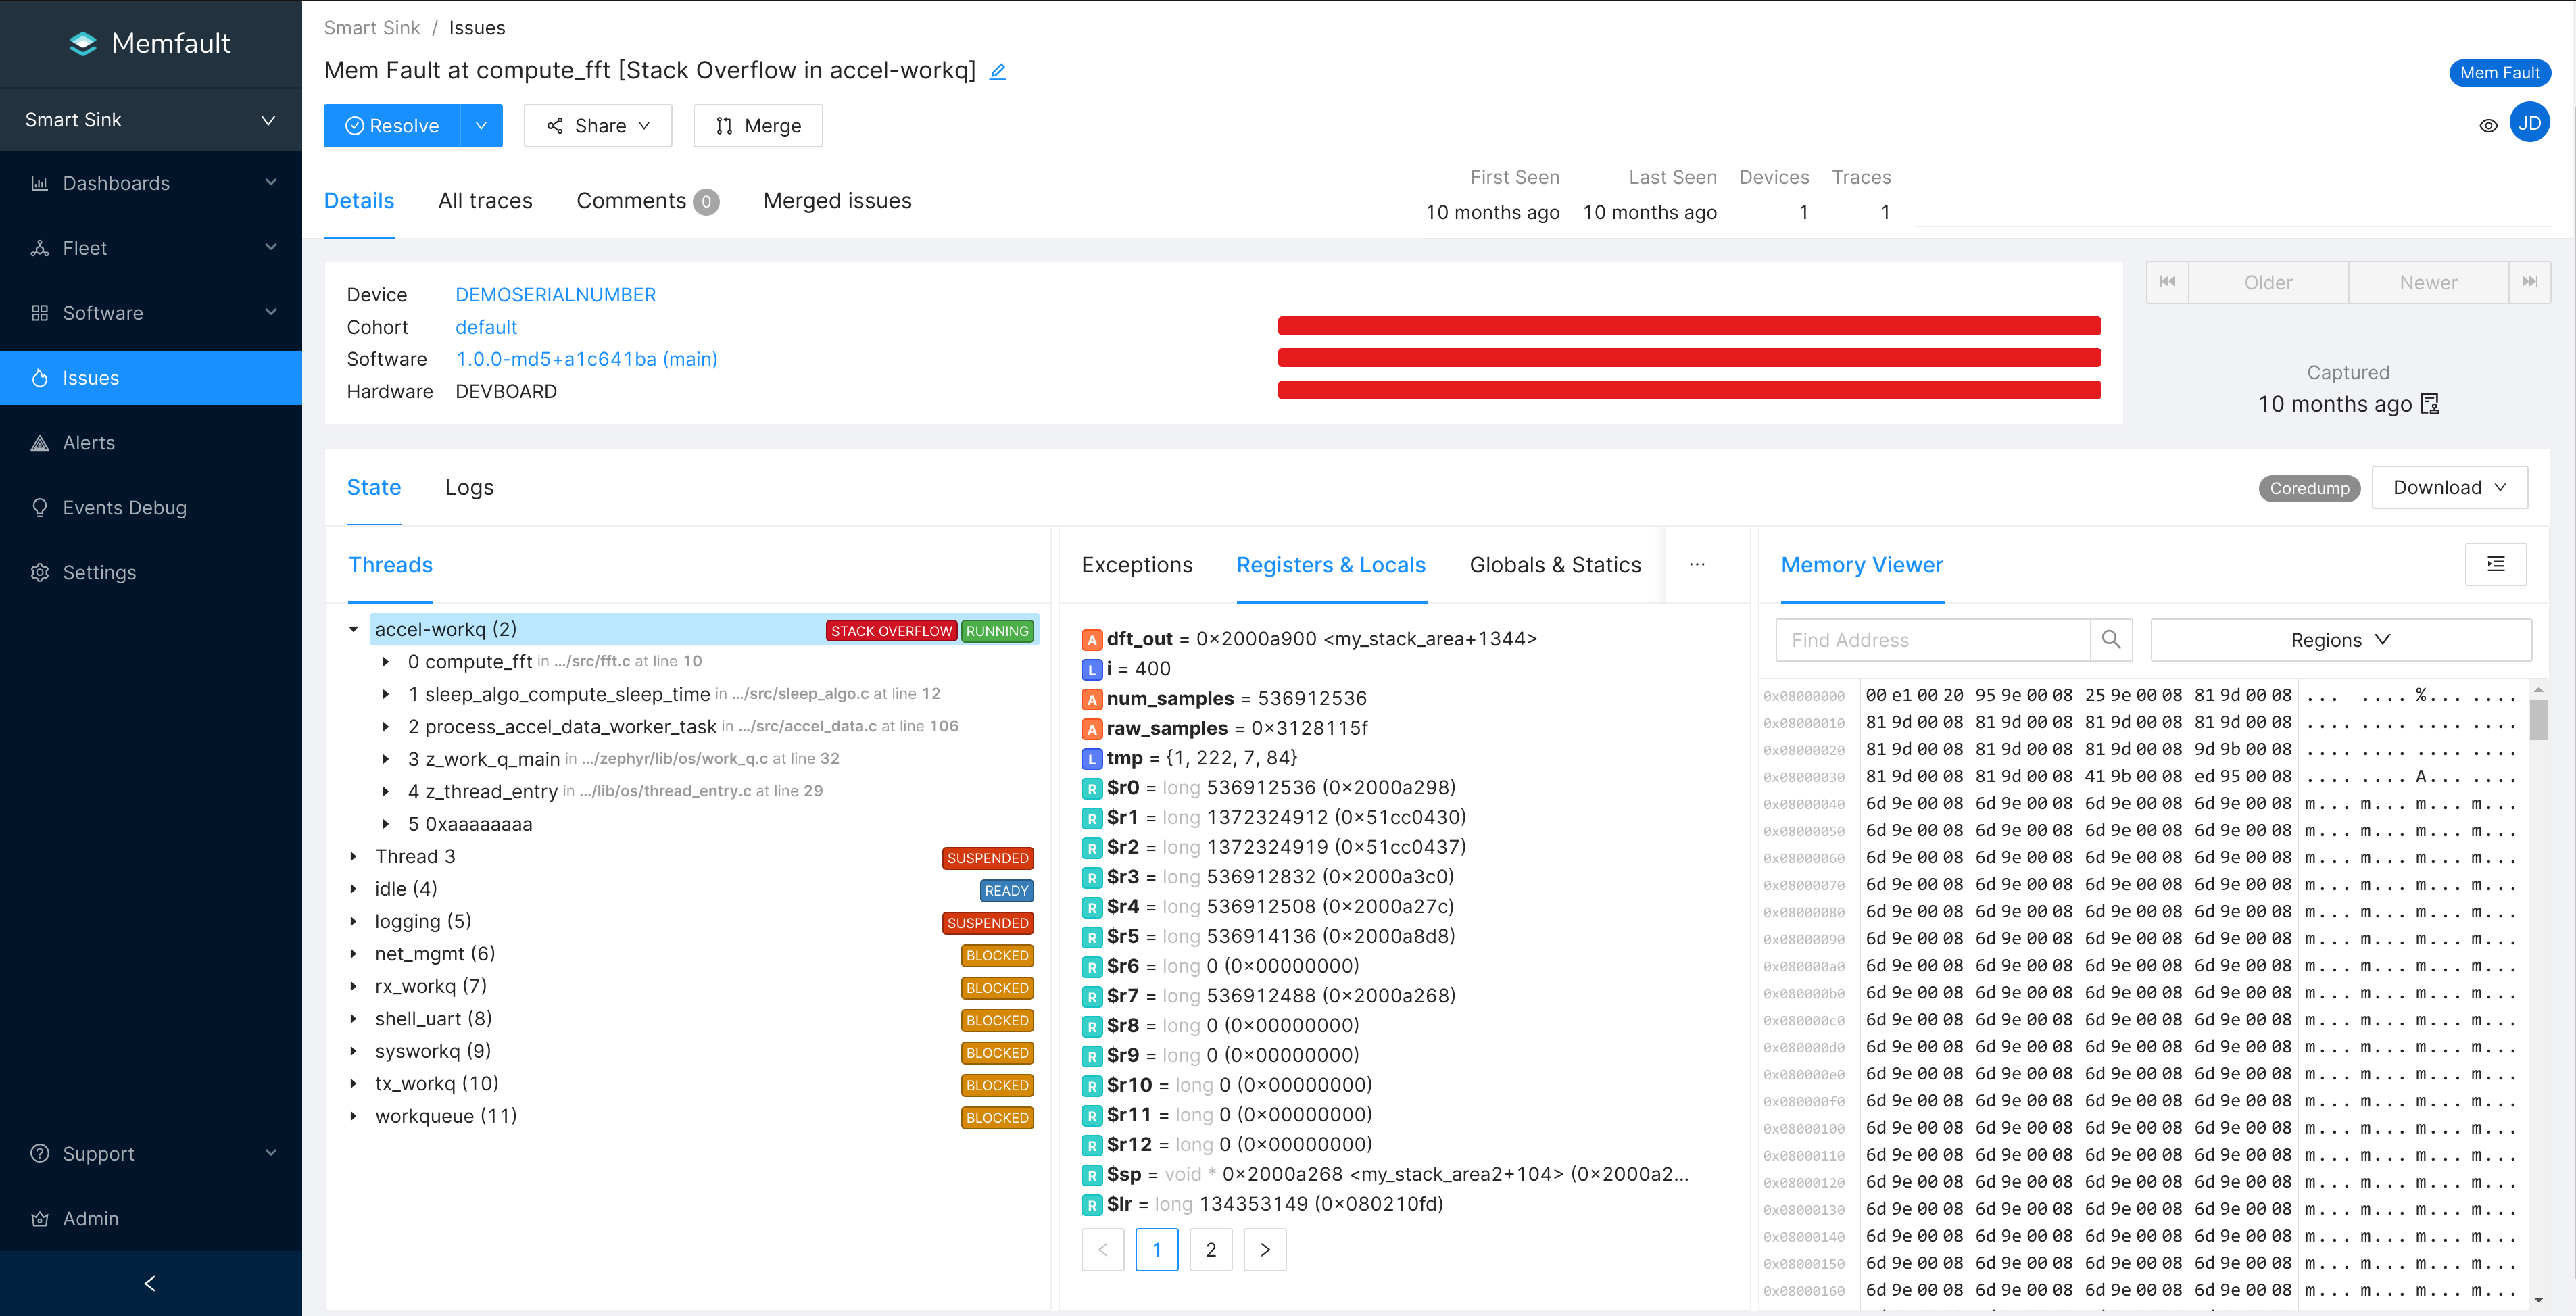
Our trace analysis view offers the highest resolution available into the crash dumps your devices upload. In this example, you can see the values of local variables and registers at the time of the crash.
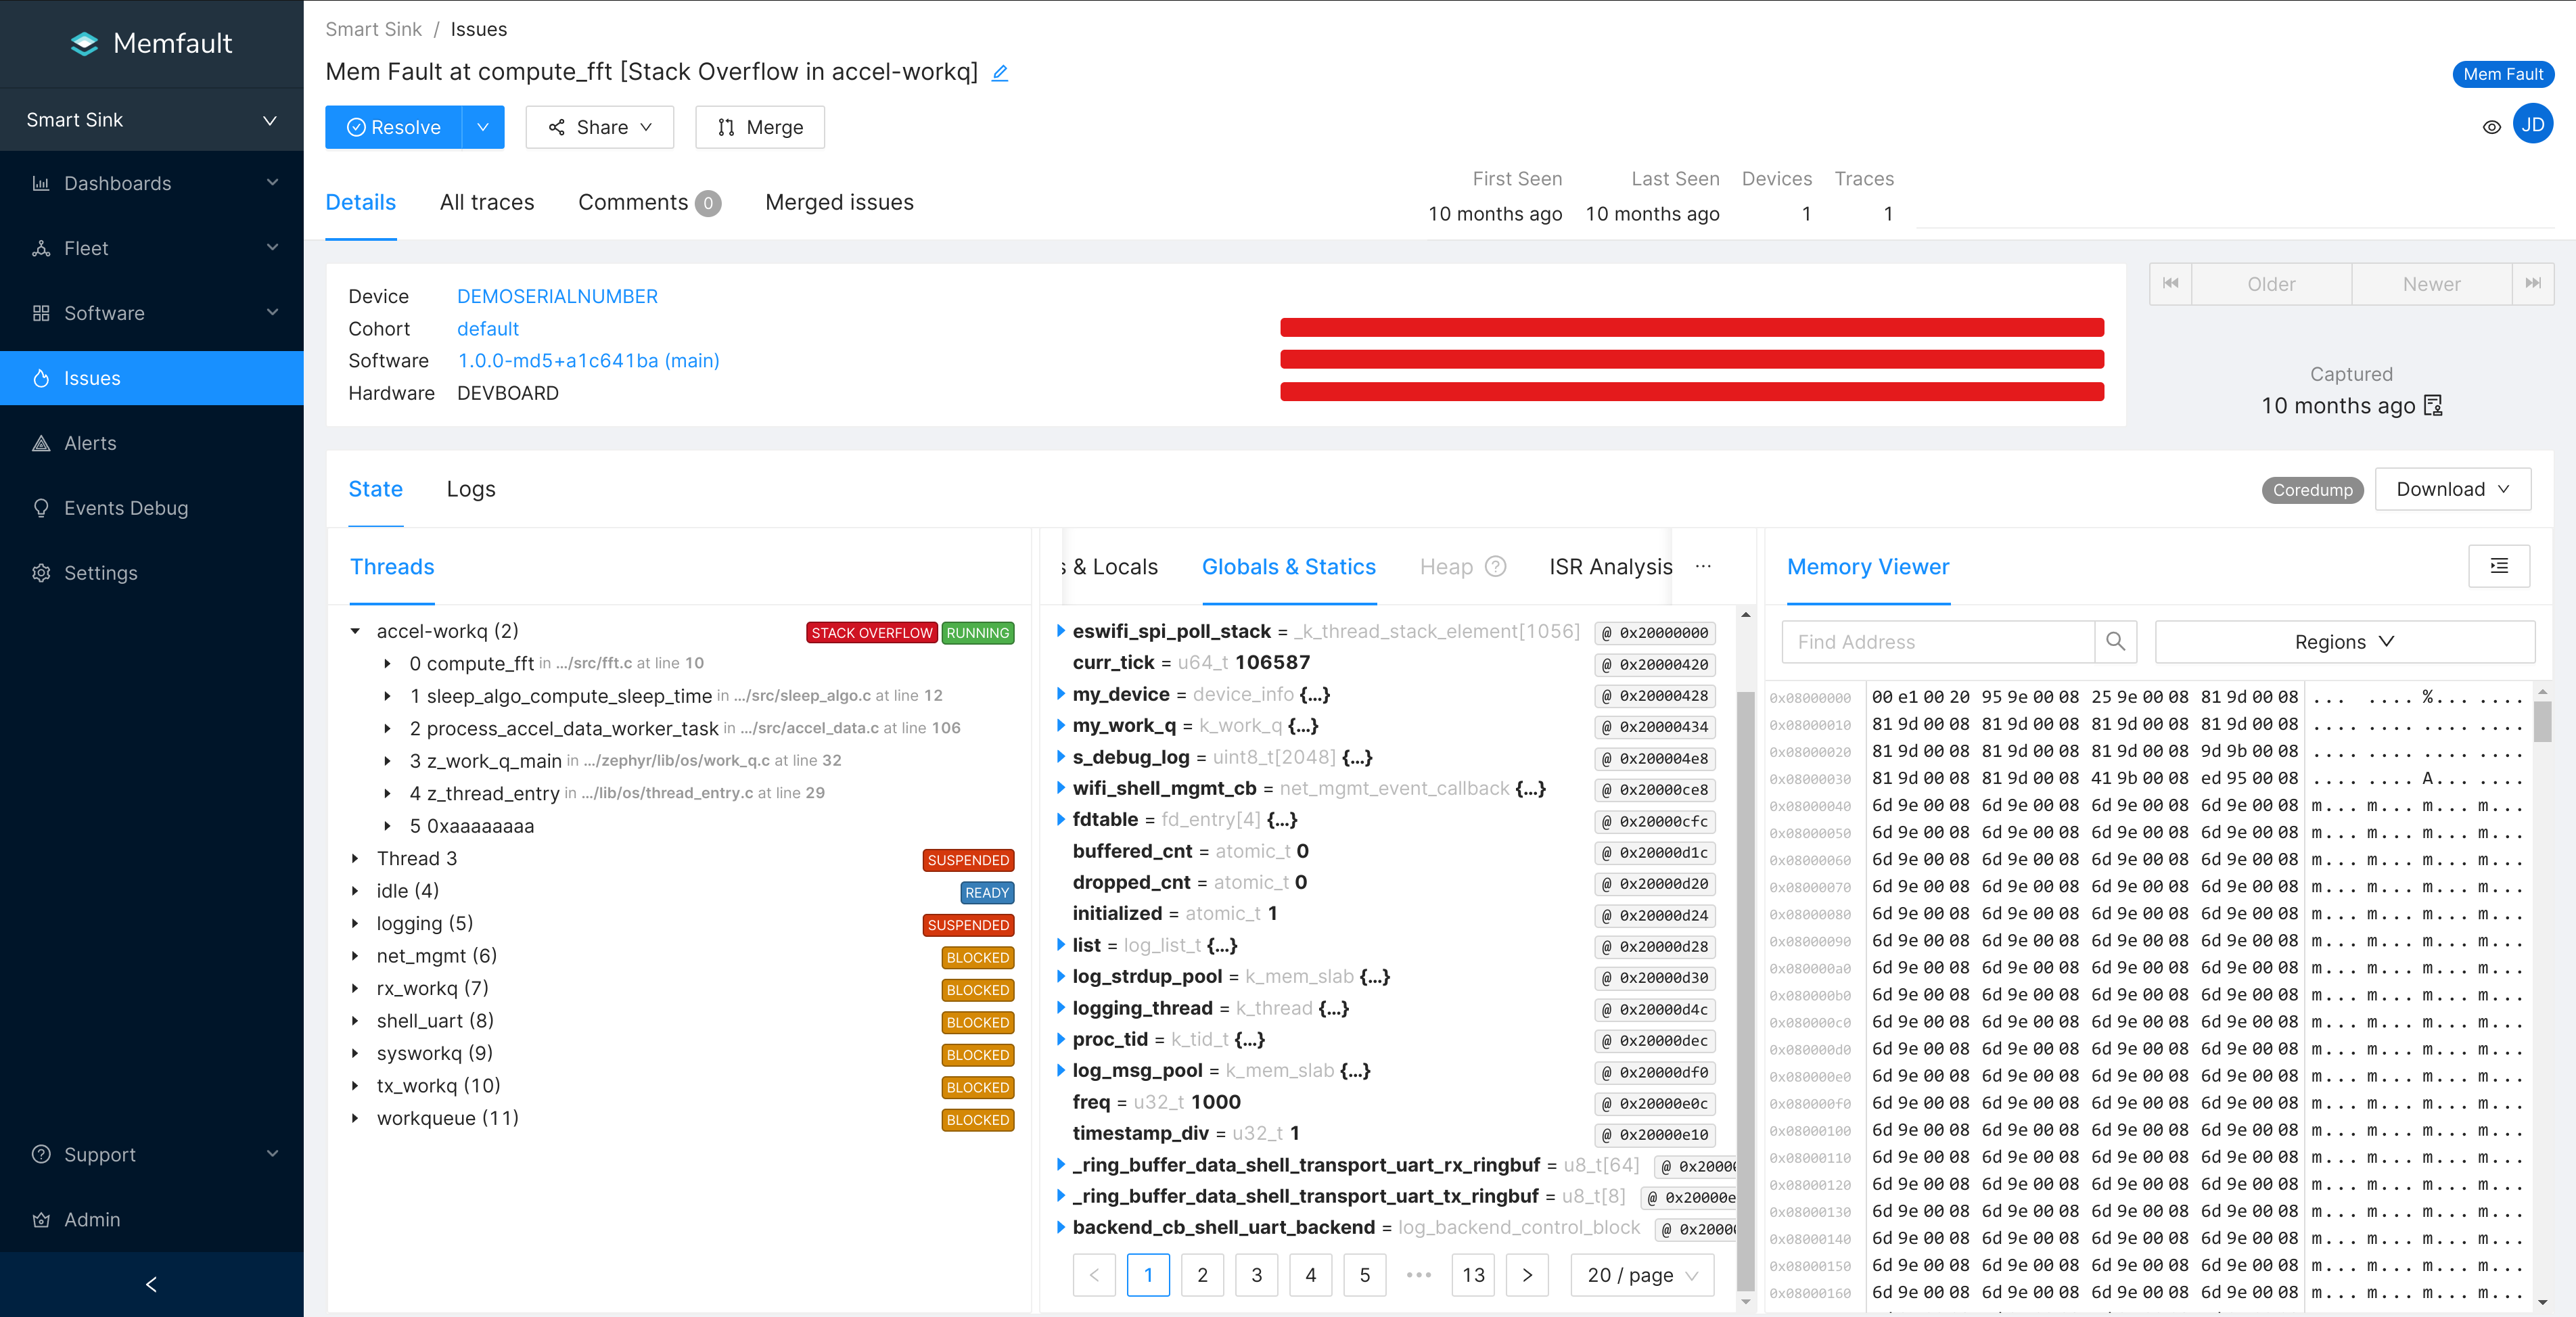
The Memfault Web Application performs crash symbolication on your devices' traces and allows you to dig deep into the state of the device, right from your browser.
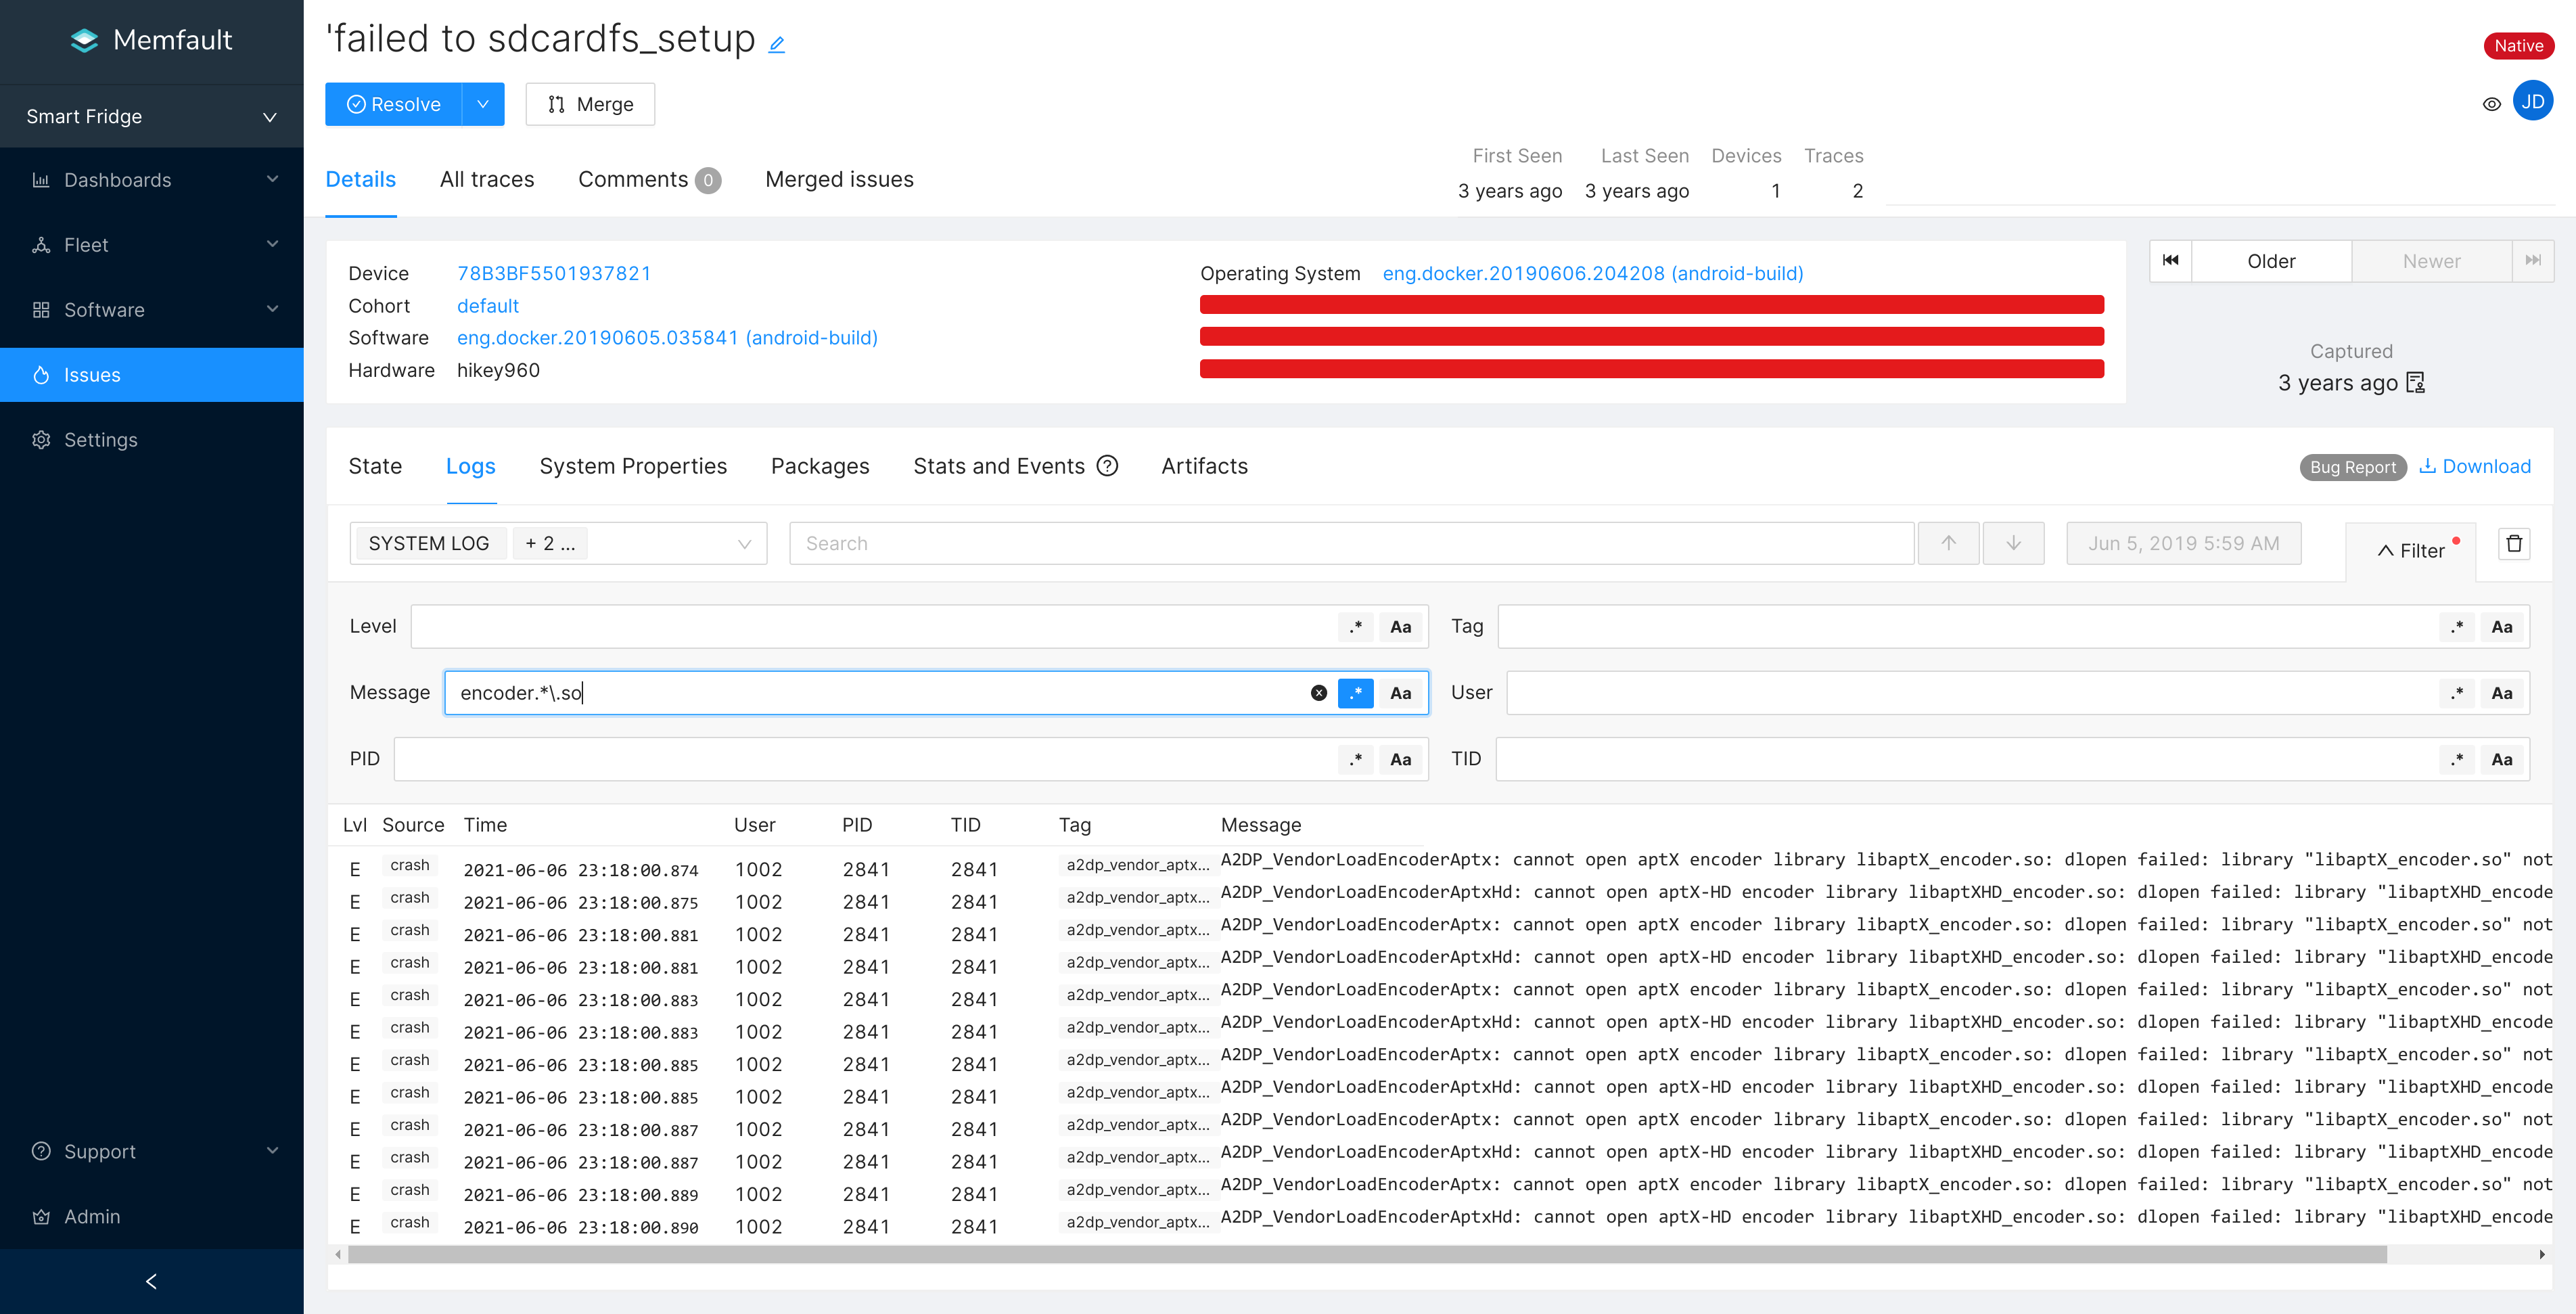
Read logs relevant to each trace and perform complex text searches.
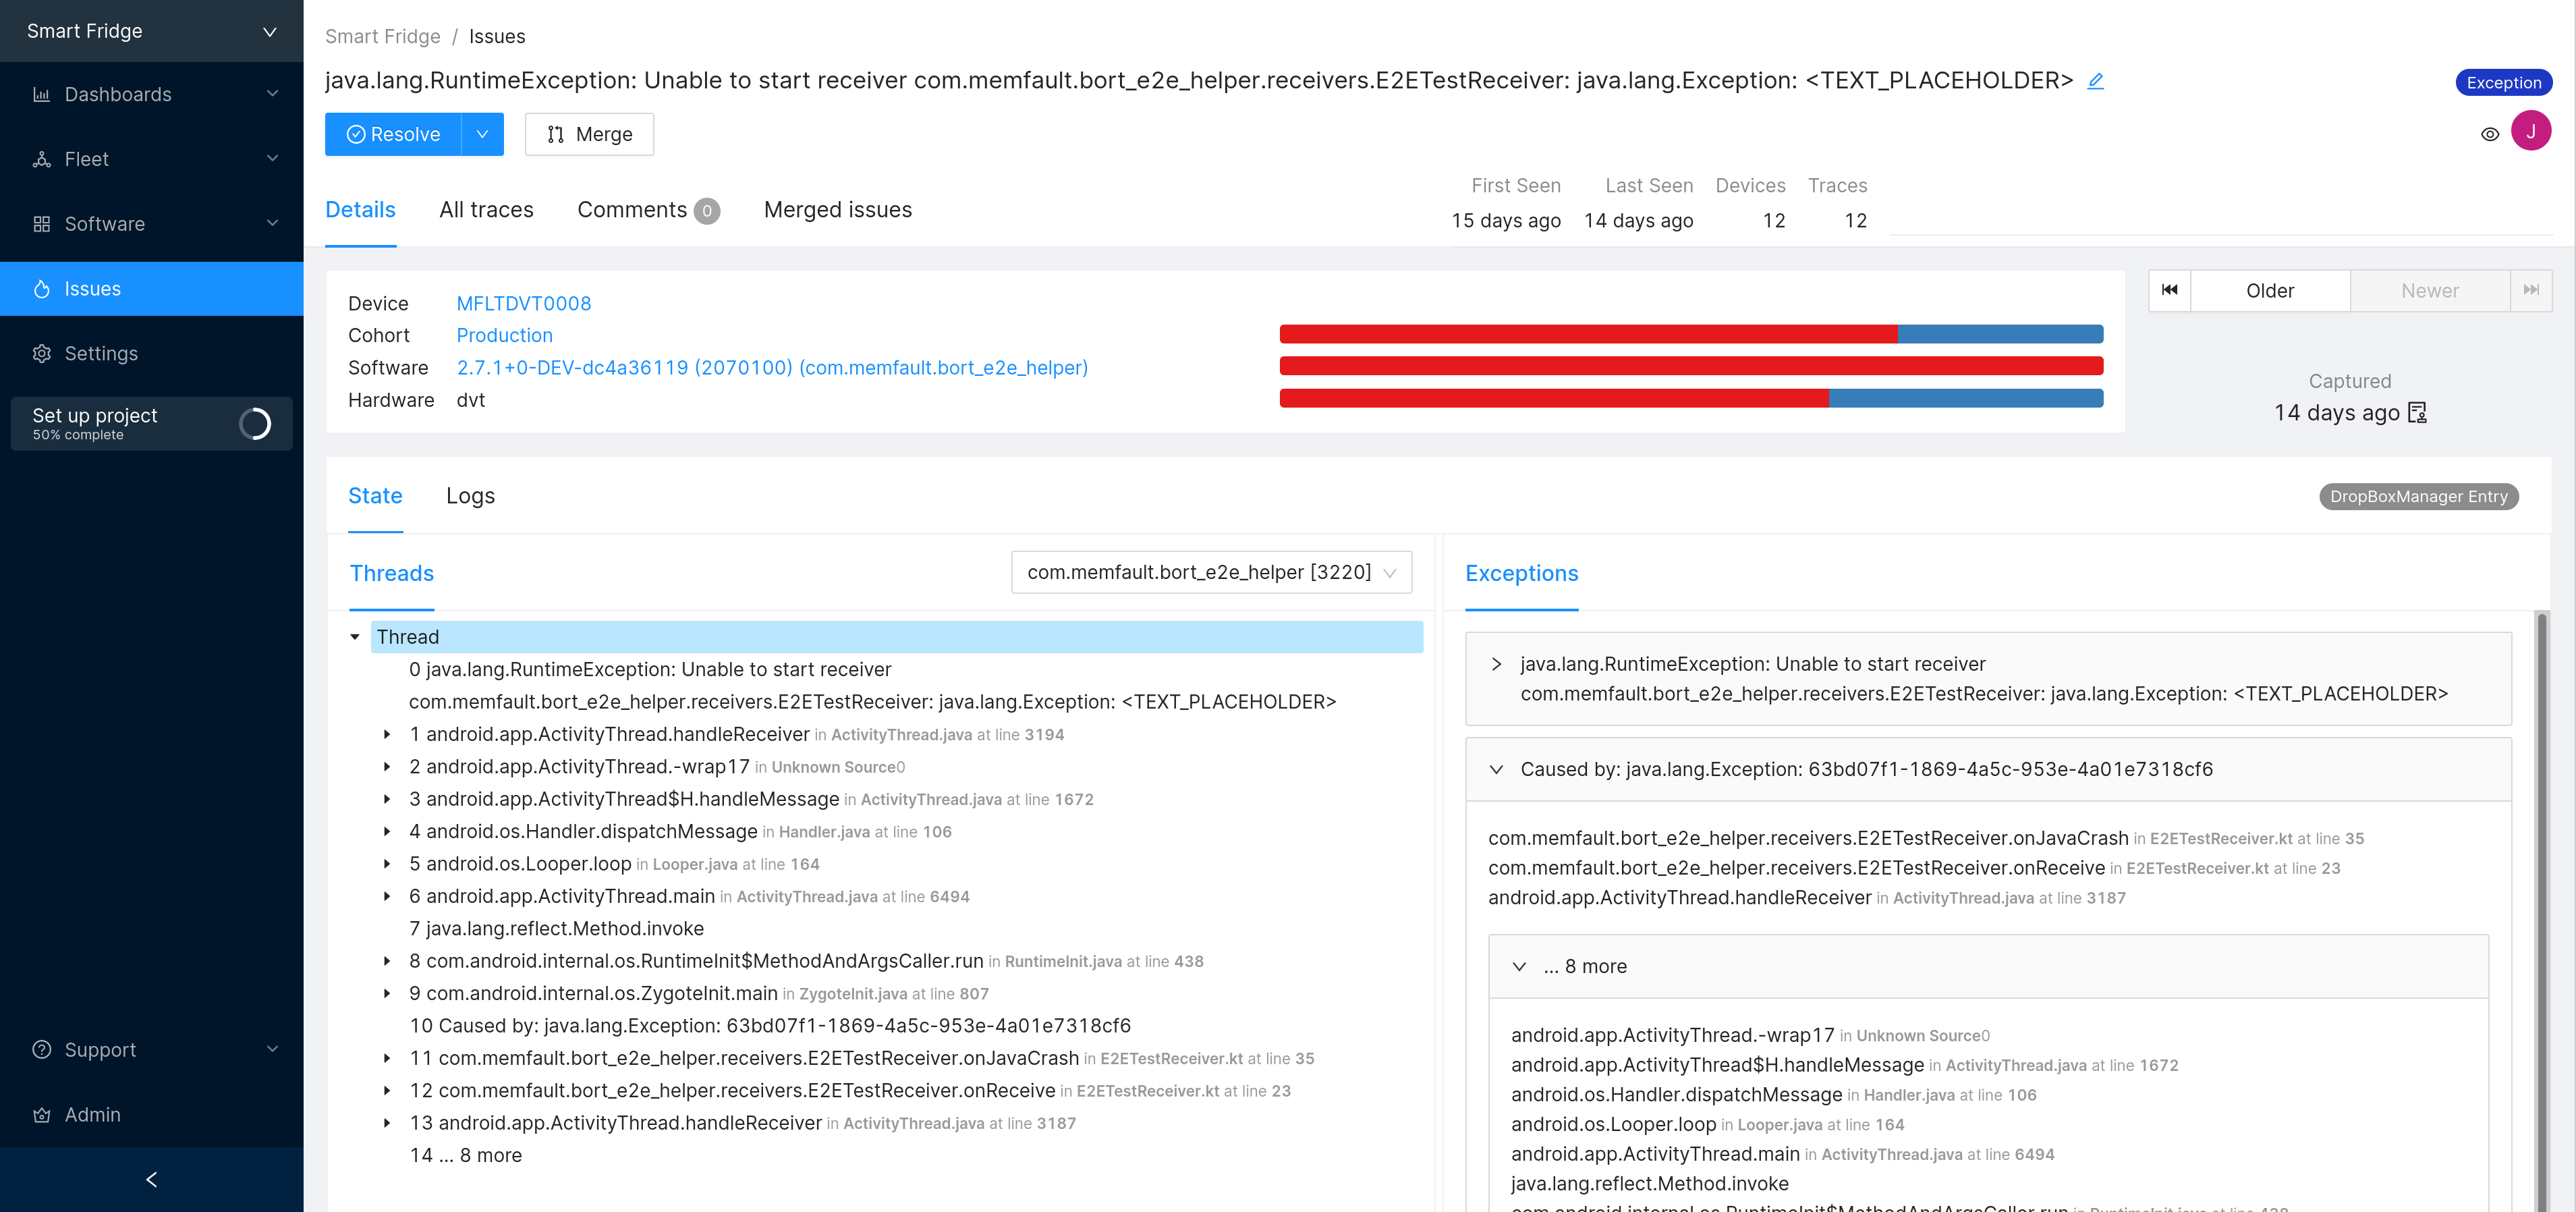
An example of a root-cause analysis for a Java runtime exception from an Android device.
Memfault traces are grouped together during processing, so that you don't have to look at every single instance of a problem. A group of collected traces with matching error reasons is called an Issue in Memfault. Even after grouping, you can still access all available traces of an Issue.
To learn more about debugging and set it up for your project, continue on to:
Over-the-Air (OTA) Updates
Memfault changes the way teams prepare updates. Instead of handing a pilot device over to QA and waiting for bugs to be found, to then fix them and repeat the process, consider the following workflow:
Traditionally, the process looks like this: hand a pilot device over to QA and wait for bugs to be found, to then fix them and repeat. Memfault changes and improves upon this process. Consider the following additions to that workflow:
- Using Memfault Cohorts, split your devices into a production Cohort and a beta Cohort.
- Configure an automatic update for devices in the beta Cohort.
- Measure success metrics via Monitoring, number of reboots or crashes.
- Once your software is ready, enable the update for all production devices.
Memfault OTA updates enable this streamlined workflow as well as complex setups that may include staged rollouts (aiming at only a fraction of your population), delta releases (also known as incremental updates), and many more representable scenarios.
Memfault OTA updates provide increased velocity, reduce the risk of rolling out an update, and offer visibility into team productivity.
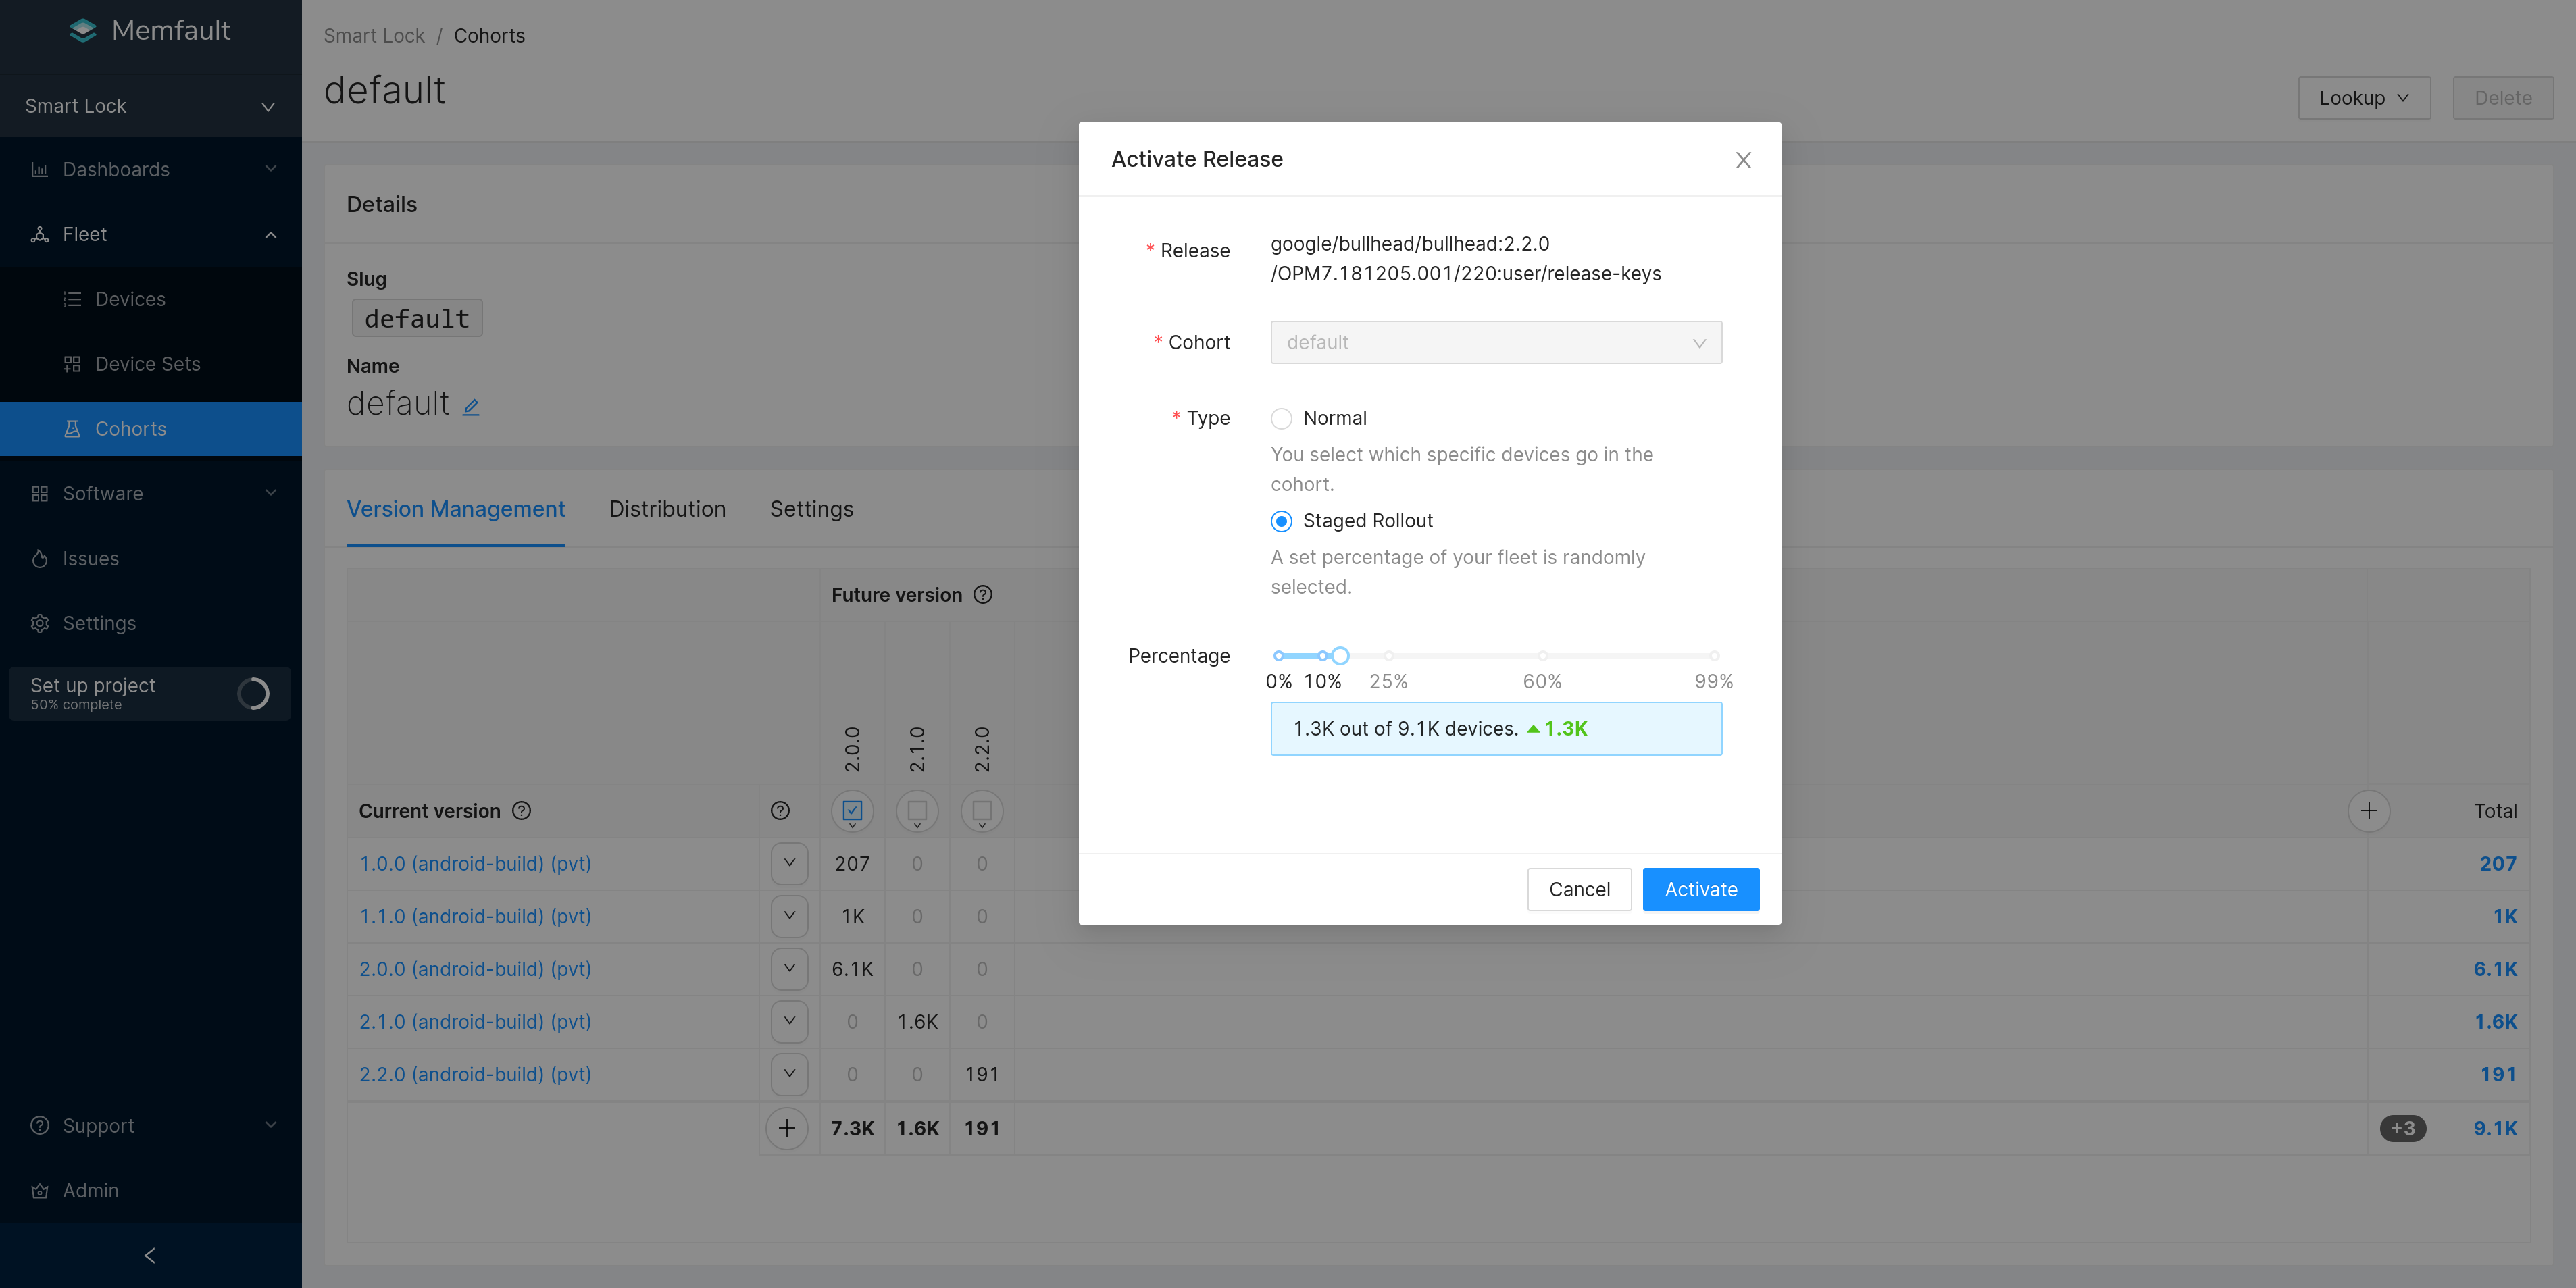
Activating a staged rollout to test version 2.2.0 of our product.
Around 1.3K devices out of 9.1K in this fleet will receive the latest version
as a canary release, and the team will monitor the behavior of the new
firmware.
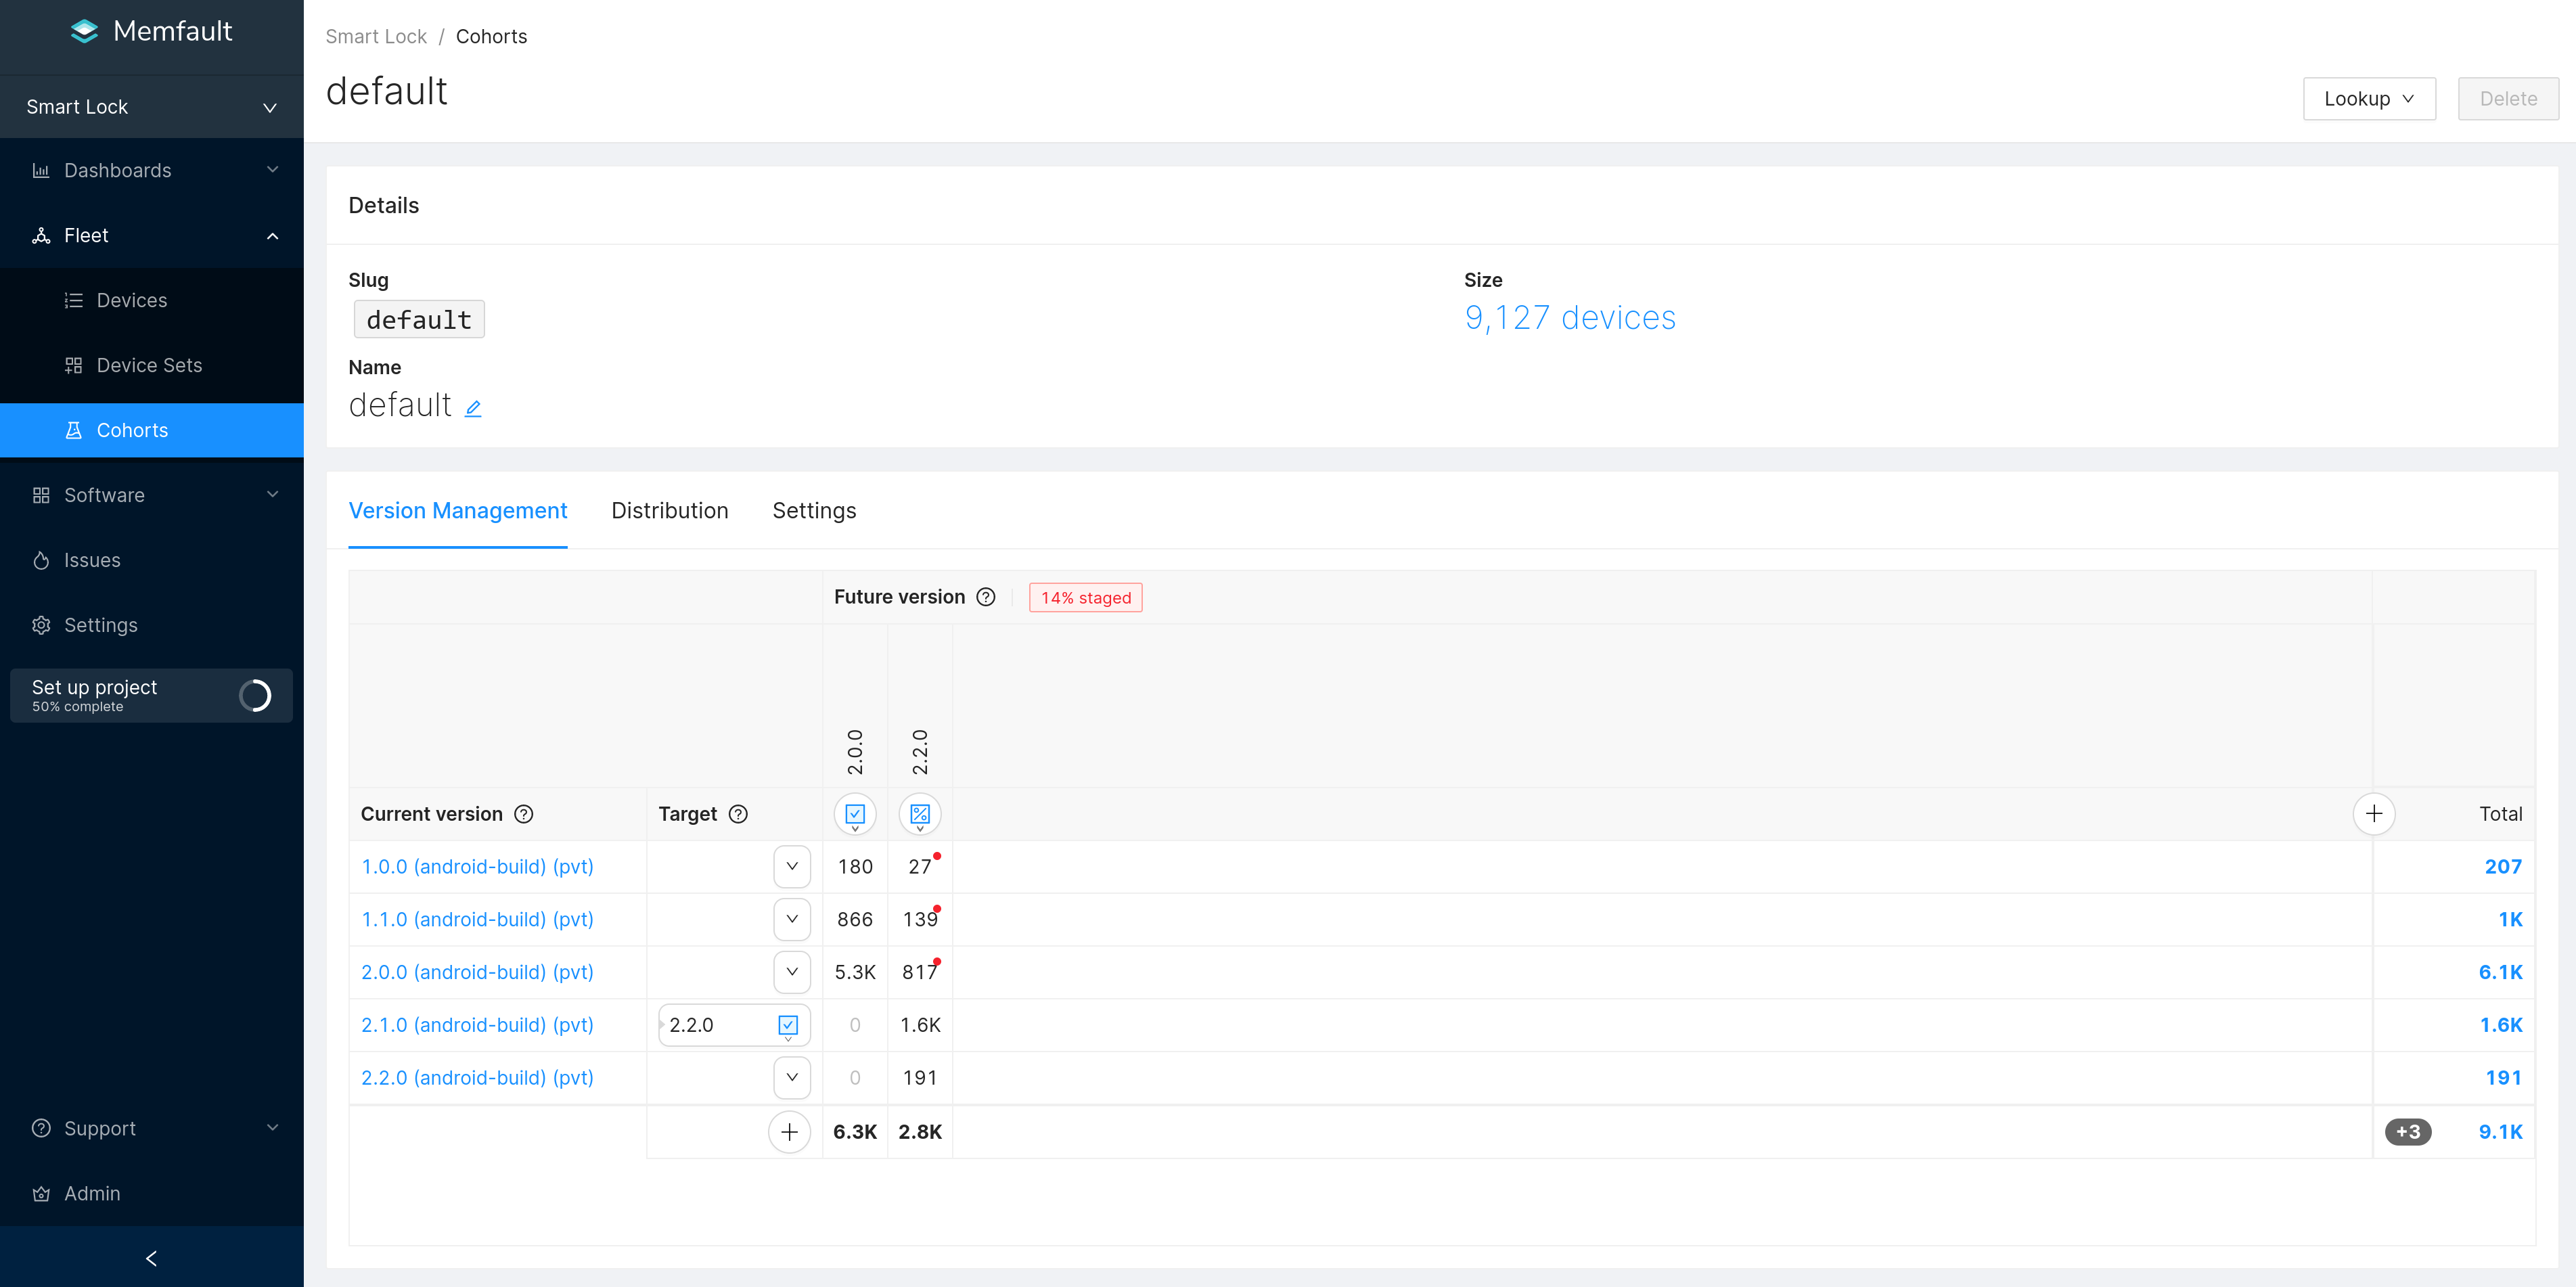
A view into the current state of this Cohort of 9.1K devices and the next OTA payload they will be downloading.
To benefit from the increased velocity while still maintaining the high standards of quality required by the nature of hardware products, use the rest of the Memfault feature suite: Debugging and Metrics.
To learn more about OTA updates and set up your project to use them, continue on to documentation on OTA updates.
Monitoring via Metrics
Memfault makes it easy to collect new data from your devices. In any of our SDKs, it's a matter of writing two lines of C or Kotlin. Since Memfault takes care of the plumbing and the multipart transport, adding a new metric does not involve data scientists, your web backend team, or your mobile app developers.
Adding metrics to your Memfault integration unlocks many features whose value compounds with all other features of Memfault.
Device metrics
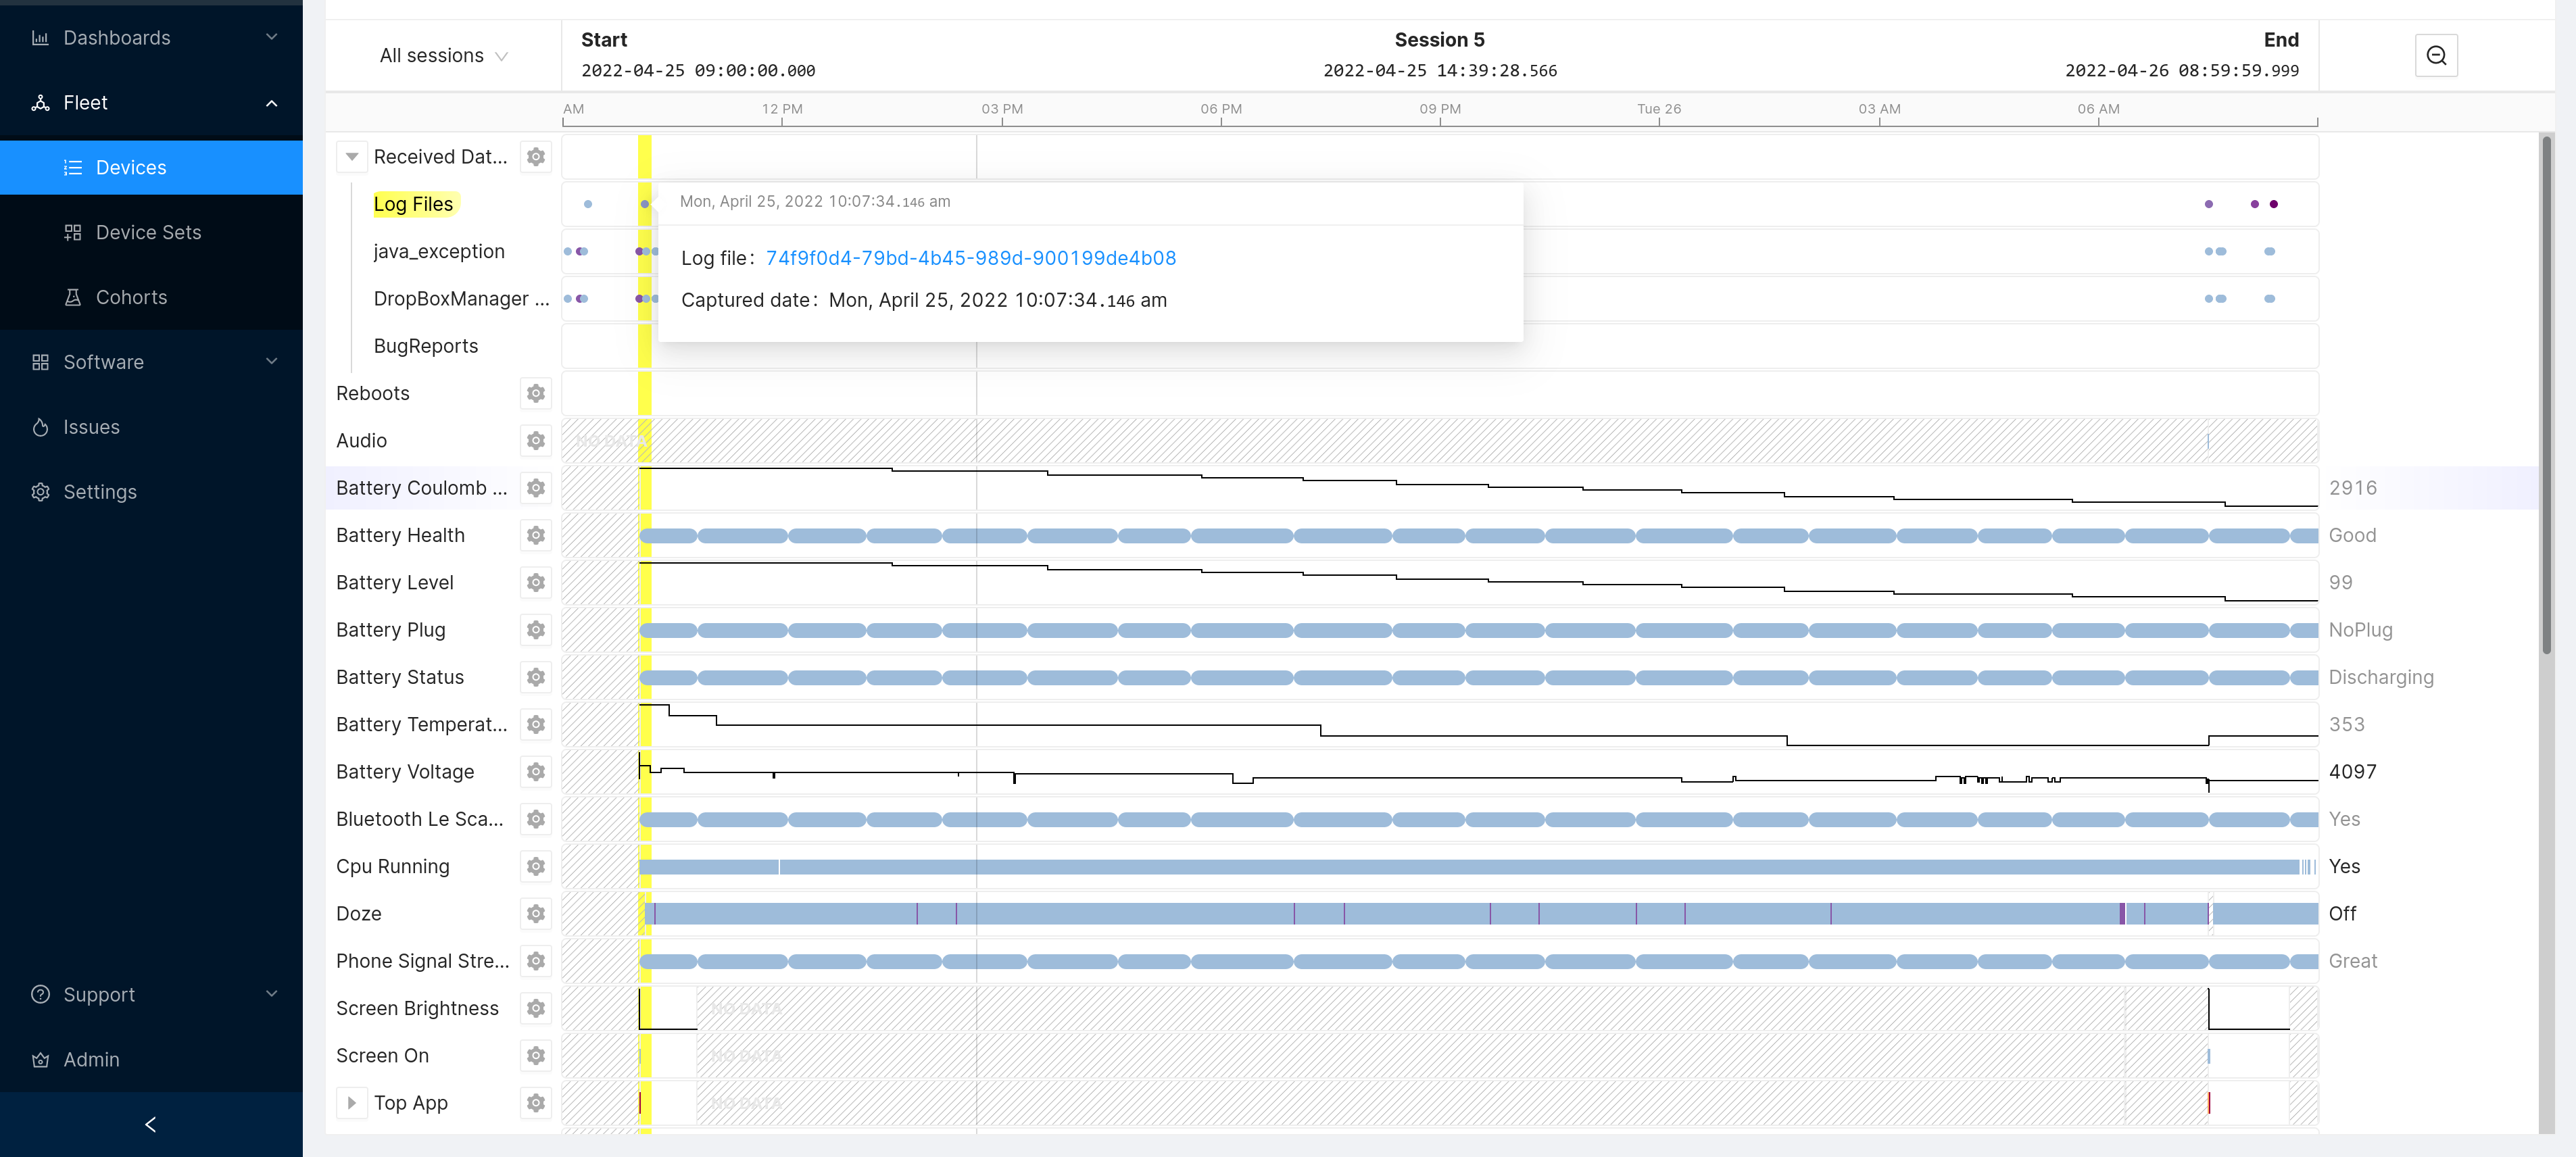
A timeline view for every single individual device showcasing its metrics, including time-series data, reboots and crashes.
The default set of metrics Android devices report when using Memfault. Adding your own custom metrics to this selection is extremely easy.
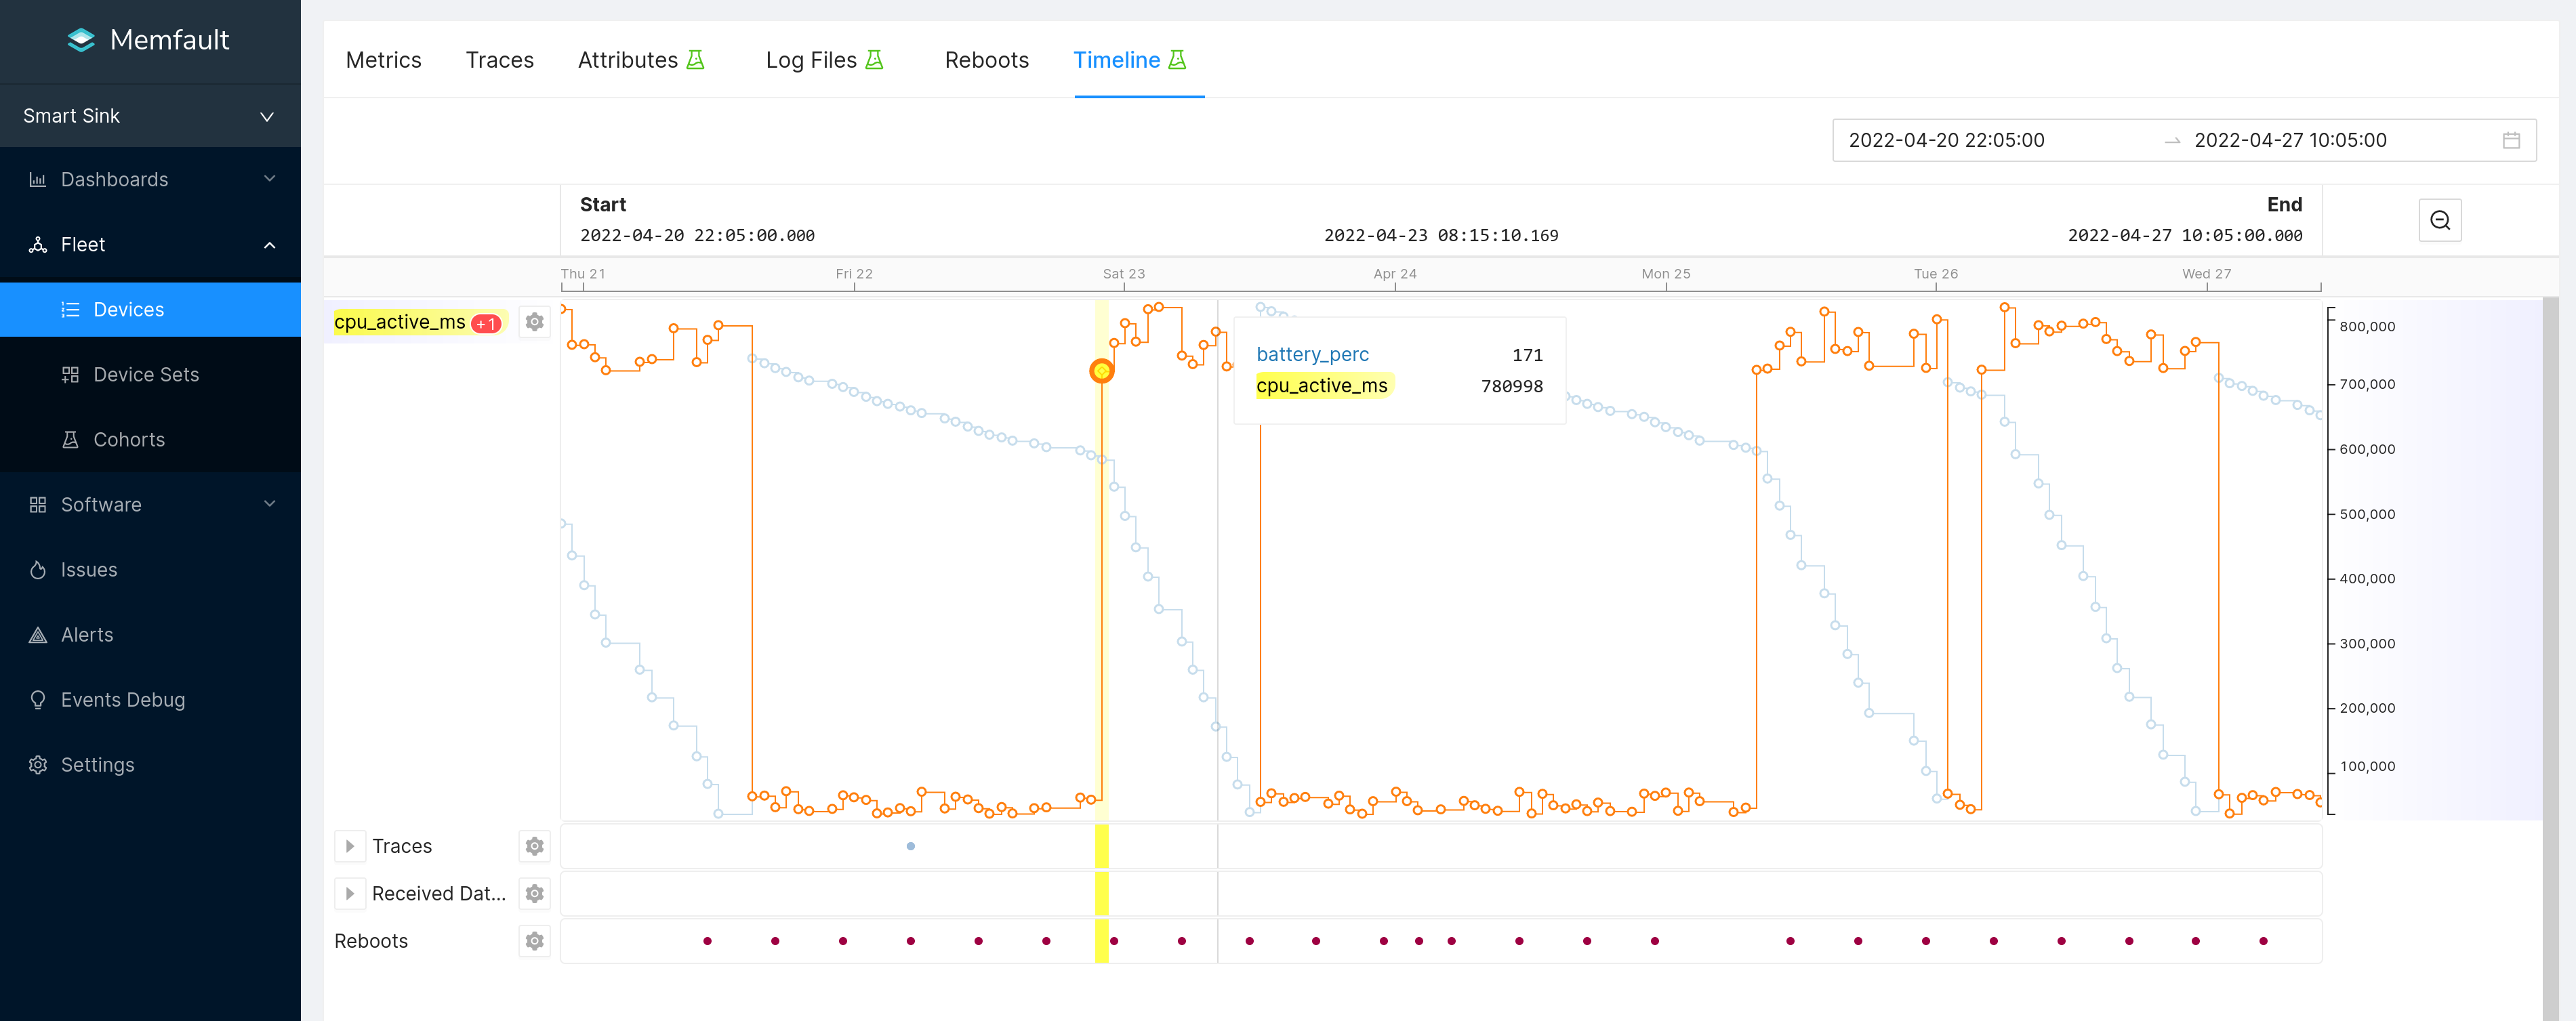
Analyzing an apparent correlation between battery levels and CPU usage in a single MCU device.
Fleet metrics
Among others, adding metrics to your Memfault integration unlocks:
- Device Attributes and time-series data across your whole fleet.
- Metric charts that aggregate the value of your metrics across your fleet, sliced by Cohort or Software Version.
- Email alerts based on your own configured thresholds.
- A rich device search view that allows you to express the most complex queries.
- Device Sets: a way to visualize the change in the count resulting from device searches over time.
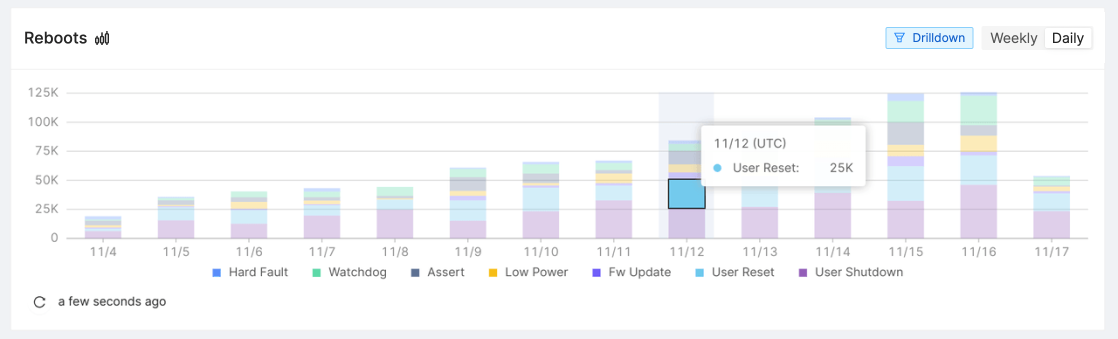
An aggregation of reboot events in your fleet. Drill down to find out which devices are causing an anomaly.
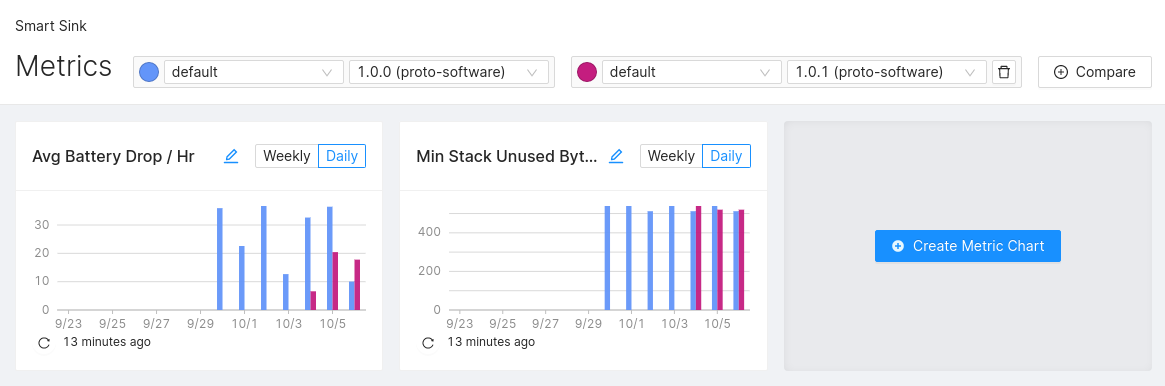
Compare aggregated custom metrics on your whole fleet and see the effect of your recent updates using hard data.
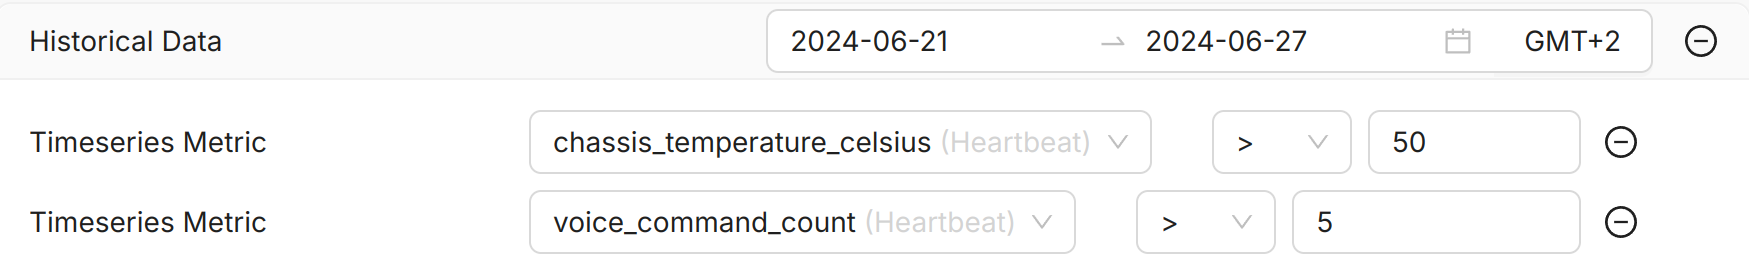
Search devices using complex queries. In this example, we're looking for devices that have had a battery percentage of more than 80 in the week starting on March 3rd.
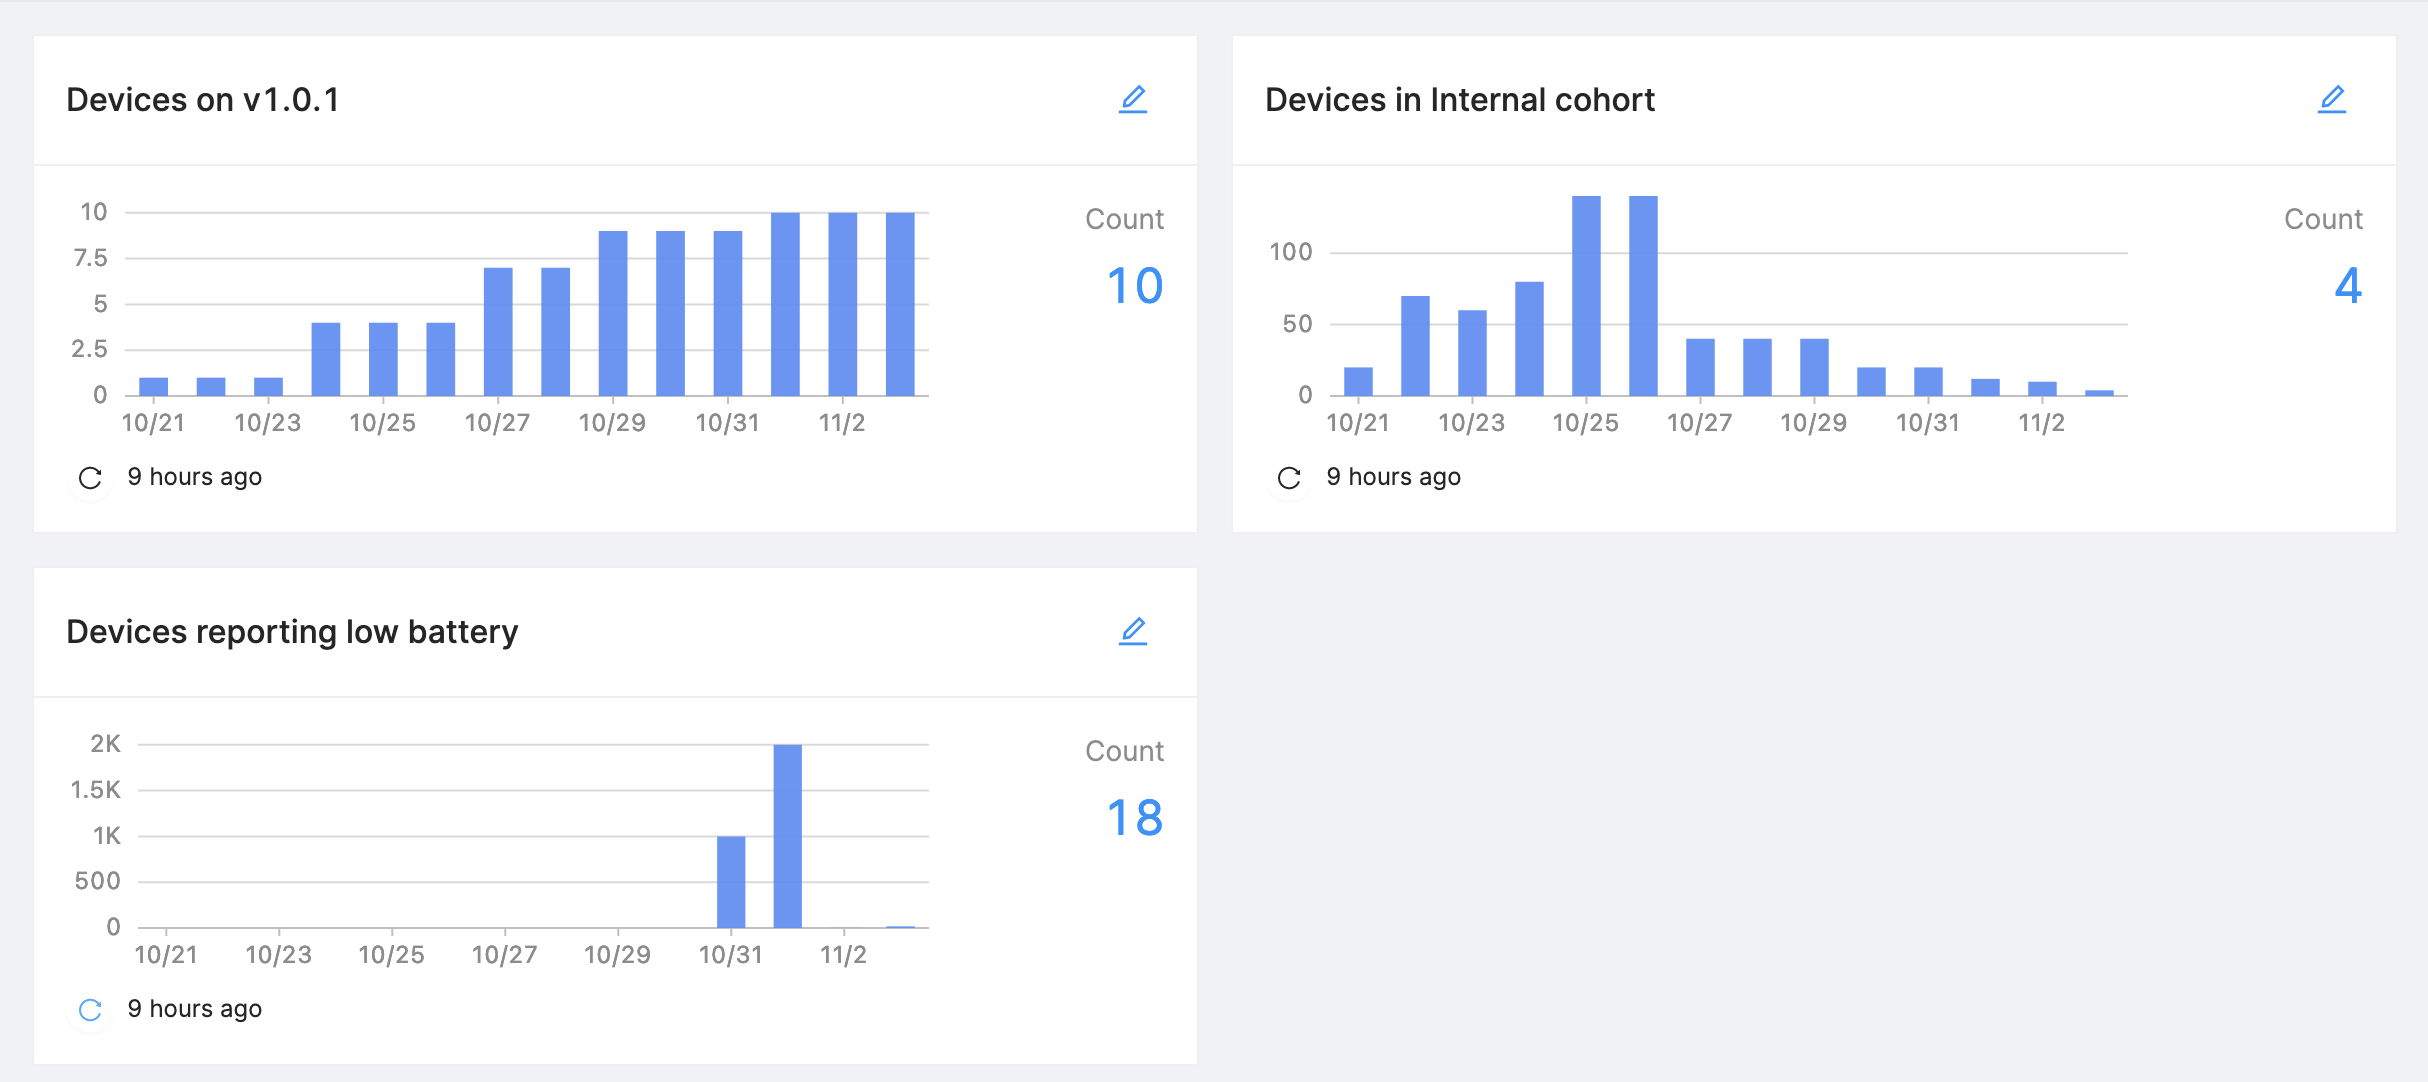
Save your searches as device sets and observe the evolution of the results.
To learn more about monitoring using Metrics, continue on to documentation on Metrics.