Debugging MCU coredumps with GDB
To analyze coredumps, the Memfault UI offers a slew of analyses right in the browser, such as full backtraces for all threads, viewers for local, static and global variables and more.
In some cases, it might be desirable to debug a coredump locally, using GDB. Memfault also supports this use case, by offering the option to export a coredump to an ELF core file which can be loaded into GDB.
This guide explains how to use this feature.
Prerequisites
- A version of GDB that is capable of loading ELF core files. When GDB is built
for an
...-elf-linuxtarget, this support is included. If you do not have (a capable) GDB installed yet, see the section at the bottom for installation instructions.
Export coredump to an ELF core file
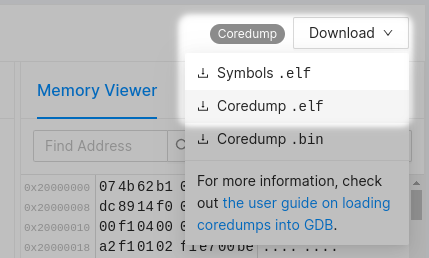
Navigate to the Issue and specific (coredump) trace that you would like to export and expand the "Download" drop down menu. If the menu is not present, it most likely means that the trace was not a coredump trace.
Click "Coredump .elf" to export and download the coredump to an ELF core file:
Download the symbol ELF file
Aside from the ELF core file, GDB also needs debug information about the software that generated the coredump, in order to fully make sense of the data in the core file. This debug information is present in the symbol ELF file. While you can still run GDB without the symbol file, many debugging features will not be available. Note that the symbol file MUST match the software that generated the coredump.
To download the symbol file, expand the "Download" drop down menu again. Click "Symbols .elf" to download the symbol file.
Load the core & symbol ELF files into GDB
You can load the core & symbol files as part of the GDB command line invocation like this:
$ gdb --se /path/to/symbols.elf --core /path/to/coredump.elf
If your version of GDB does not have support for core files, you will see this message when attempting to load the file:
"/path/to/coredump.elf": no core file handler recognizes format
Memfault provides GDB binaries that do have support for core files. See section at the bottom for installation instructions.
In case GDB is already running, it's also possible to load core & (additional) symbol files using GDB commands:
(gdb) core /path/to/coredump.elf
(gdb) symbol-file /path/to/symbols.elf
To view what files have been loaded, you can use the info files command:
(gdb) info files
Symbols from "/path/to/symbols.elf".
Local core dump file:
	`/path/to/coredump.elf', file type elf32-littlearm.
	0x2003b800 - 0x2003d800 is load1
	0xe000ed24 - 0xe000ed40 is load2
Installing multi-architecture GDB with Conda
Memfault publishes GDB binaries using the Conda package management system. If you do not have a Conda installer set up, check out these installation instructions.
environment.yml
Create a file environment.yml with these contents:
name: memfault-multi-arch-gdb
channels:
  - memfault
  - conda-forge
  # disable default channels to make sure we only use the channels above
  - nodefaults
dependencies:
  - multi-arch-gdb=12.1=py310*
  - python=3.10
Create the Conda environment
Run this command to install GDB and the dependencies from the environment.yml
file:
$ conda env create -f environment.yml
By default, "memfault-multi-arch-gdb" is used as the name for the environment.
You can override this by passing -n <NAME> to the "create" command.
Activate the Conda environment
To activate the Conda environment in your current shell, just run:
$ conda activate memfault-multi-arch-gdb
This commands adds gdb to your shell's PATH.
Run GDB
Once activated, you can run gdb:
$ gdb --se /path/to/symbols.elf --core /path/to/coredump.elf
GNU gdb (GDB) 12.1
Copyright (C) 2022 Free Software Foundation, Inc.
License GPLv3+: GNU GPL version 3 or later <http://gnu.org/licenses/gpl.html>
...
For help, type "help".
Type "apropos word" to search for commands related to "word".
(gdb)
Multi-architecture GDB Using Docker
There is a Docker image available as an alternative to Conda, if conda install is problematic or the package is not available for a particular platform.
To use it, first install Docker:
https://docs.docker.com/get-docker/
Then run this command from a terminal:
# the first line in each example below is the docker run command. the second
# line is the gdb command running from the current working directory, which is
# mounted inside the container ('--volume' argument)
# Powershell or bash:
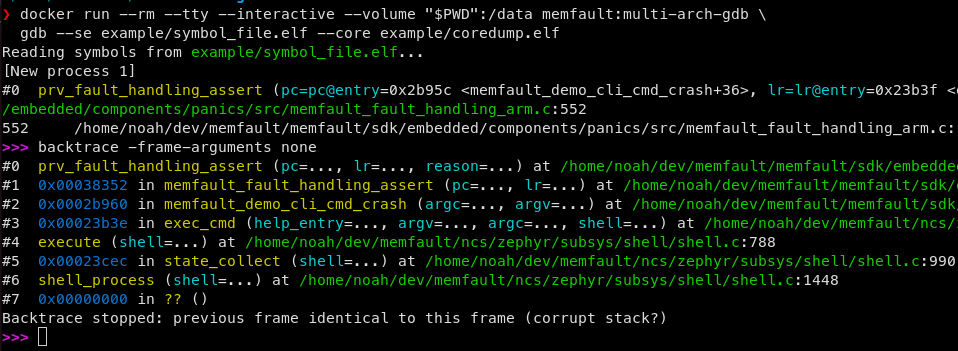
$ docker run --rm --tty --interactive --volume "${PWD}":/data memfault/multi-arch-gdb \
gdb --se example/symbol_file.elf --core example/coredump.elf
# Windows cmd.exe:
$ docker run --rm --tty --interactive --volume "%cd%":/data memfault/multi-arch-gdb \
gdb --se example/symbol_file.elf --core example/coredump.elf
Specifying gdb as the command to run is suitable for ARM and RISC-V targets.
For ESP32 targets, use xtensa-esp32-elf-gdb, xtensa-esp32s2-elf-gdb, or
xtensa-esp32s3-elf-gdb instead of gdb.
Example usage: