Tracking Battery Life with Memfault
Memfault believes that the battery performance is one of the most important reliability metrics for devices that are not connected directly to power sources. Unfortunately, understanding and predicting battery life trends and regressions with thousands to millions of devices in the field is hard.
In this guide, we will walk through the benefits of tracking battery life with Memfault, how to understand and predict battery life for a single device as well as across an entire fleet of devices, and finally talk through common pitfalls when monitoring battery life.
Using Memfault to Trace Battery Life
By using Memfault's device SDKs and the Heartbeat metrics, the difficulties of monitoring battery life will become a problem of the past. Memfault provides two main benefits when it comes to monitoring battery life: the ability to view a single device's battery status over time, and the ability to understand battery trends across an entire fleet of devices.
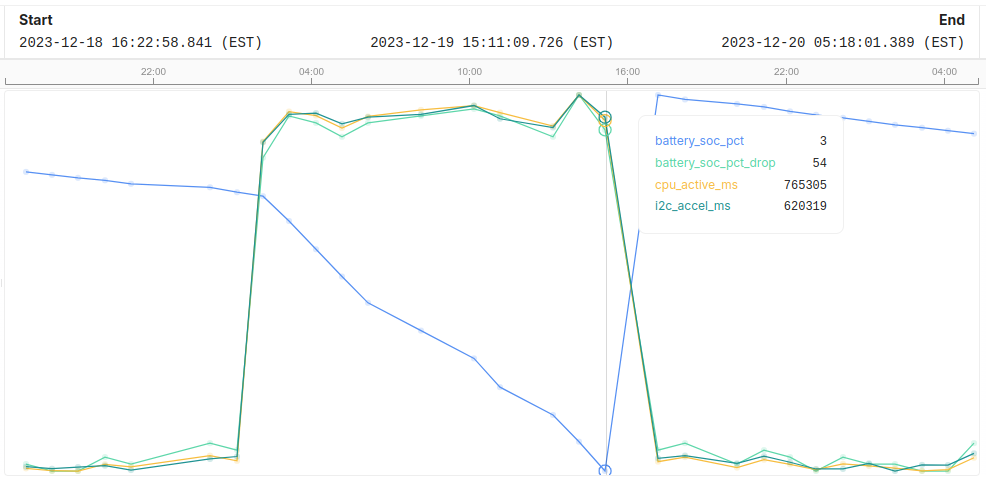
The above view shows a device-level view of battery life over time. This view is best for customer support teams responding to customer issues around battery life and for engineers trying to determine the root causes for poor battery life on a single device.
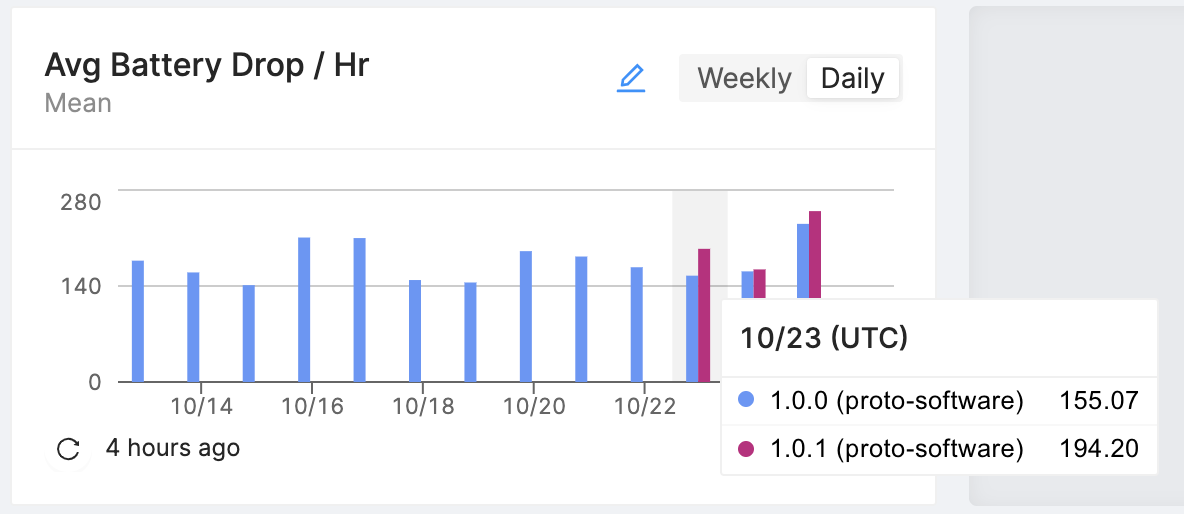
The above view shows the average battery life drop per hour of all devices in a fleet between software versions 1.0.0 and 1.0.1. Even though small, there is a larger battery life drop on average for software version 1.0.1, which could signal a regression in firmware!
The above examples give you a quick idea of the capabilities of Memfault. Let's begin on how to get started digging into battery life on your devices using Memfault.
Steps to Track Battery Life
Android
If you are using the Android SDK, the relevant battery metrics are automatically reported and you can skip down to the later sections to learn how to use these metrics within Memfault.
See Debugging Android Battery Life for a detailed guide.
MCU & Linux
The MCU and Linux SDKs have built-in support for Battery Life metrics. See the Core Metrics Battery Life section for details on the implementation.
The key metrics are:
- state of charge of a device
at the end of a Heartbeat interval (
battery_soc_pct) - state-of-charge drop over the course of a Heartbeat interval, where the
Heartbeat interval is a consistent, fixed interval of time
(
battery_soc_pct_drop)
Instantaneous Battery State of Charge
Set as battery_soc_pct by the Memfault SDK. This value represents the current
state of charge of the battery in the system, in a range of 0-100 percent,
captured at the end of the Heartbeat interval.
Instantaneous state of charge is only useful on a single device level, because it's impractical to aggregate fluctuating battery state of charge values across multiple devices (charge/discharge cycles are not synchronized).
Battery Level Drop Over Interval
Set as battery_soc_pct_drop by the Memfault SDK. This value represents the
amount the battery state of charge drop within the Heartbeat interval, from 0 to
100 percent. This can also be interpreted as the first derivative of the
instantaneous battery state of charge
(discrete time, since we live in the real world, where we are constrained to
sampling intervals/heartbeat intervals).
Analyzing Battery Life for a Single Device
Viewing an individual device's battery life over time is usually the first step during a customer support or engineering debugging session when trying to diagnose poor battery performance.
In Memfault, a device's battery life can be found under Devices then Timeline.
The Memfault application also shows other important metrics alongside battery life, which might point out correlations between battery charge drops and other events, such as the screen backlight being on, the Wi-Fi radio being stuck in a particular state, or the CPU not sleeping enough.
Android
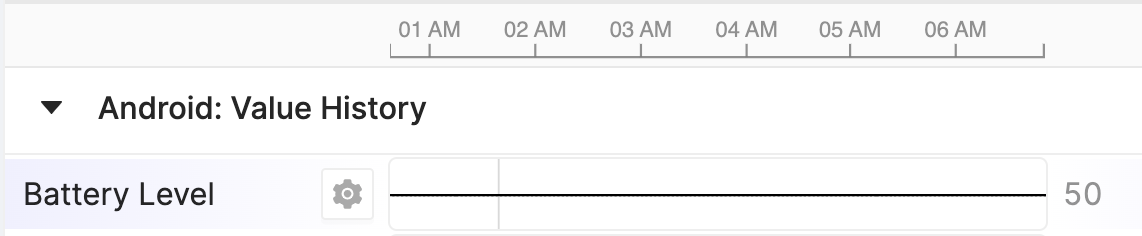
For Android devices, you can navigate to the Device Timeline tab in the application and view the "Battery Level" metric to view the battery state of charge over time.
MCU & Embedded Linux
For MCU & Embedded Linux devices, you can navigate to the Device Timeline
tab in the application and view the specific battery metrics that your devices
are configured to send. If this guide was followed, the metric would be called
Battery_ChargeLevel.
Analyzing Battery Life for a Fleet of Devices
A requirement of battery-operated devices is that they meet a minimum expected battery life. If a smartwatch promised to last for a week under normal usage, it should ideally last a week or more in real-world environments.
Fleet-wide battery trends can also be easily analyzed within Memfault.
Android
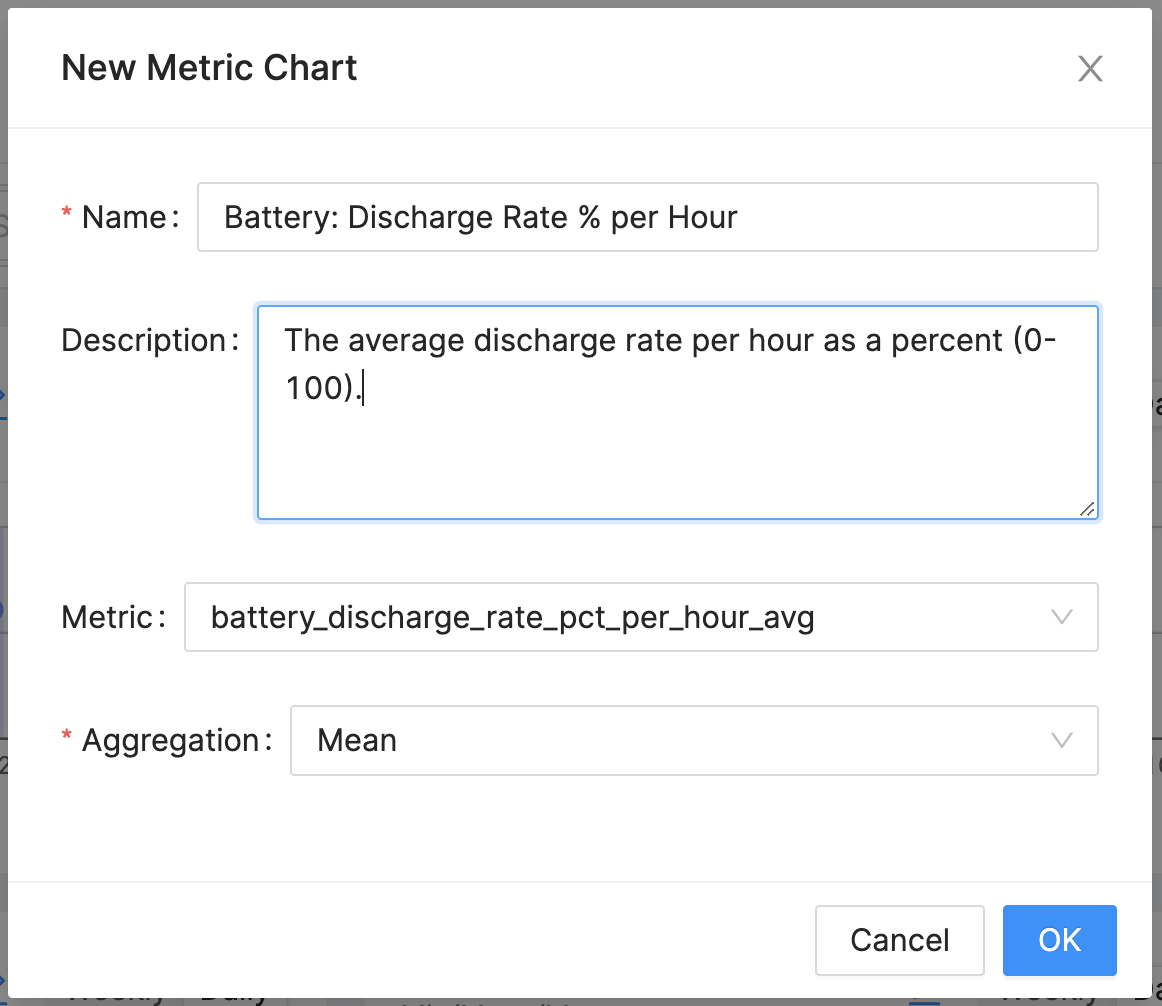
For Android projects and devices, a metric
battery_discharge_rate_pct_per_hour_avg is created automatically. It
represents the battery state of charge drop per hour represented as a
percentage. Below, we create a chart for this metric.
In the next section, we'll talk about how to use this chart.
MCU & Embedded Linux
For MCU & Embedded Linux projects, we receive the metric representing the battery state of charge drop over the course of the Heartbeat interval for all devices. Below, we create a chart for this metric.
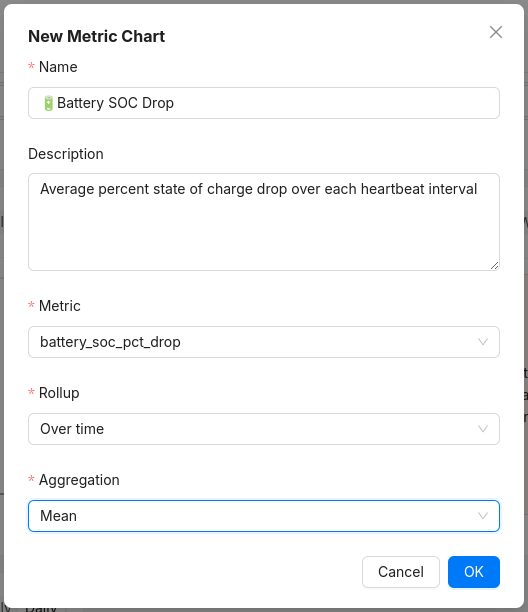
In the next section, we'll talk about how to use this chart.
Predicting Expected Battery Life
Once we have the average drop in the battery state of charge over time, we can easily calculate the number of hours of battery life that our devices should expect on average!
For our calculations below, we'll assume that all Heartbeat intervals are one hour.
For example, if the average percent battery charge drop per hour was 2.2:
Common Battery Life Pitfalls
Here are some common pitfalls with monitoring battery life that many of us at Memfault have struggled with in the past. We hope you don't make the same mistakes with this knowledge.
Ignoring Charging Status During Heartbeat Interval
A common issue with reporting battery life information from devices is that the power state is ignored. Battery life statistics that are used in aggregations should not be taken into account if a device is currently plugged in or charging.
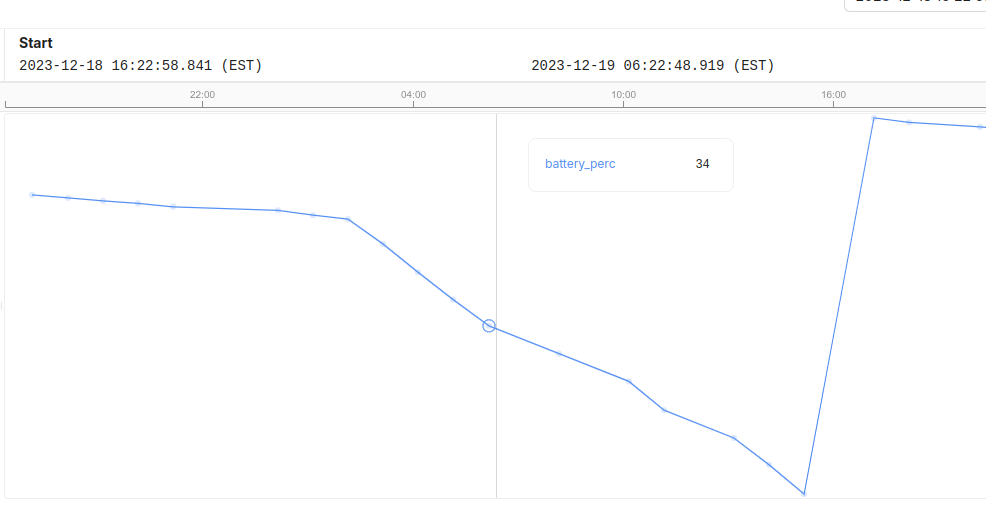
For example, the chart below shows the battery life of a device over a span of time:

The battery is discharging around 10% per data point. However, there is one chunk of time where there is a large battery life drop, but the device is plugged into a charger quickly and by the time the next battery life report takes place, it's been charged and is reporting a normal-looking number again. It might look as if the battery regression never took place!
The same goes for a device that is reporting data for long periods while connected to a charger. It might report 100% for 3 days, and these calculations should not be taken into account when determining battery life calculations for a fleet of devices.
Sending Battery State of Charge Sporadically
Firmware could be configured to send up battery life information at a non-standard interval. It may be whenever it connects to Wi-Fi, when it's within Bluetooth range of a cell phone, or when it's asked by a remote server for information.
In this information report, a device would usually send the current battery life percentage according to a pre-determined curve or a millivolt reading.
This type of information is decent when looking at a single device's history of battery life, but that is about it. From these individual reports, and sporadic reports at that, a battery life drop might be missed entirely, such as in the chart below:

When only taking into account the four captured data points, the battery life looks like it drops at a normal rate. However, there was a large drop in the middle.
The other reason why sending battery state of charge at non-regular intervals is hard is because of the large-scale calculation that needs to be done to aggregate millions of devices battery life expectancies becomes incredibly complex, expensive, and potentially impossible.
Not Waiting For Battery Measure to Settle
Batteries are quirky devices, and we don't have perfect tools at our disposal to get accurate readings from them at all times. Often, the voltage from the battery is used to come up with a guess as to the state of charge of the battery.
Reading the voltage works well if the battery draw has been stable and continues to be stable, but the battery may experience a voltage drop during a sudden high current draw, such as the backlight being turned on or a vibration motor suddenly activating.
In these situations, you need to be extra careful when using the battery state of charge reading. To mitigate this, it is advised to take several samples of the battery state of charge value. Of these samples, the outliers can be discarded or all samples can be averaged to come up with a more stable reading.
Preventing Battery Life Regressions
The only real way to prevent battery life regressions reliably and quickly is to measure the metrics mentioned above on devices in a production environment on production firmware. It is impossible to run devices and firmware through the entire matrix of environmental conditions to understand real-world power usage.
This means that if a company makes a wearable device and it's shipped all over the world, it should be tested internally with a variety of Android and iOS phones, versions, connectivity interference, and usage patterns, but it should be understood that this will only be a small subset of the environments the device will experience.
The only proper way to understand battery life is to push out an update to a small percentage of the fleet of devices, maybe 1%, and gather data. Below, we are comparing an existing firmware, 1.0.0, with a new firmware that has recently begun rolling out to devices, 1.1.0.
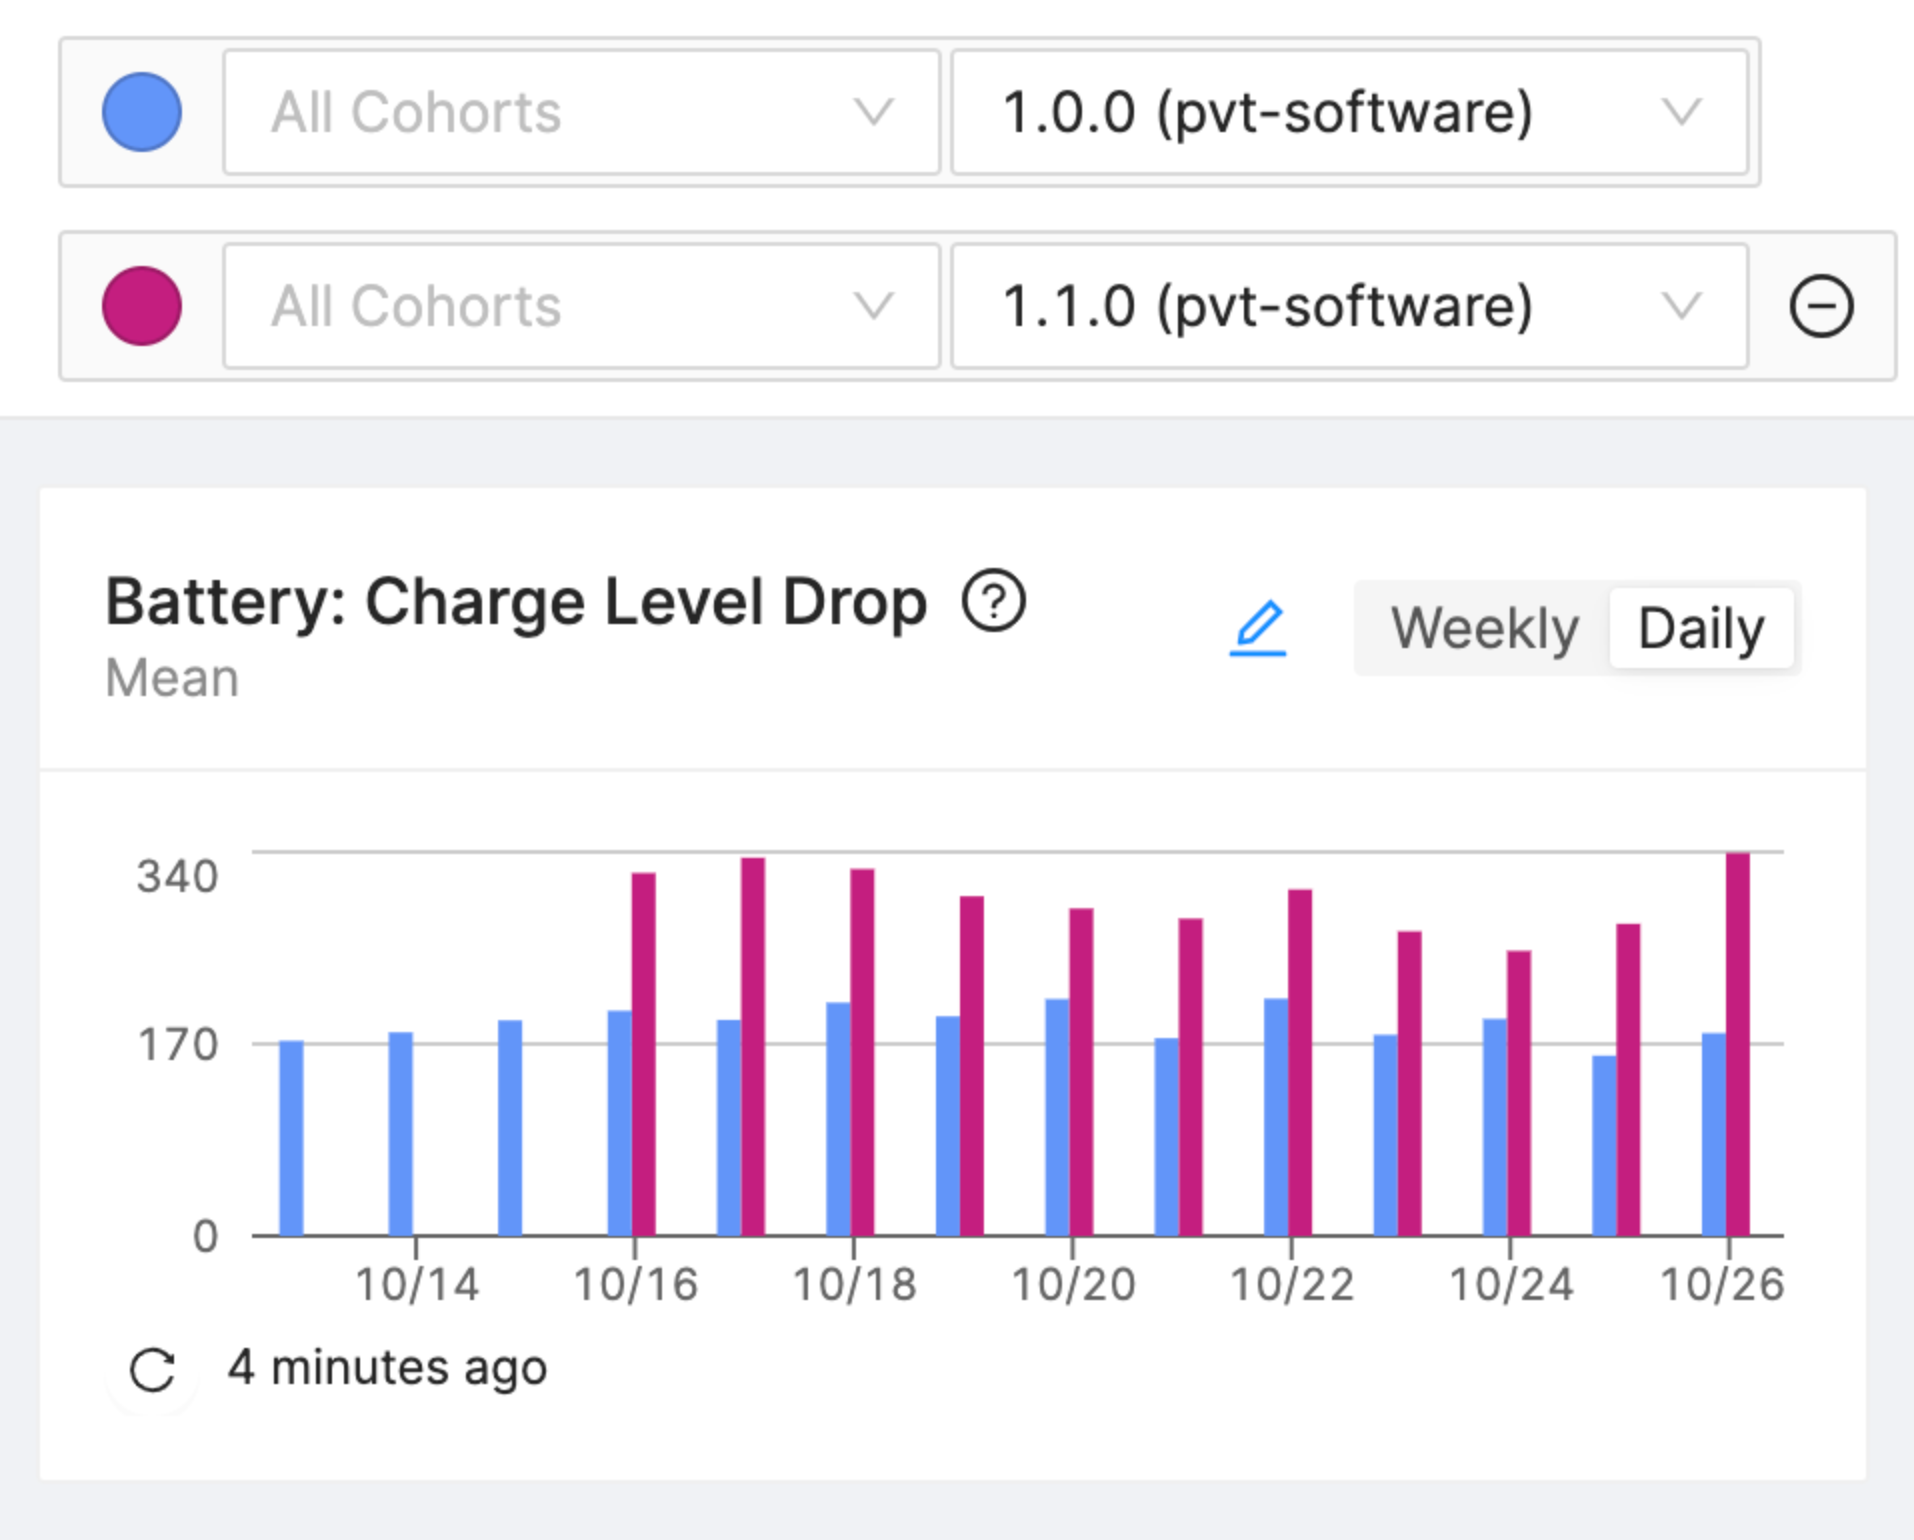
We can quickly see that the battery state of charge drop on 1.1.0 is, on average, much worse than on 1.0.0. If this was unexpected, this is a regression!
This release should be pulled and more investigation needs to be done to understand the root cause for the new battery life drain behavior.