Issue Filtering and Improved Trace Analysis
Happy 2020! We hope you are as excited for the new year as we are at Memfault.
In this update, we've added improved Issue filtering, automated ISR analysis, a built-in hex viewer into the Trace viewer, and many other improvements.
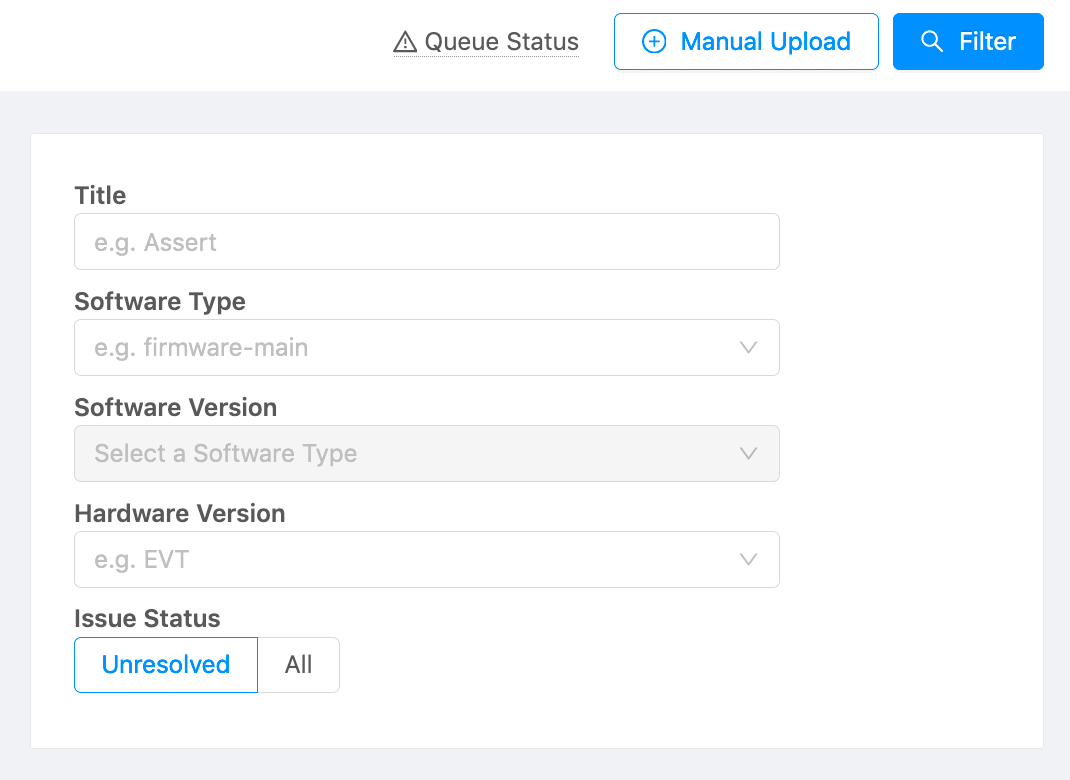
Issue List Filtering

You can now filter Issues by more fields, including Software Type, Software Version, and Hardware Version. As you filter, the URL will update so that you can bookmark your favorite queries.
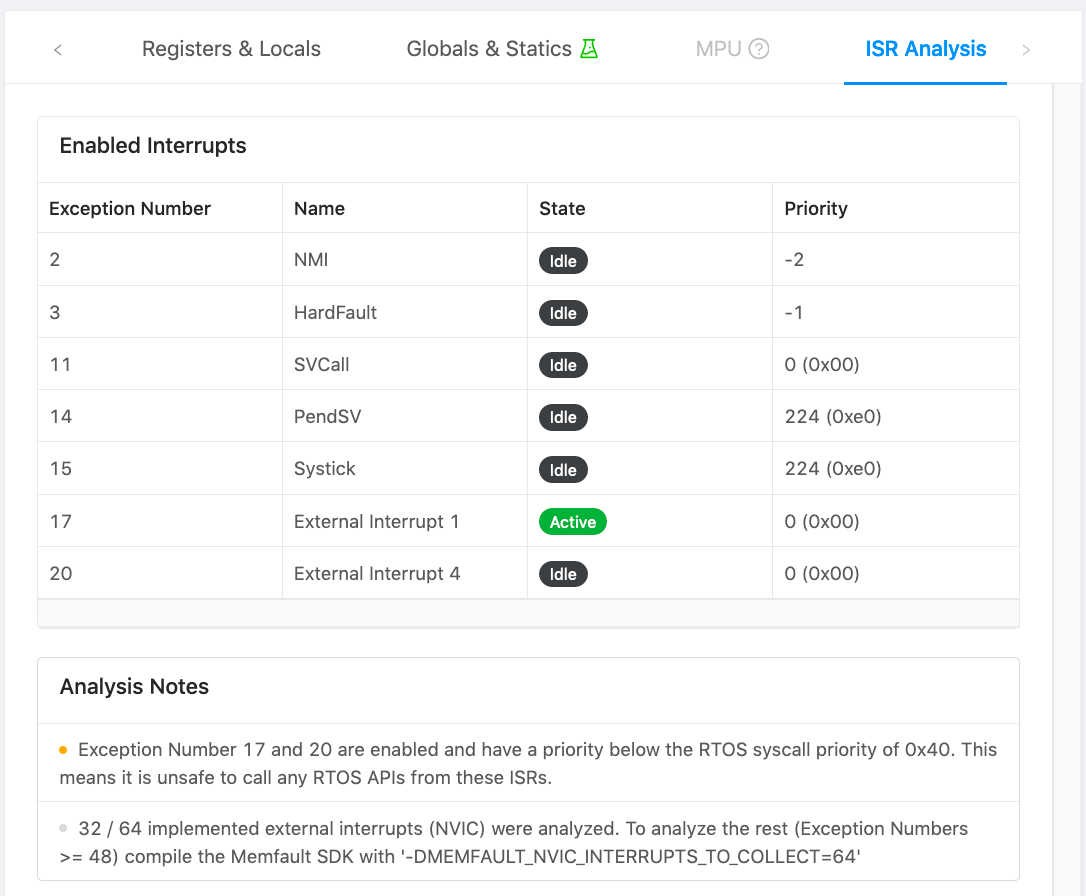
ARM ISR & Exception Analysis

We've added an ISR analysis to our growing list of analyzers for Memfault. This will tell you which exceptions are configured, the state and priority of them, and provide extra notes and suggestions.
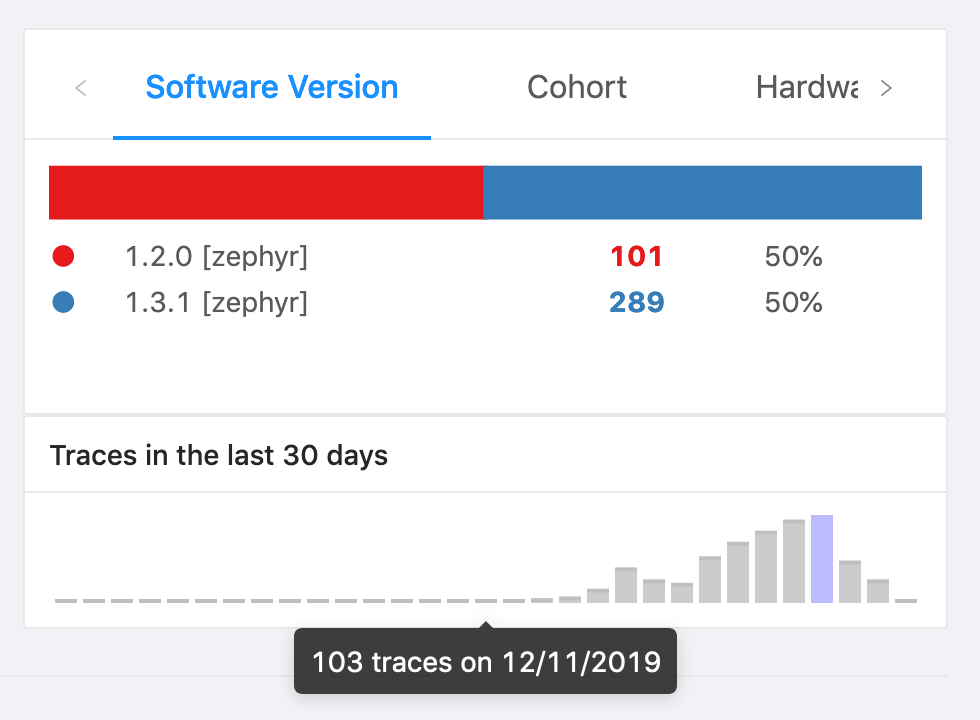
Trace Historical Counts

You can now easily view the historical counts of a given Issue.
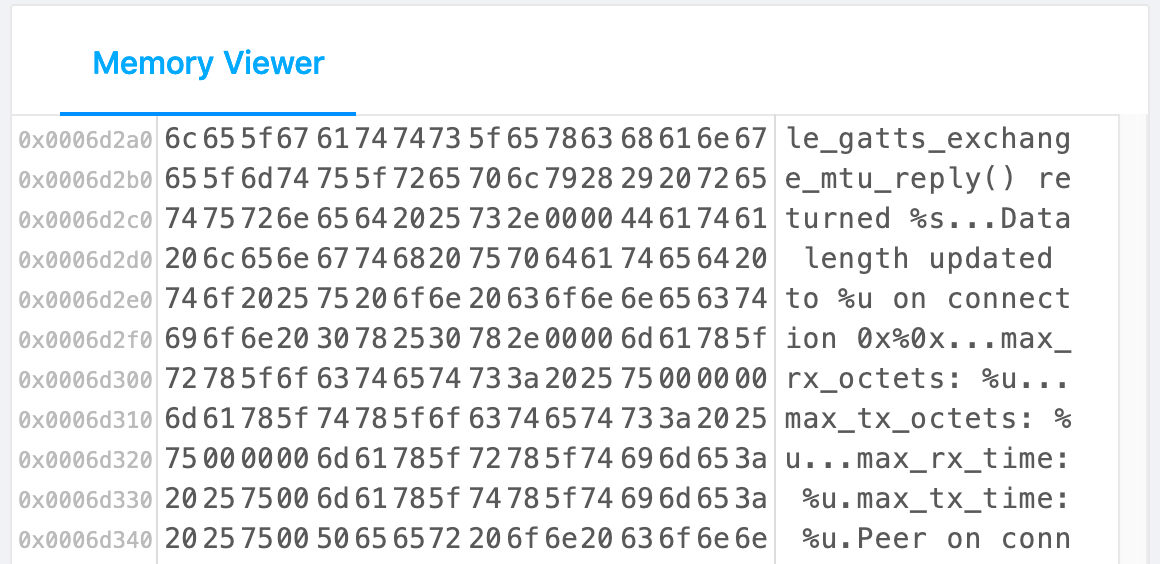
Hex Viewer

Other Updates
- You can now view the list of Traces for a Device from the Device detail page
- Display function name for function pointers in the Globals & Statics tab
- Stack Overflows from different threads will now produce different Issues
- Better support for QP when analyzing coredumps
- Better support for ARM-MDK and IAR in the Globals & Statics tab