Locally Debugging Linux coredumps with GDB
To analyze coredumps, the Memfault UI offers some analyses right in the browser, such as full backtraces for all threads and viewers, local variables and more.
In some cases, it might be desirable to debug a coredump locally, using GDB. Memfault also supports this use case, by offering the option to download the ELF coredump which can be loaded into GDB.
This guide explains how to use this feature.
By default, memfaultd uses the "Threads stack only" capture
strategy. This means that only the memory of each thread's
stack is captured. This memory contains the local variables of each function in
the call stack, but variables that are allocated statically, globally, or on the
heap are not captured. See the capture strategy
documentation for more information.
Prerequisites
- A version of GDB that is capable of loading ELF core files. When GDB is built
for an
...-elf-linuxtarget, this support is included. The build of GDB should also support the processor architecture of your device. - The version of GDB also needs to have been built with
--with-debuginfodto support loading symbol files via debuginfod.
Download coredump to an ELF core file
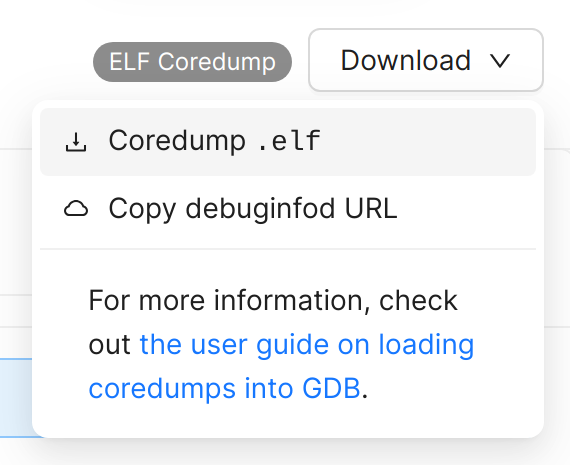
Navigate to the Issue and specific (coredump) trace that you would like to download and expand the "Download" drop down menu.
Click "Coredump .elf" to export and download the coredump to an ELF core file:
Configure DEBUGINFOD_URLS
In order to fully make sense of the data in the ELF core file, GDB also needs debug information about the software that generated the coredump. This debug information is present in the symbol ELF files.
GDB can download the symbol files from a debuginfod server. Memfault acts as such a debuginfod server for any symbol file you have uploaded to Memfault.
To configure GDB to use Memfault as a debuginfod server, you need to set the
DEBUGINFOD_URLS environment variable to point to Memfault's debuginfod URL for
your project.
The easiest way to get this URL, is to click on the "Copy debuginfod URL" button from the "Download" drop down menu (see screenshot above).
This will copy the DEBUGINFOD_URLS environment variable to the clipboard. The
variable will look something like this:
DEBUGINFOD_URLS=https://<EMAIL>:<USER_API_KEY>@app.memfault.com/api/v0/organizations/<ORGANIZATION>/projects/<PROJECT>/debuginfod
Instead of authentication using an email address and user API key, you can also use an organization token.
Load the coredump into GDB
You can load the core & symbol files as part of the GDB command line invocation like this:
$ DEBUGINFOD_URLS=... \
  gdb --core /path/to/coredump.elf
GDB will prompt you to allow it to load the symbol files from Memfault's debuginfod API:
This GDB supports auto-downloading debuginfo from the following URLs:
  <https://user%40example.com:<REDACTED>@app.memfault.com/api/v0/organizations/acme-inc/projects/linux-hub/debuginfod>
Enable debuginfod for this session? (y or [n])
Once you confirm, GDB will download the necessary symbol files automatically.