Linux Coredumps
Introduction
By enabling coredump support with Memfault, the memfaultd daemon will
automatically collect, preprocess, and upload coredumps from your devices and
send them to the Memfault platform. In turn, the Memfault platform acts as a
remote analyzer for your coredump files and (using your project's debugging
symbols) is able to display a rich view of a coredump, displaying backtraces for
all threads, and allowing you to inspect state in full detail.
From man core:
The default action of certain signals is to cause a process to terminate and produce a coredump file containing an image of the process's memory at the time of termination. This image can be used in a debugger (e.g., gdb(1)) to inspect the state of the program at the time that it terminated. A list of the signals that cause a process to dump core can be found in signal(7).
Additionally, Memfault takes care of grouping traces from coredumps into issues, managing issues, and providing metrics on issues and monitoring via notifications, granting you a clear image of how your fleet is behaving, as well as tight control over the success of your OTA updates.

A Linux coredump as an issue on the Memfault Web App.
Keep meta-memfault-example open as a reference
implementation. Your integration should look similar once you're done following
the steps in this tutorial.
Prerequisites
The memfaultd daemon, built with the coredump feature
Follow the integration guide to learn how to set this up
for your device. A key function of memfaultd is to preprocess and upload
coredumps to the Memfault platform. It does this via its coredump feature.
The coredump feature is enabled by default. Read more on how to configure
which features memfaultd builds with.
Linux kernel configuration
Ensure that your Linux kernel is built with the following options enabled:
CONFIG_COREDUMP=yto enable coredump creation by the kernelCONFIG_CORE_DUMP_DEFAULT_ELF_HEADERS=yto enable default mappings. for processes. Specifically, Memfault recommends:bit 0: dump anonymous private mappings,bit 1: dump anonymous shared mappings, andbit 4: (available since Linux 2.6.24) dump ELF headers.
Read man core to learn more about these settings. We recommend
reading the entirety of this man page if you need basic understanding of how
coredumps work in Linux.
To confirm that your kernel is correctly configured, check out your project's
configuration file in
tmp/work/[machine]/[kernelpackage]/[version]/build/.config. For example:
tmp/work/raspberrypi3-poky-linux/linux-yocto/5.15.62+gitAUTOINC+59c8898d45_7cb30c5e95-r0/linux-raspberrypi3-standard-build/.config`
core_pattern and core_pipe_limit
The following files will be modified by memfaultd at runtime and must not be
written to by any other process.
Make sure your Linux image does not contain any other services that may be
written to these files. To do this, check for the inclusion of other coredump
handlers, such as systemd (which can act as a coredump handler when built with
-Dcoredump=true), and check your /etc/sysctl.d drop-in
directory for anything other than Memfault that may be setting
kernel.core_pattern or kernel.core_pipe_limit.
To check whether you've succeeded in letting memfaultd take care of these
files, confirm that the contents of the core_pattern file reference the
memfault-core-handler binary (see
Test your integration).
Note that memfaultd respects privacy settings and only sets core_pattern
if data collection is enabled at runtime.
Make sure prelinking is disabled
Prelinking is an operation that optimizes application load times by resolving library symbols before launch. However, most of the benefits of prelinking are lost unless PIE is disabled, and both Glibc and Yocto are dropping support for it. It is disabled by default in Yocto since 3.4 - Honister.
To disable prelinking on an older version of Yocto,
where it is still enabled by default, you need to override USER_CLASSES in
local.conf. On Yocto versions before 3.4 - Honister, USER_CLASSES included
image-prelink by default.
If you already have USER_CLASSES overridden in local.conf, make sure
image-prelink is not included in the list. If not, you can use
USER_CLASSES:remove = "image-prelink" to keep the defaults, except for
"image-prelink".
This is how we disable prelinking in our example image:
USER_CLASSES = "buildstats"
Link Time Optimization (LTO)
We strongly recommend against using Link Time Optimization (LTO) in the programs you want to be able to debug using coredumps. When LTO is enabled, the analysis of the coredumps can become lacking or even fail completely.
Rust compiler configuration
Rust has a few options that affect the output of coredumps. The first is the
panic strategy. This can be set to either abort or unwind. unwind logs the
stacktrace locally when a panic is hit. abort hands this responsibility off to
the kernel by raising a signal that triggers a Linux coredump. Since we use the
latter method to capture coredumps with memfaultd, we want to use the abort
strategy. It can be set for your release profile in the following way:
[profile.release]
panic="abort"
Additionally we want to ensure that unwind info is generated for all functions.
This is the default for unwind but not for abort. This can be set via
rustc compiler flag like so:
[build]
rustflags = ["-C", "force-unwind-tables=yes"]
Controlling which memory regions are captured in coredumps
memfaultd can use different strategies to capture the memory of the crashed
program.
Threads stack only
By default, the threads strategy limits capture to all program thread stacks.
This reduces the coredump size while keeping the most useful information when
debugging.
You can limit the size of each stack with max_thread_size_kib.
// /etc/memfaultd.conf
{
  "coredump": {
    "capture_strategy": {
      "type": "threads",
      "max_thread_size_kib": 32
    }
  }
}
On-device Stack Unwinding
The stacktrace strategy has memfaultd unwind the stacks of the threads
captured in the coredump and send only the program counters for each thread to
Memfault (which are then symbolicated into lines of source code). This strategy
is intended for use by teams that:
- Have strict PII policies which consider values in local variables and registers as possible PII
- Are unable to upload debugging binaries for system libraries to Memfault. Because the stacks for each thread are unwound on the device, Memfault can symbolicate the frames for which it does have debugging symbols and ignore the frames for which it does not, without needing to use their frame info to fully unwind the stack.
// /etc/memfaultd.conf
{
  "coredump": {
    "capture_strategy": {
      "type": "stacktrace"
    }
  }
}
Kernel selection
If you would like to capture more memory and include the heap and other memory
regions, you can use the kernel_selection strategy. This strategy captures all
the memory regions included in the ELF core file generated by the kernel (see
man core core for kernel configuration options).
// /etc/memfaultd.conf
{
  "coredump": {
    "capture_strategy": {
      "type": "kernel_selection"
    }
  }
}
With this strategy, coredumps can grow as large as the amount of memory the
program uses. If the uncompressed size exceeds
coredump_max_size_kib, the coredump will not be saved.
Capturing logs in coredumps
memfaultd can capture the most recent logs from the system at the time of a
crash and add them to the coredump. This can give you more context about what
was happening in the system up to the time of coredump capture. The logs are
configured using the following configuration:
// /etc/memfaultd.conf
{
  "coredump": {
    "log_lines": 100
  }
}
This configuration will capture the last 100 lines of logs from the system at
the time of the crash. The log lines will be captured in memory in a circular
queue, with the oldest line being dropped when the total number of log lines
exceeds the value of log_lines. A snapshot of this buffer is
added to the coredump at the time of coredump capture.
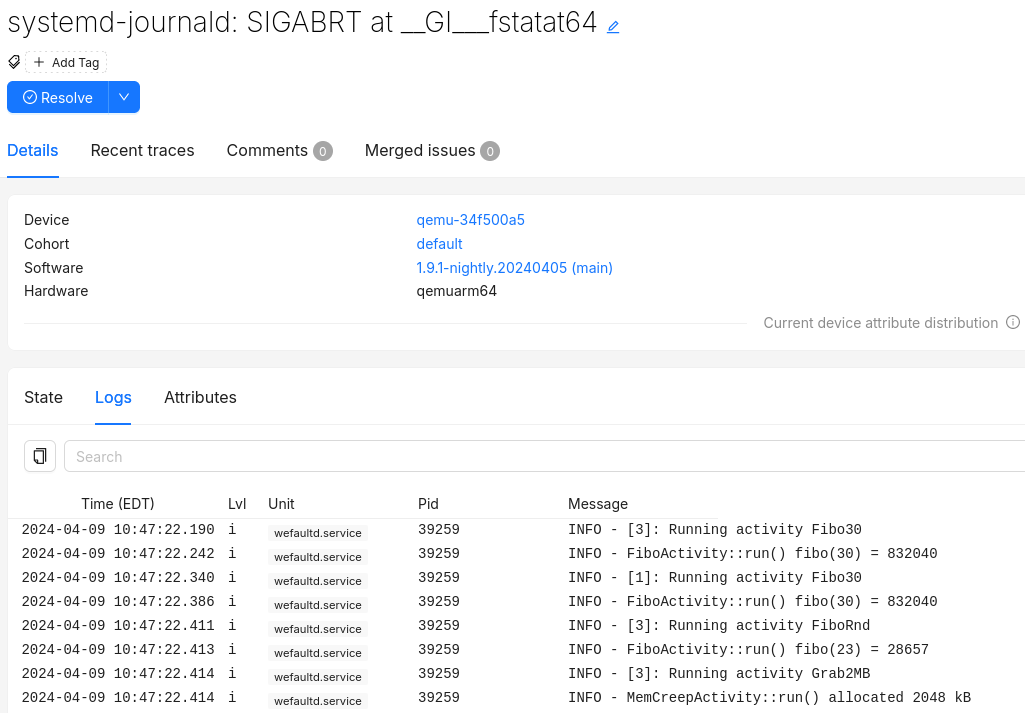
Captured logs can be found in the Logs tab of an issue:
For more information on configuring logging see the logging section.
Upload debugging symbols
After a coredump was collected on the device, memfaultd will upload it to the
Memfault Web App. To allow the Memfault Web App to reconstruct all details from
such coredumps, you'll need to upload debugging symbols for each of the binaries
in your Linux image. While coredumps will still be processed without debugging
symbols, only a limited set of the debugging features in the web app will be
available until they are uploaded. We recommend doing this as part of your build
process (since this needs to be done for every version), either locally or
ideally as part of continuous integration, to keep Memfault up to date with your
build's newest debugging symbols.
Automatic upload with Yocto
First, configure Yocto to generate a separate DEBUGFS image containing all the
debug symbols for your system image:
# Support memfault-cli upload-yocto-symbols command
DEPENDS:append = " elfutils-native"
IMAGE_GEN_DEBUGFS = "1"
IMAGE_FSTYPES_DEBUGFS = "tar.bz2"
IMAGE_GEN_DEBUGFS will cause Yocto to build an archive with separated debug
info of all the binaries on the system. Your system image will not get larger ,
but a separate -dbg.tar.gz file will be saved next to your system image.
This archive is used by the memfault upload-yocto-symbols command. It does not
upload the complete file directly: it extracts it to a temporary directory and
generates unstripped copies of the binaries and their symbols.
If you can't do this, then you can pass the information needed from the build environment as
command-line arguments:
--eu-unstrip-path: path to a localeu-unstripbinary from elfutils. Note that one is available intmp/sysroot-components/x86_64/elfutils-nativeif you've addedDEPENDS:append = " elfutils-native"to your build.--package-debug-split-style: your project'sPACKAGE_DEBUG_SPLIT_STYLE. In Poky, it defaults todebug-with-srcpkg. Read more about it in the Yocto reference.
To upload your debug symbols, use the Memfault CLI (version
0.11.0 or newer): memfault upload-yocto-symbols.
$ source oe-init-build-env
$ memfault \
    --org $YOUR_ORGANIZATION_SLUG \
    --org-token $ORGANIZATION_AUTH_TOKEN \
    --project $YOUR_PROJECT_SLUG \
    upload-yocto-symbols \
    --image tmp/deploy/images/raspberrypi3/base-image-raspberrypi3.tar.bz2 \
    --dbg-image tmp/deploy/images/raspberrypi3/base-image-raspberrypi3-dbg.tar.bz2
By default upload-yocto-symbols will use a default temporary directory in your
system such as /tmp to extract the debug symbols. This can use significant
space and if you'd like to use a different location in your filesystem, you can
do so with the TMPDIR environment
variable: TMPDIR=<desired directory> memfault ....
Your ORGANIZATION_SLUG and PROJECT_SLUG can be found in the
settings page of your project. The ORGANIZATION_AUTH_TOKEN can be
generated in Admin → Organization Auth Tokens. This
can only be done by an organization administrator.
The format of your --dbg-image may differ from that of your --image.
Supported formats are .tar, .tar.bz2, .tar.gz and .tar.xz.
memfault requires bitbake to upload the symbols. It's recommended that you
source the Yocto build environment script using source oe-init-build-env
before running upload-yocto-symbols.
Upload symbols from non-Yocto builds
upload-yocto-symbols assumes you are using Yocto to build your Linux device
software. If you aren't, you can use upload-elf-symbols. This command takes an
archive of binaries with debug symbols, extracts the ELFs, and uploads them to
Memfault.
$ memfault \
    --org $YOUR_ORGANIZATION_SLUG \
    --org-token $ORGANIZATION_AUTH_TOKEN \
    --project $YOUR_PROJECT_SLUG \
    upload-elf-symbols \
    --archive build/debug-rootfs.tar.bz2
Manual upload
Another option is to upload the symbol files individually using the Memfault Web
Application. The symbol files you upload here must be individual ELF files
containing the program text and debugging symbols. Typically, you build them
with -g and remove the debug symbols before distribution with the strip
command.
Open Software → Symbol Files and click on Upload Symbol File, or simply
click on this deep link to the appThe Yocto-generated debug image (for example in .tar.bz2 format) contains
stripped and (separately) debug binaries. To upload them to Memfault, you'll
need to use the Memfault CLI as shown above.
Read docs on CI and authentication in order to obtain credentials that you can use in your build environment or in continuous integration.
API upload of individual symbol files
Our REST API is also available as an option for uploading individual symbol files.
Set enable_data_collection
By default, enable_data_collection is false (see the default
configuration). This enables asking end users for consent
before collecting or transmitting any data to Memfault services.
Once the end-user has given their consent, you can enable data collection like so:
$ memfaultctl enable-data-collection
To disable it:
$ memfaultctl disable-data-collection
The memfaultd service will restart automatically whenever you run either of
those commands if called with a value different from the current configuration.
Take a look at the /etc/memfaultd.conf reference for
more information.
Test your integration
You can test your integration with memfaultctl. The trigger-coredump command
will fork itself and crash.
# memfaultctl trigger-coredump
If developer mode is active, memfaultctl will immediately
push the coredump to Memfault. Otherwise you can force memfaultd to sync
immediately with:
# memfaultctl sync
If your integration is all set and you've enabled data collection, you'll be able to see a new issue pop up in your project's Issues page.
Debugging Issues
You might want to check that the core_pattern file is being set correctly by
memfaultd when it starts. Check that the output of this command includes
memfault-core-handler:
$ cat /proc/sys/kernel/core_pattern
Logs from memfault-core-handler are sent to kernel logs. You can check them
with dmesg or journalctl -f:
$ dmesg
[1066631.655572] memfaultd::cli::memfault_core_handler[6423]: Successfully captured coredump