Android Built-in Metrics
The Android SDK contains built-in support for collecting various types of metrics from Android devices.
Most built-in metrics can be enabled, disabled, and additionally configured in Memfault dashboard, under Settings → Data Sources.
Additional setup in the Memfault dashboard, under Settings → Metrics, can be done to set the metrics as Attributes (for use of the metric in Search and Device Sets) or Timeseries (for use of the metric in Metric charts and Device Sets), if desired. Note that Memfault will automatically configure certain metrics as Timeseries or Attributes and set a value range upon creation, but these defaults can changed in the same view.
Memfault will add new built-in metrics, and improve existing metrics over time, with newer SDK versions.
Memfault also supports recording custom metrics using Memfault's Reporting API. This enables capturing domain specific metrics that Memfault wouldn't know about otherwise. All built-in metrics are captured using the same Memfault Reporting API.
Battery (and related) Metrics
Collected via HRT since Android SDK 4.5.0
Since Android SDK 4.5.0, battery metrics on timeline are displayed using High-Resolution Telemetry (note: this is behind a feature flag which is being rolled out progressively to devices running 4.5.0 or higher).
Several new metrics were added to timeline as part of this change — these are only available when collecting via HRT:
- Wi-Fi On
- User (current active user on multi-user devices)
- Foreground User (current foreground user on multi-user devices)
- Job (adds job identifier)
- Package Install (shows all
PackageManagerinstalls, with package and version) - Package Uninstall (show all
PackageManageruninstalls, with package and version)
Collected Since Android SDK 3.0
The Android SDK collects metrics from the Android batterystats subsystem. This includes data from many components which may affect battery usage (Radio, Wi-Fi, Bluetooth, Screen, CPU, GPS), in addition to statistics about the battery itself.
These metrics are displayed on the device timeline:
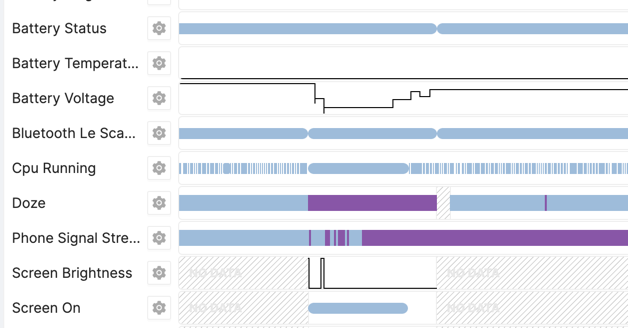
And several summary metrics are also available. Each metric is listed below, noting the batterystats output code that it is derived from (they are defined in the batterystats source):
| Metric | Description | Batterystats Key |
|---|---|---|
audio_on_ratio | Percentage of time (0.0-1.0) audio was switched on. | a |
battery_discharge_rate_pct_per_hour_avg | Percentage drop (-100-0) per-hour, when discharging. | N/A |
battery_health_not_good_ratio | Percentage of time (0.0-1.0) when the battery health was not "good". | Bh |
battery_level_pct_avg | Mean battery level (0-100). | N/A |
bluetooth_scan_ratio | Percentage of time (0.0-1.0) with bluetooth LE scanning active. | bles |
cpu_running_ratio | Percentage of time (0.0-1.0) CPU was running. | r |
cpu_resume_count_per_hour | Number of times per hour CPU became active. | r |
cpu_suspend_count_per_hour | Number of times per hour CPU became inactive. | r |
cpu_wake_count_per_hour | Number of individual CPU wakeups. | wr |
doze_full_ratio | Percentage of time (0.0-1.0) spent in full Doze mode. | di |
doze_ratio | Percentage of time (0.0-1.0) spent in any (full or light) Doze mode. | di |
gps_on_ratio | Percentage of time (0.0-1.0) GPS was switched on. | g |
max_battery_temp | Maximum battery temperature (°C x 10) during the period. | Bt |
phone_radio_active_ratio | Percentage of time (0.0-1.0) the phone radio was active (see
batterystats | Pr |
phone_scanning_ratio | Percentage of time (0.0-1.0) the phone was scanning. | Psc |
phone_signal_strength_none_ratio | Percentage of time (0.0-1.0) the phone signal strength was "none" ( | Pss |
phone_signal_strength_poor_ratio | Percentage of time (0.0-1.0) the phone signal strength was "poor" ( | Pss |
screen_on_ratio | Percentage of time (0.0-1.0) the screen was on. | S |
screen_brightness_light_or_bright_ratio | Percentage of time (0.0-1.0) the screen brightness was "light" (
| Sb |
wifi_on_ratio | Percentage of time (0.0-1.0) Wi-Fi was on. | W |
wifi_radio_active_ratio | Percentage of time (0.0-1.0) Wi-Fi was on. | Wr |
wifi_running_ratio | Percentage of time (0.0-1.0) Wi-Fi was on. | Ww |
wifi_scan_ratio | Percentage of time (0.0-1.0) Wi-Fi was scanning. | Ws |
wifi_signal_strength_poor_or_very_poor_ratio | Percentage of time (0.0-1.0) Wi-Fi signal was "poor" ( | Wss |
These metrics would be good candidates for Timeseries metrics, to monitor fleet performance over time and find outlier devices.
Battery Summary Metrics
Supported Since Android SDK 4.8.0
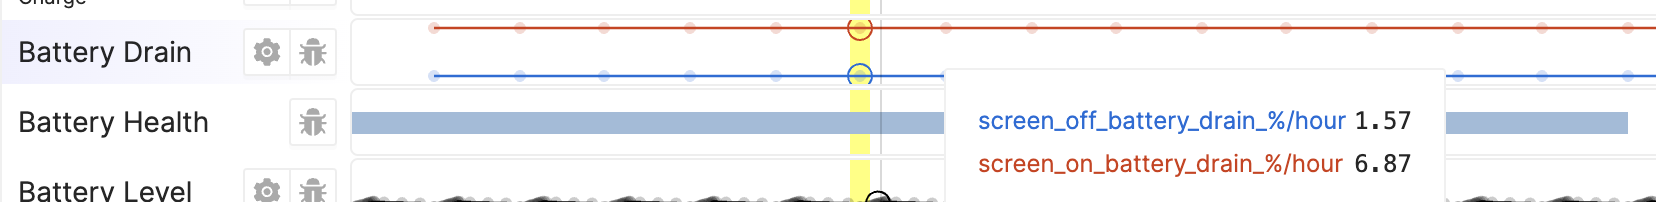
Android SDK 4.8.0 supports collecting new types of battery metrics, which show a summary of battery usage during the collection period:
| Metric | Description |
|---|---|
screen_off_battery_drain_%/hour | The battery drain rate while the screen was off — useful for isolating battery drain rate from screen usage (0-100% per hour). |
screen_on_battery_drain_%/hour | The battery drain rate while the screen was on (0-100% per hour). |
estimated_battery_capacity_mah | The battery capacity reported by Android. |
battery.charge_cycle_count.latest | Supported Since Android SDK 4.18.0 The total number of charge cycles reported by the battery (as reported
to |
The above metrics are available for use as timeseries metrics.
Additionally, per-component battery usage is displayed on timeline. The usage
(in % per hour) for component app which used >= 0.01% is shown as follows:
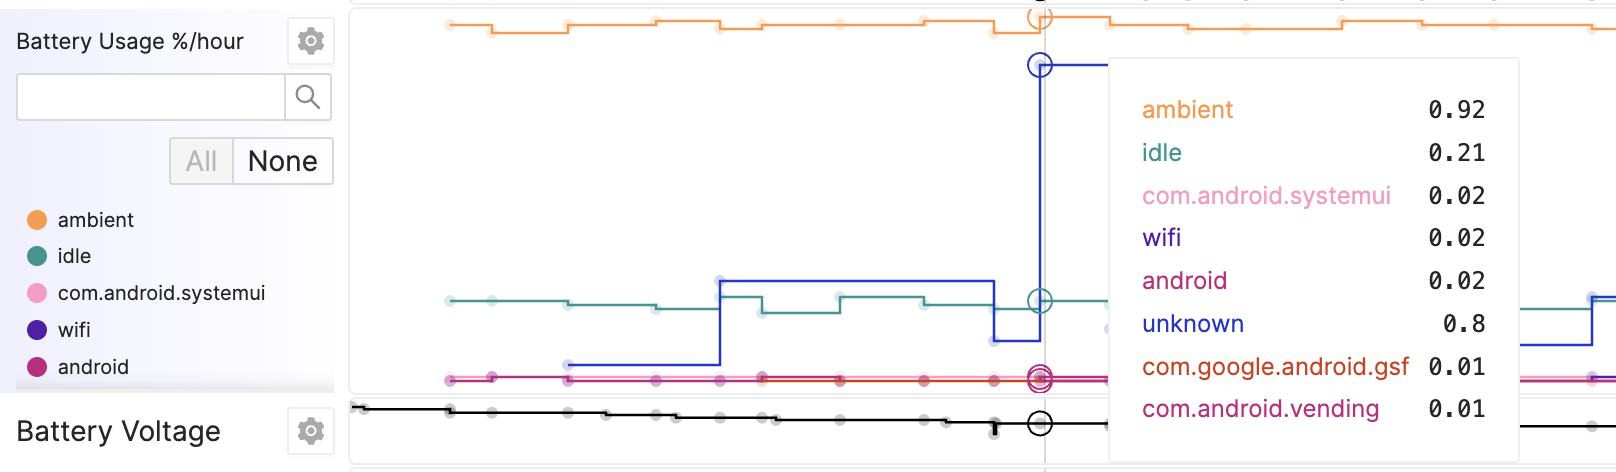
- This is shown in the
Battery Usage %/hourswimlane as shown in the screenshot, with separate entries for each component. This includes both Android OS components (e.g.cell,idle,android,screen,bluetooth,gnss) and applications (e.g.com.google.android.youtube,com.android.vending,com.whatsapp). - These per-component metrics are only displayed on timeline — they are not available as timeseries metrics.
Device Temperatures
The Android SDK regularly collects several device temperature metrics, from Android's HardwarePropertiesManager. This allows the SDK to collect the CPU and device skin temperatures programmatically.
The temperatures are reported with min/max/mean values each hour. Note that each device has a different collection of sensors — an example device with one device skin sensor and two CPU sensors might have a set of metrics like this.
- Device Skin Sensor 1
temp_skin_0.maxtemp_skin_0.meantemp_skin_0.min
- CPU Sensor 1
temp_cpu_0.maxtemp_cpu_0.meantemp_cpu_0.min
- CPU Sensor 2
temp_cpu_1.maxtemp_cpu_1.meantemp_cpu_1.min
These metrics would be good candidates for Timeseries metrics, to monitor fleet performance over time and find outlier devices.
Storage Usage
The Android SDK regularly collects device storage usage metrics from Android's Environment.getDataDirectory API.
| Metric | Description |
|---|---|
storage.data.bytes_free |
|
storage.data.bytes_total |
|
storage.data.bytes_used | The difference between |
storage.data.percentage_used | The ratio of |
These metrics would be good candidates for Timeseries metrics, to monitor fleet performance over time and find outlier devices.
Installed App Versions
The Android SDK can collect installed app versions as metrics. These can be configured on the Memfault Settings Dashboard, on the Data Sources tab, by entering package names to collect:

Wildcards can be used, to collect multiple apps sharing the same package root.
Each collected version is stored as a metric, prefixed with version.:
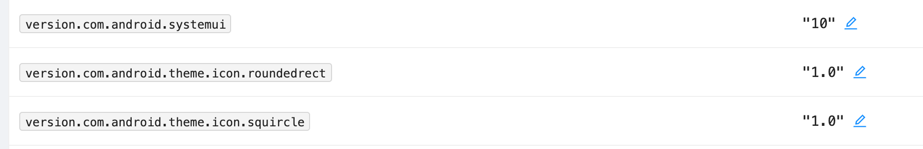
These metrics would be good candidates for Attributes, to enable e.g. searching for devices with a given app version installed, or checking the installed versions on a specific device.
System Properties
The Android SDK can collect Android System Properties. These can be configured on the Memfault Settings Dashboard, on the Data Sources tab, by entering each property to collect:

Each collected property is stored as a metric, prefixed with sysprop.:

These metrics would be good candidates for Attributes, to enable e.g. searching for devices with a given system property, or checking the properties for a specific device.
persist.sys.timezone is collected by default. This is used in the Memfault
dashboard to enable browsing in the device's time zone (ro.build.type is also
collected by default).
Connectivity Metrics
Collected Since Android SDK 4.4.0
The Android SDK collects metrics describing connectivity changes on the device:
| Metric | Description |
|---|---|
connectivity.type | The network transport, one of Aggregate time in state by hour metrics for each type are also available, for
example |
airplane_mode | Boolean for whether airplane mode is enabled. |
connectivity.validated | Boolean for whether the current network has been validated for Internet. |
connectivity.captive_portal | Boolean for whether device is connected to a captive portal. |
Network Usage Metrics
Collected Since Android SDK 4.15.0
The Android SDK will record the total device network usage stats on the device
every Heartbeat period using Android's NetworkStatsManager APIs. These are
always recorded in every Heartbeat report.
| Metric | Description |
|---|---|
network.total.in.all | Total incoming network usage (KB). |
network.total.out.all | Total outgoing network usage (KB). |
Updated In Android SDK 4.15.0
The Android SDK will also record network usage stats on the device by the
specific type of connectivity (WIFI, ETHERNET, MOBILE, or BLUETOOTH), if
the value is greater than zero for that Heartbeat period.
| Metric | Description |
|---|---|
network.total.in.bt | Total incoming Bluetooth network usage (KB). |
network.total.out.bt | Total outgoing Bluetooth network usage (KB). |
network.total.in.eth | Total incoming Ethernet network usage (KB). |
network.total.out.eth | Total outgoing Ethernet network usage (KB). |
network.total.in.mobile | Total incoming Mobile network usage (KB). |
network.total.out.mobile | Total outgoing Mobile network usage (KB). |
network.total.in.wifi | Total incoming Wi-Fi network usage (KB). |
network.total.out.wifi | Total outgoing Wi-Fi network usage (KB). |
The Android SDK will also collect per-app network usage for every app on device that exceeds the specified threshold (1MB by default). These are only visible in HRT, on the device timeline.
| Metric | Description |
|---|---|
network.app.in.bt_com.mypackage.name | Incoming Bluetooth network usage (KB) for the app. |
network.app.out.bt_com.mypackage.name | Outgoing Bluetooth network usage (KB) for the app. |
network.app.in.eth_com.mypackage.name | Incoming Ethernet network usage (KB) for the app. |
network.app.out.eth_com.mypackage.name | Outgoing Ethernet network usage (KB) for the app. |
network.app.in.mobile_com.mypackage.name | Incoming Mobile network usage (KB) for the app. |
network.app.out.mobile_com.mypackage.name | Outgoing Mobile network usage (KB) for the app. |
network.app.in.wifi_com.mypackage.name | Incoming Wi-Fi network usage (KB) for the app. |
network.app.out.wifi_com.mypackage.name | Outgoing Wi-Fi network usage (KB) for the app. |
Fleet Sampling Aspect Metrics
Collected Since Android SDK 4.5.0
These are only collected for customers using Fleet Sampling.
The active Fleet Sampling resolution for each aspect can be shown over time if HRT is enabled. These can be seen on the device timeline for devices with the debugging aspect enabled.
| Metric | Value |
|---|---|
debugging.resolution |
|
monitoring.resolution |
|
logging.resolution |
|
Fleet-sampling attributes are also reported as Heartbeat metrics. These metrics are good candidates for device attributes (to search for devices by resolution) or timeseries metrics, and can seen with hourly resolution on timeline for devices with the monitoring aspect enabled.
| Metric | Value |
|---|---|
debugging.resolution.latest |
|
monitoring.resolution.latest |
|
logging.resolution.latest |
|