An Amazing Globals Viewer and Much More
This update is all about an improved Issue / Trace viewing experience. With these new features, we are confident you'll be able to track down bugs faster than ever.
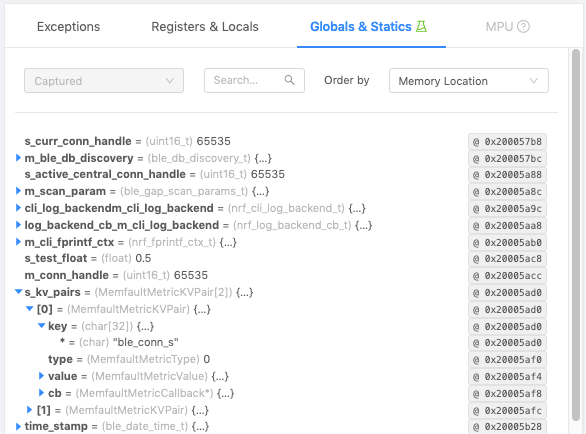
Globals and Statics Viewer
If the traces that are created are full coredumps, then you have an amazing new feature to use! It is now possible to view the device's all of the global and static variable state at the time of Trace capture in the browser!
This, along with paging through traces, allows developers to quickly find patterns between crashes and find root causes faster than ever. It's like having a GDB prompt in the browser.
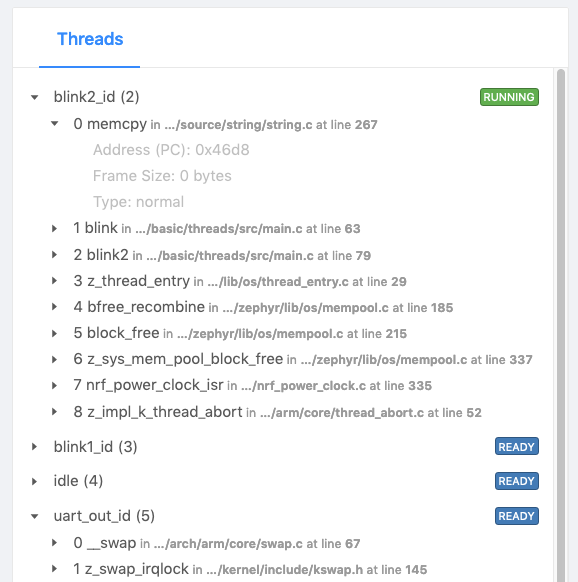
Upgraded Trace Viewer
We've overhauled the backtrace viewer to more compactly show the various threads, frames, and frame information of a Trace.
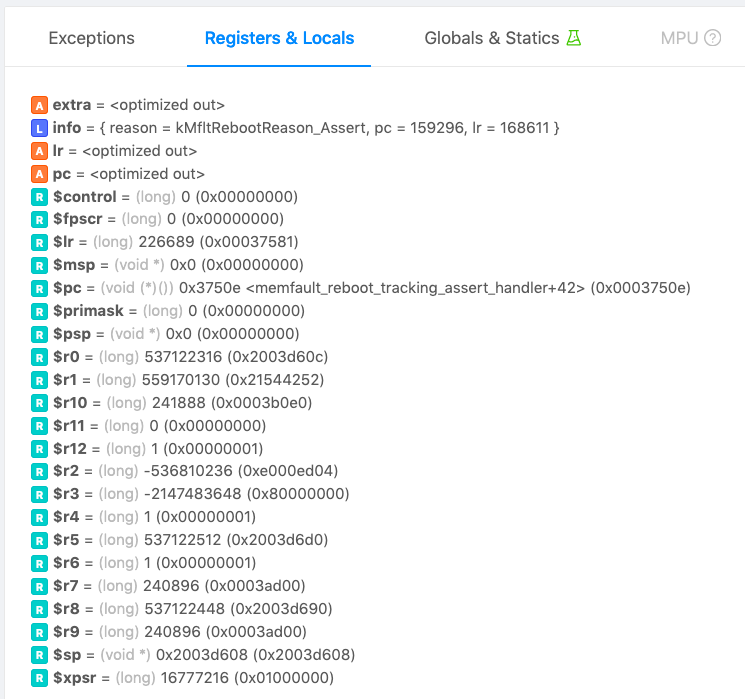
Improved Register Viewer
Keeping with the trend, we've made the Register, Local variable, and Argument viewer more beautiful and usable. For reference:
A= argL= localR= register
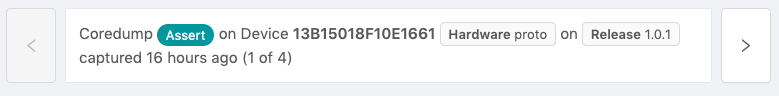
Paging through Traces within an Issue
Some bugs take many occurrences to find patterns to really find out the root cause. Memfault can now help with this as you can page through all of the individual traces within an Issue and see the different backtraces, variables, and state when the device captured it's Trace.
To use it, just click the arrows in the Issue viewer.