ARM GCC Getting Started Guide
This tutorial will go over integrating the Trace Event module of the Memfault Firmware SDK into a system that is using the GNU ARM Embedded Toolchain (GCC) compiler.
Trace events make it easy to track the frequency at which unexpected errors are occurring on a running system.
Since all the data collected by the Memfault SDK is passed opaquely up to the Memfault cloud, after following this initial guide to send Trace Events no further changes will be needed on the transport side to send any of the other types of data which can be collected by the SDK (such as coredumps and metrics).
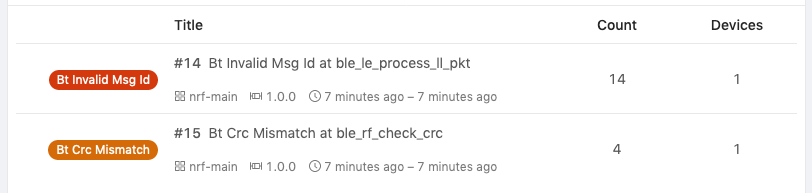
Here's an example where Trace Events are captured for Bluetooth protocol CRC errors and invalid message IDs:
Clone Memfault SDK
Using a Git client, clone the memfault-firmware-sdk
repository from:
$ git clone https://github.com/memfault/memfault-firmware-sdk.git
Add Memfault SDK to Build System
For Make or CMake based projects, the Memfault SDK provides a helper file which can be included by the build system to pick up the necessary dependencies.
For example, the Make integration looks like this:
MEMFAULT_COMPONENTS := core util
MEMFAULT_SDK_ROOT = $(YOUR_PROJECT_ROOT_DIR)/memfault-firmware-sdk
include $(MEMFAULT_SDK_ROOT)/makefiles/MemfaultWorker.mk
# [...]
YOUR_SRC_FILES += $(MEMFAULT_COMPONENTS_SRCS)
YOUR_INC_PATHS += $(MEMFAULT_COMPONENTS_INC_FOLDERS)
Manually Adding Sources
If you are using another build system, sources can also be added to the projects source list manually:
Details
- add
$MEMFAULT_FIRMWARE_SDK/components/[core, util]/includeto the include paths provided as-Iarguments to gcc - pick up the source files located at
$MEMFAULT_FIRMWARE_SDK/components/[core, util]/src.
The exact list you need for this tutorial can be found here
MEMFAULT_SDK_ROOT = $(ROOT_DIR)/memfault-firmware-sdk
MEMFAULT_CORE_SRC_DIR = $(MEMFAULT_SDK_ROOT)/components/core/src
MEMFAULT_UTIL_SRC_DIR = $(MEMFAULT_SDK_ROOT)/components/util/src

YOUR_SRC_FILES += \
  $(MEMFAULT_CORE_SRC_DIR)/arch_arm_cortex_m.c \
  $(MEMFAULT_CORE_SRC_DIR)/memfault_build_id.c \
  $(MEMFAULT_CORE_SRC_DIR)/memfault_core_utils.c \
  $(MEMFAULT_CORE_SRC_DIR)/memfault_data_export.c \
  $(MEMFAULT_CORE_SRC_DIR)/memfault_data_packetizer.c \
  $(MEMFAULT_CORE_SRC_DIR)/memfault_event_storage.c \
  $(MEMFAULT_CORE_SRC_DIR)/memfault_log.c \
  $(MEMFAULT_CORE_SRC_DIR)/memfault_ram_reboot_info_tracking.c \
  $(MEMFAULT_CORE_SRC_DIR)/memfault_reboot_tracking_serializer.c \
  $(MEMFAULT_CORE_SRC_DIR)/memfault_sdk_assert.c \
  $(MEMFAULT_CORE_SRC_DIR)/memfault_serializer_helper.c \
  $(MEMFAULT_CORE_SRC_DIR)/memfault_trace_event.c \
  $(MEMFAULT_UTIL_SRC_DIR)/memfault_base64.c \
  $(MEMFAULT_UTIL_SRC_DIR)/memfault_chunk_transport.c \
  $(MEMFAULT_UTIL_SRC_DIR)/memfault_circular_buffer.c \
  $(MEMFAULT_UTIL_SRC_DIR)/memfault_crc16_ccitt.c \
  $(MEMFAULT_UTIL_SRC_DIR)/memfault_minimal_cbor.c \
  $(MEMFAULT_UTIL_SRC_DIR)/memfault_varint.c

YOUR_INC_PATHS += \
   $(MEMFAULT_SDK_ROOT)/components/core/include \
   $(MEMFAULT_SDK_ROOT)/components/util/include
Create trace reasons definition file
Aside from the program counter and return address, a Trace Event also contains a
user-defined "error reason". The list of custom reasons is defined in a separate
configuration file named memfault_trace_reason_user_config.def which you need
to create.
The memfault_trace_reason_user_config.def file will get #include-ed, so make
sure the directory in which you create the file is part of the header search
paths.
To start, we recommend adding a "test" trace error reason you can easily trigger (i.e via a CLI command) and a couple for error paths in your codebase (such as peripheral bus read/write failures, transport errors and unexpected timeouts).
Here is what the memfault_trace_reason_user_config.def file should look like:
// memfault_trace_reason_user_config.def
MEMFAULT_TRACE_REASON_DEFINE(test)
MEMFAULT_TRACE_REASON_DEFINE(your_custom_error_reason_1)
MEMFAULT_TRACE_REASON_DEFINE(your_custom_error_reason_2)
// ...
Generate Some Trace Events
Next, we'll need to use the MEMFAULT_TRACE_EVENT macro to capture a trace
event when an error occurs.
Note that it is perfectly fine to use the same reason in different places if that makes sense in the context of your code. Because the program counter and return address are captured in the Trace Event, you will be able to see the two topmost frames (function name, source file and line) in Memfault's Issue UI and distinguish between the two.
For test purposes, you can add a CLI command that logs a Trace Event:
#include "memfault/core/trace_event.h"
// [ ...]
void test_trace_event_cli_cmd(void) {
    MEMFAULT_TRACE_EVENT(test);
}
You can also start to add Trace Events for error paths you are interested in tracking:
#include "memfault/core/trace_event.h"
// [ ...]
void ble_le_process_ll_pkt(...) {
  // ...
  if (invalid_msg_id) {
    MEMFAULT_TRACE_EVENT(bt_invalid_msg_id);
    // ...
  }
  // ..
}
Implement Platform Dependencies
In order to save traces, you will need to implement the dependency functions below:
#include "memfault/core/platform/debug_log.h"
#include "memfault/core/platform/device_info.h"

void memfault_platform_log(eMemfaultPlatformLogLevel level, const char *fmt, ...) {
  // Hook up to your logging implementation.
  // The Memfault SDK will call this API sparingly when issues are detected to aid in debug
}
#include "memfault/core/platform/device_info.h"

void memfault_platform_get_device_info(sMemfaultDeviceInfo *info) {
  // !FIXME: Populate with platform device information
  //
  // *NOTE* All fields must be populated, and the values assigned to the fields
  // must have static lifetime: the data is accessed when this function returns.
  // In this example, the fields are string literals, which are placed either
  // inline into .text data tables, or in .rodata, and the pointers are valid
  // for the lifetime of the program
  //
  // See https://mflt.io/version-nomenclature for more context
  *info = (sMemfaultDeviceInfo) {
    // Set the device serial to a unique value.
    // It is typically set to a unique identifier like a serial number
    // or MAC address.
    // This is used to de-deduplicate data in Memfault cloud
    .device_serial = "DEMOSERIAL",
    // Set the device software type.
    // It can be simply "app" for a single-chip device, otherwise it
    // should match the component name, eg "ble", "sensor" etc.
    // This is used to filter devices in the Memfault UI
    .software_type = "app-main",
    // Set the device software version.
    // If using Memfault OTA, this should exactly match the OTA Release
    // Version name for the installed image
    .software_version = "1.0.0-dev",
    // Set the device hardware revision.
    // This is used to filter/group devices in the Memfault UI
    .hardware_version = "evt",
  };
}
Initialize Trace Module on Bootup
All events generated in the Memfault SDK are stored and transmitted using a
compressed format (CBOR). As they await to be sent, they are stored in the
"event storage" core component. The size of each Trace Event requires ~50 bytes
of storage. The exact size needed to store a single event can be determined with
memfault_trace_event_compute_worst_case_storage_size(). On bootup, initialize
Trace Event storage like this:
#include "memfault/core/debug_log.h"
#include "memfault/core/event_storage.h"
#include "memfault/core/trace_event.h"
// [...]
int main(void) {
  // [... other initialization code ...]

  // Budget storage for up to ~5 Trace Events (~50 bytes each):
  static uint8_t s_event_storage[250];
  const sMemfaultEventStorageImpl *evt_storage =
      memfault_events_storage_boot(s_event_storage, sizeof(s_event_storage));

  // Minimum storage we need to hold at least 1 Trace Event
  const size_t bytes_needed = memfault_trace_event_compute_worst_case_storage_size();
  if (bytes_needed > sizeof(s_event_storage)) {
    MEMFAULT_LOG_ERROR("Storage must be at least %d for events but is %d",
                       (int)bytes_needed, sizeof(s_event_storage));
  }

  // Pass the storage to initialize the Trace Event module
  memfault_trace_event_boot(evt_storage);
}
At this point data collection for Trace Events is fully implemented! Now we just need to push the data to the Memfault cloud ...
Create a Project and get a Project Key
Go to app.memfault.com and from the "Select A Project" dropdown, click on "Create Project" to setup your first project. Choose a name that reflects your product, such as "smart-sink-dev".
Once you've created your project, you'll be automatically taken to an page that includes your project key. Copy the key and follow the rest of this guide.
Publish data to the Memfault cloud
Extensive details about how data from the Memfault SDK makes it to the cloud can be found here. In short, the Memfault SDK packetizes data into "chunks" that must be pushed to the Memfault cloud via the chunk REST endpoint
A typical integration looks like this:
#include "memfault/core/data_packetizer.h"
// [...]

bool try_send_memfault_data(void) {
  // buffer to copy chunk data into
  uint8_t buf[USER_CHUNK_SIZE];
  size_t buf_len = sizeof(buf);

  bool data_available = memfault_packetizer_get_chunk(buf, &buf_len);
  if (!data_available ) {
    return false; // no more data to send
  }

  // send payload collected to chunks endpoint
  user_transport_send_chunk_data(buf, buf_len);
  return true;
}

void send_memfault_data(void) {
  // [... user specific logic deciding when & how much data to send
  while (try_send_memfault_data()) { }
}
Upload Symbol File
At this point, you should be able to generate a test Trace Event and push it to the Memfault UI. You can confirm the issue has arrived successfully by navigating to the "Issues" page. Follow the link pointed to below and upload a symbol file.
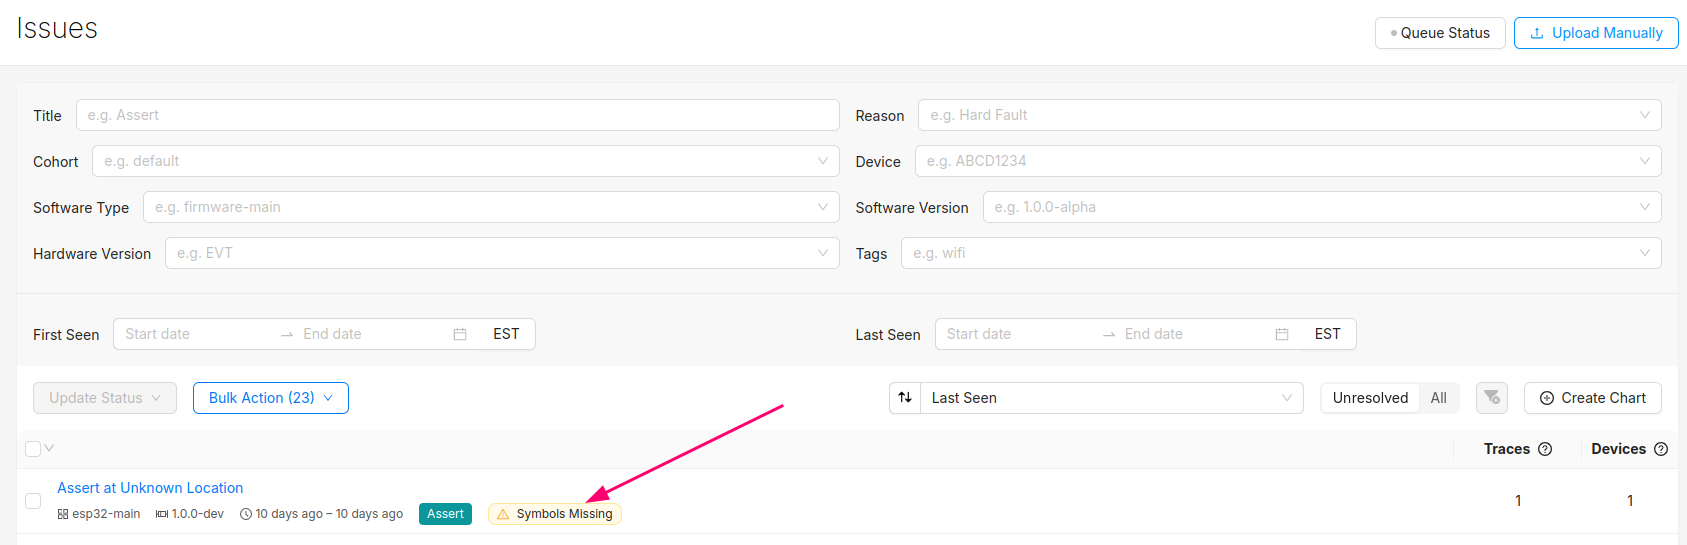
After this step, you will see the trace in the list of issues!
You can programmatically upload symbol files with the Memfault CLI tool.
Troubleshooting Data Transfer
See the docs on data transfer troubleshooting.
Next Steps
With the transport path in place and a minimal set of data flowing, there's now a number of firmware-only changes which can be made to start collecting other diagnostic data from your system. You can find links to step-by-step guides for integrating each subsystem here.