August 2026
Highlights
Saved Device Searches
Device searches can now be saved, named, and reused across the app, the same way saved issue searches already work. Build a filter on the Devices page, save it, and it becomes available from the search dropdown, from a dedicated "All Saved Searches" page under the Devices section of the sidebar, and - for the searches you pin - directly in the sidebar itself. Saved searches show an asterisk when you have unsaved edits, and can be renamed or deleted from the kebab menu without rebuilding the filter from scratch.
The video above walks through saving a device search, managing it from the list page, and pinning it to the sidebar.
Redesigned Top Navigation
The top navigation bar has been updated to match our design system, following last month's side navigation refresh. Icon sizing is now consistent across the bar, notifications have a clearer megaphone icon, and the timezone picker is now a button that displays the timezone you currently have selected instead of hiding it behind a menu. The redesign also brings a round of accessibility improvements to the header controls.

General
-
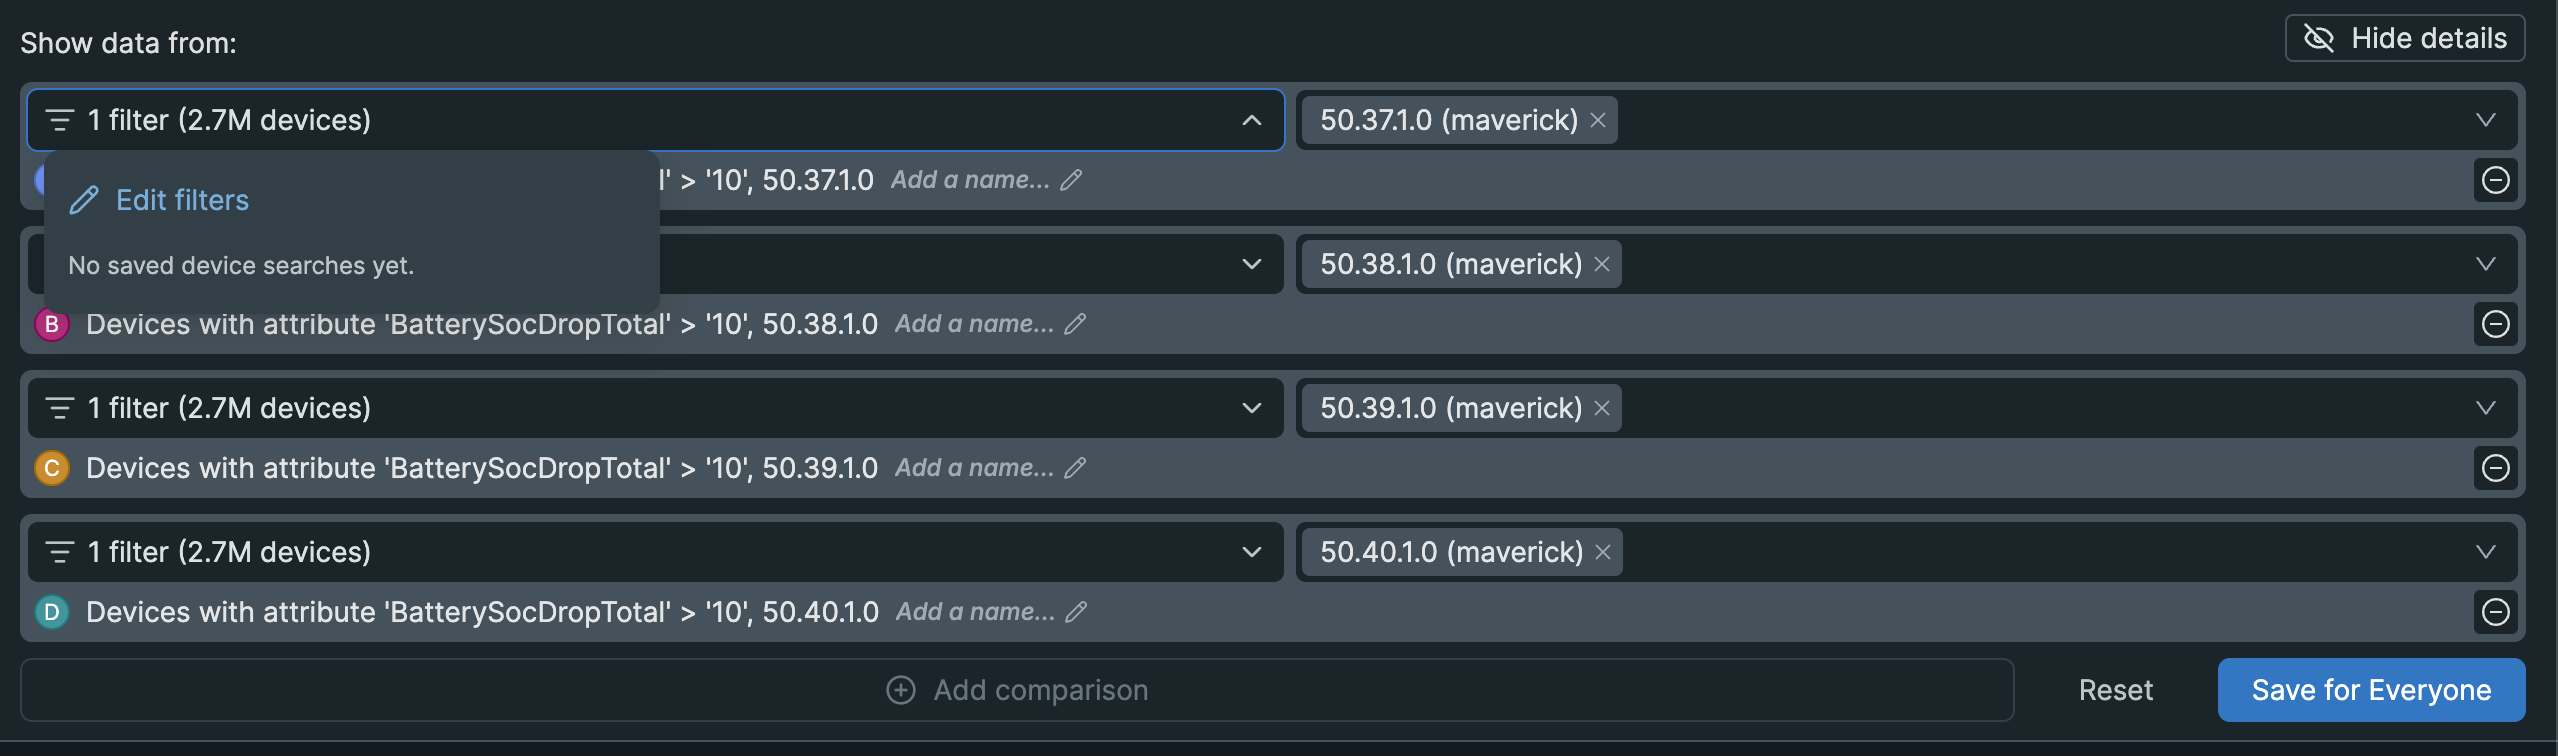
Dashboard filters can now be driven by a saved device search. The device filters button is replaced by a dropdown where you pick an existing saved search or build a new ad-hoc one. Device Set charts are created the same way now - from a chart modal on the dashboard rather than from the Devices page - and each one stays linked to its saved search, so a chart's filters can be refined after the chart is created. Refining a search doesn't rewrite historical data.
-
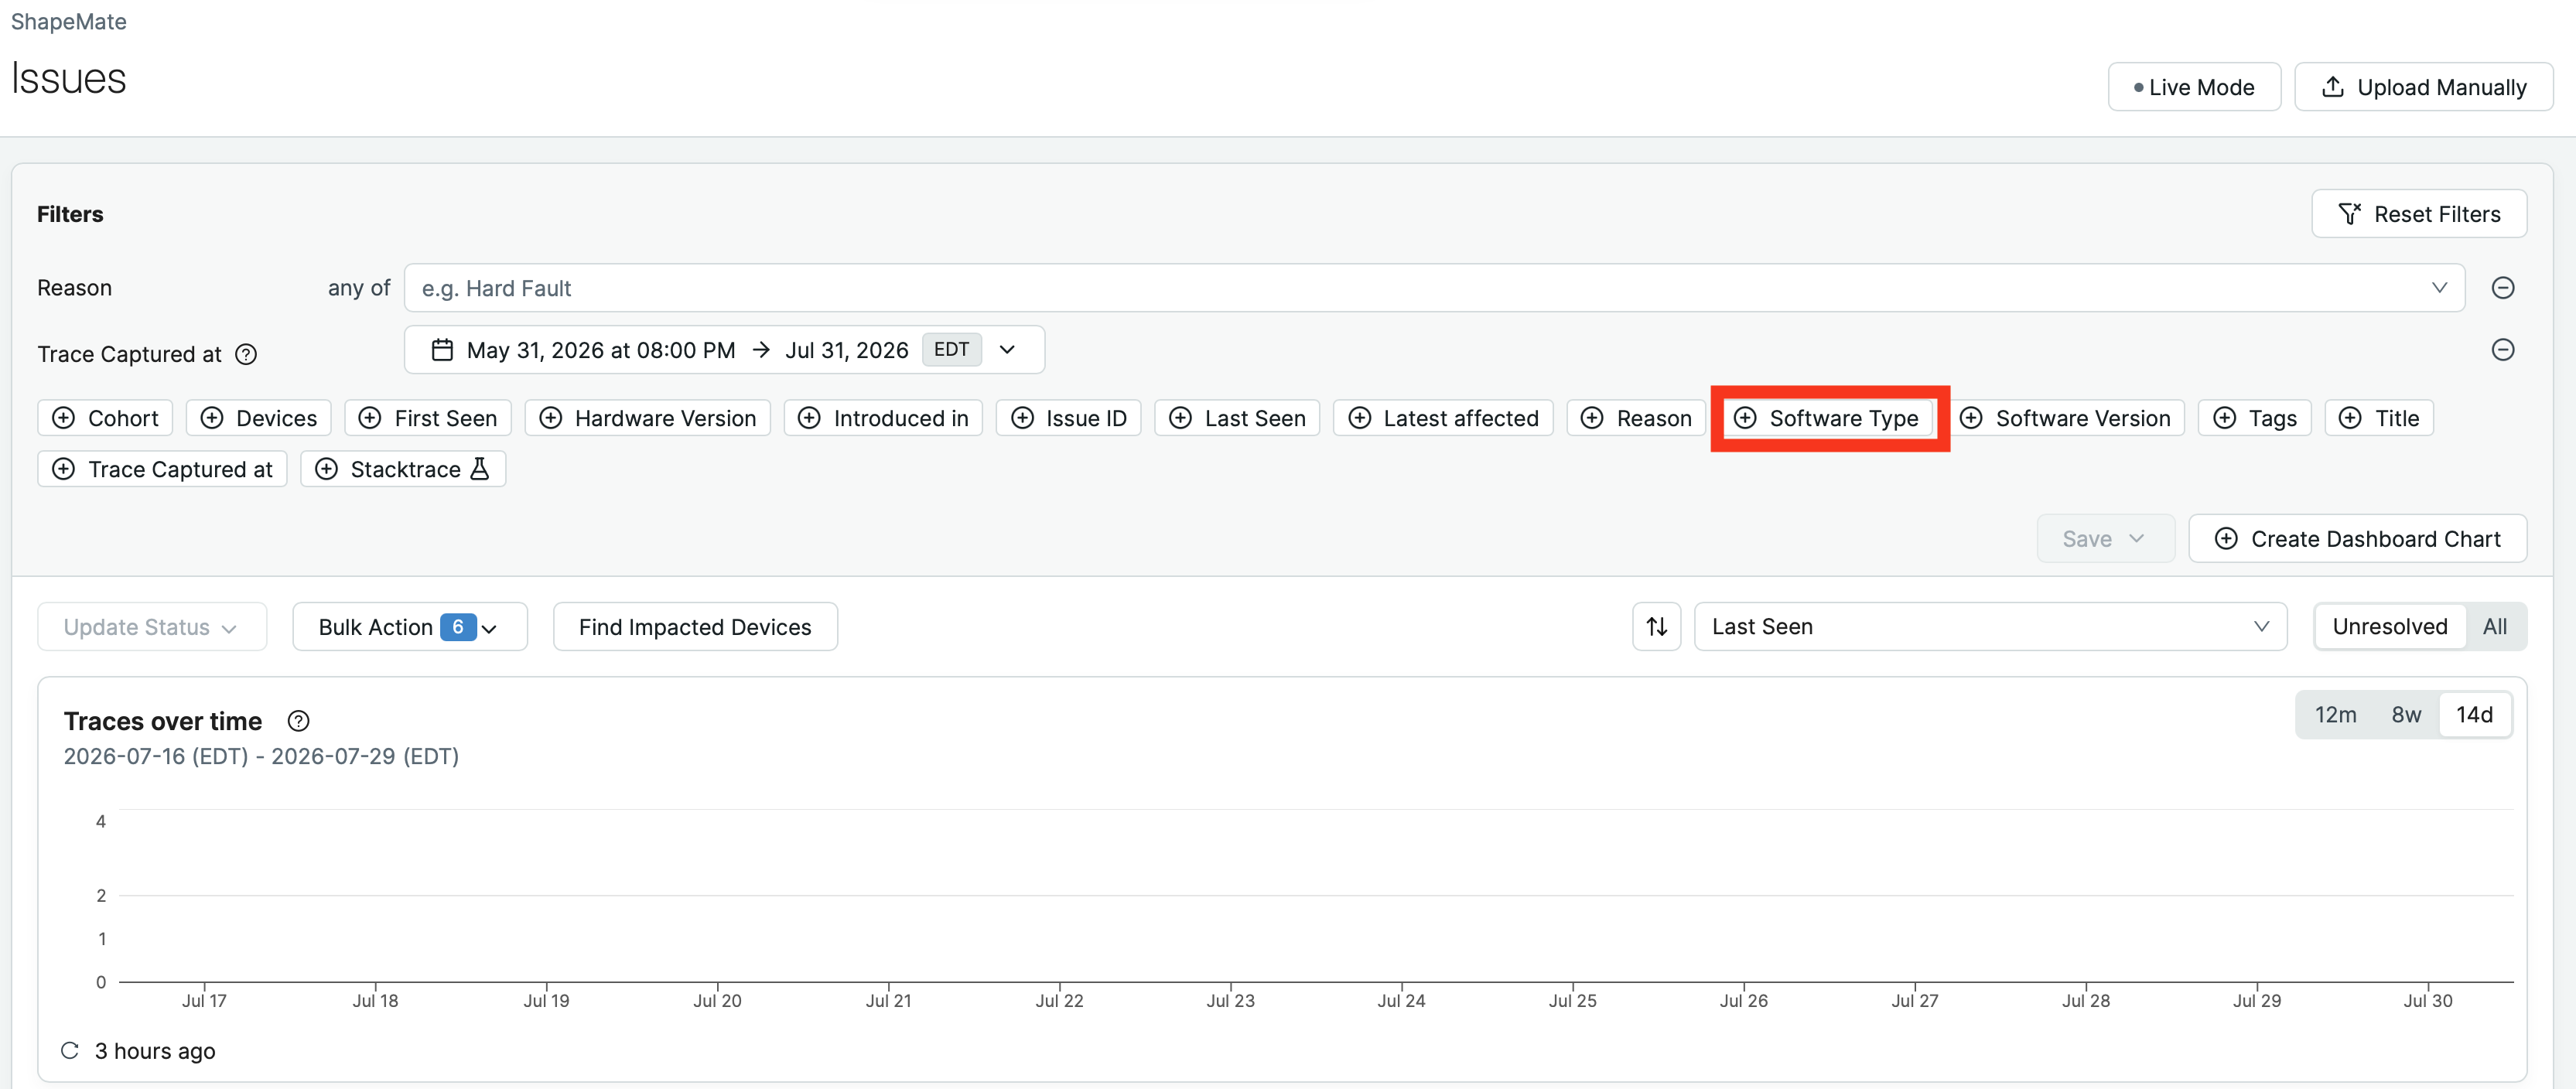
Issues now has a first-class Software Type filter. This was previously only possible by filling a Software Type into the Software Version field; the new filter is a direct, discoverable control, and the old flow still works for anyone already using it.
-
Issue device counts are now links. From the issue list, the issue detail page, and the Top 5 Issues dashboard card, clicking the count of impacted devices takes you to that exact list of devices - any filters applied on the issue list carry through, so the device list you land on matches the count you clicked.
-
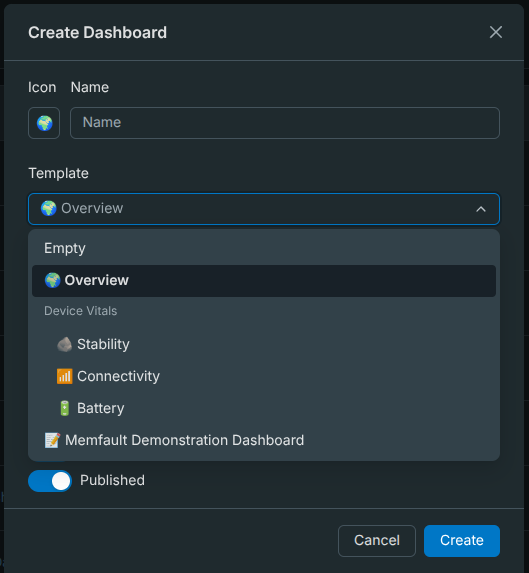
Dashboards can now be created from the Overview template. Previously this dashboard only appeared when a new project was created, so there was no way to get it back if it was modified or deleted.
-
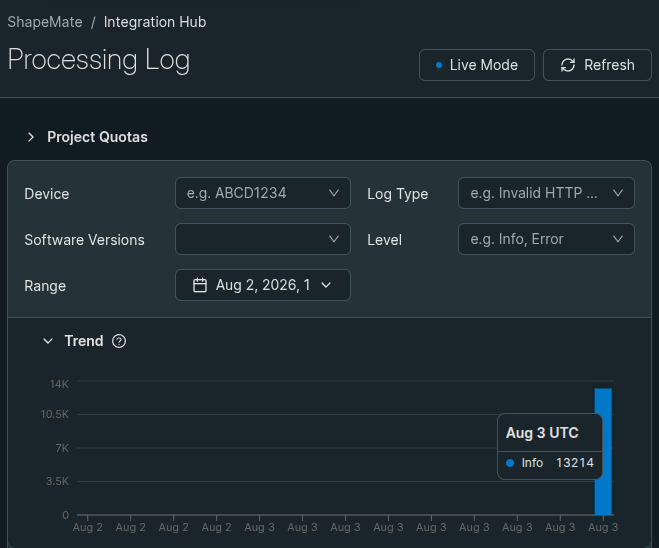
Processing Log is now reachable per-device: a Processing Log tab on the device details page shows everything arriving from that device, and a "filter to this device" button on log entries jumps straight to a device-scoped view. A toggleable trend chart at the top of the log makes it easier to spot when processing problems started.
-
Webhook deliveries in the Processing Log now record which device triggered them, how many delivery attempts were made, and why an attempt failed - previously there was no way to tie a device alert webhook back to a specific device.
-
Alert webhook reliability improved on two fronts: deliveries that fail with a dropped connection are now retried like timeouts already were (instead of being dropped after a single attempt), and each delivery gets its own connection, so an endpoint that closes idle connections no longer fails the next delivery on a dead socket.
-
Symbol file uploads accept a file dropped anywhere on the Symbol Files page, instead of requiring a click into the upload modal first.
-
Device Reports tab now defaults to the last 7 days instead of the full monitoring retention window, which made the tab slow to load on projects with a year of retention. The date filter can still be widened as needed.
-
A First Seen tile is now available on the Device Details page, showing the first date a device was seen, in the same tile format as Last Seen.
-
Issue Insights now shows a disabled Generate button with an explanatory tooltip when AI features are turned off, nudging you to enable them or contact an admin, instead of hiding the button entirely.
-
Project Settings → Hardware columns are now sortable, which makes it much easier to find your highest-device-count hardware versions.
-
Attribute metric quota usage ("4 of 10") now sits beside the toggle that enables it, matching how timeseries metric usage is displayed, rather than below the fold.
-
CVE scanning now has a proper empty state when no SBOMs have been uploaded, instead of an empty table.
-
Fixed the Last Seen / First Seen date filters on the Devices page (and the audit log date filter) disabling every day except today when a project has no retention limit set, making custom absolute ranges unusable.
-
Fixed Device Timeline rendering empty swimlanes for SDK metrics that Debug Mode is meant to hide, so toggling Debug Mode now hides both the data and its rows.
-
Fixed Linux traces showing "missing symbol file" log warnings on on-device stack traces. Linux coredumps don't require symbol files to decode.
-
Fixed coredump processing crashing on devices with newer glibc versions, which extended the
auxvsection with entries Memfault didn't recognize. Unrecognized entries are now skipped rather than treated as an error. -
Log in with myNordic Users can now log-in using their myNordic account on app.memfault.com. Learn more about myNordic here.
Device SDK Updates
MCU: [1.44.0] - 2026-08-28, [1.43.0] - 2026-08-05
See the full MCU SDK changelog.
- Added an IRQ-based locking path for Zephyr applications built without
multithreading, where mutexes aren't available. The new
MEMFAULT_PLATFORM_LOCK_SOURCEKconfig choice selects between mutex, IRQ lock, and a custom implementation you provide. - Added a Bluetooth connection Metrics Session on nRF Connect SDK that
tracks connection and disconnect codes, captured automatically when
CONFIG_MEMFAULT_METRICS_BLUETOOTHis enabled. - Added a new Bluetooth metric,
bt_total_connected_time_ms, tracking total time any connection was active across all connections - useful for multi-connection applications where the existing per-connection metric is misleading. - Added a compile-time check on the FreeRTOS timer task stack depth, which
errors if
configTIMER_TASK_STACK_DEPTHis under 256 words. The metrics heartbeat callback runs on the timer daemon task, and too small a stack risks an overflow. - Fixed a Bluetooth connection reference leak in multi-connection peripheral applications, where connecting a second peer before the first disconnected leaked a reference to the first connection.
- Fixed the nRF MRAM coredump backend, which broke against an upstream
change that added a mutex to the
flash_write()path. The backend now writes to MRAM directly, matching the RRAM implementation.
Android: [5.10.0] - 2026-08-04
See the full Bort changelog.
- Added Android 17 support.
- Added cellular metrics collected from
TelephonyManager- MCC, MNC, RAT and SIM state as properties, plus signal level, signal dBm, RSRP and RSRQ as gauges (RSRP and RSRQ on LTE/NR only). Enabled by default via the newmetrics.collect_cellularsetting. - Metrics for hardware a device doesn't have are no longer collected. Cellular, Wi-Fi, Bluetooth, GPS, screen, camera, and battery metrics are now gated on the hardware actually being present, not just on server-pushed data source settings.
- Thermal metrics now report one max per package type (
thermal_cpu_c_max,thermal_gpu_c_max,thermal_npu_c_max,thermal_skin_c_max) instead of one metric per sensor. Battery thermal metrics are unchanged. - Added the
bort.db_synchronous_modesetting, exposed in the Memfault dashboard as "Local Storage Write Durability", which maps to SQLite'sPRAGMA synchronousfor Bort-owned databases. - Fixed CPU usage spikes reported against processes that restart, and improved process name resolution so usage from other processes sharing a UID is no longer attributed to Bort.
- Visibility levels now gate metric collection, not just upload.
Linux: [1.28.0] - 2026-08-31
See the full Linux SDK changelog.
memfaultdcan now capture custom attributes into a coredump at the moment of the crash. Attributes configured undercoredump.attributes(or incoredump.attributes_file) are copied into the trace record as an immutable snapshot of their value when the crash happened, unlike device attributes.- The chunk relay feature has graduated out of experimental status and is
enabled by default. It now supports multiple chunk encodings and forwards
relayed chunks end-to-end to chunks ingress, and
memfaultctl write-chunkstakes an explicit--encodingflag matching thememfaultCLI'spost-chunk. - Added memory fragmentation metrics parsed from
/proc/buddyinfo, reported asmemory/buddyinfo/order_0throughmemory/buddyinfo/order_<N>. Order columns are parsed dynamically, so the metrics work regardless of the kernel'sMAX_ORDER. - Added support for the
wrynose(6.0) Yocto release. enable_data_collectionis now enabled by default. Devices that should keep it disabled need an explicitfalsein/etc/memfaultd.conf.- Reduced peak heap usage in the log collector by roughly a third (~525 KB to ~360 KB) by sharing incoming log entries between log layers instead of deep-cloning them.
- Fixed a crash when binding to a configured syslog log source.