August 2020
Custom Metric Dashboards
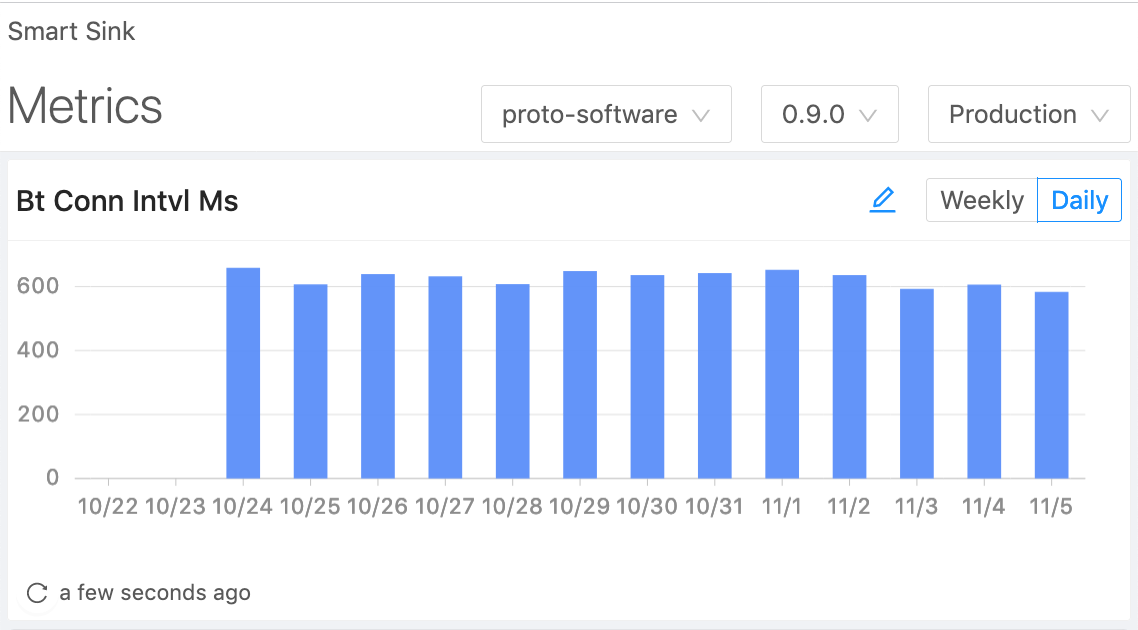
Memfault captures heartbeat metrics from devices. These metrics can then be viewed on a per-device basis. Customers have been asking for the ability to perform aggregates on these metrics over a fleet of devices.
We are happy to say this feature is now available! Once a metric chart is created, you can aggregate over the devices within a cohort or across a software version.
General Improvements
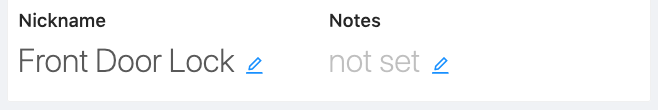
- You can now set the Device nickname and notes in the UI
- Allow force-refreshing the metric dashboards
- Issue filtering has been improved dramatically
Real Time Specific Improvements
- Zooming on Metrics Browser
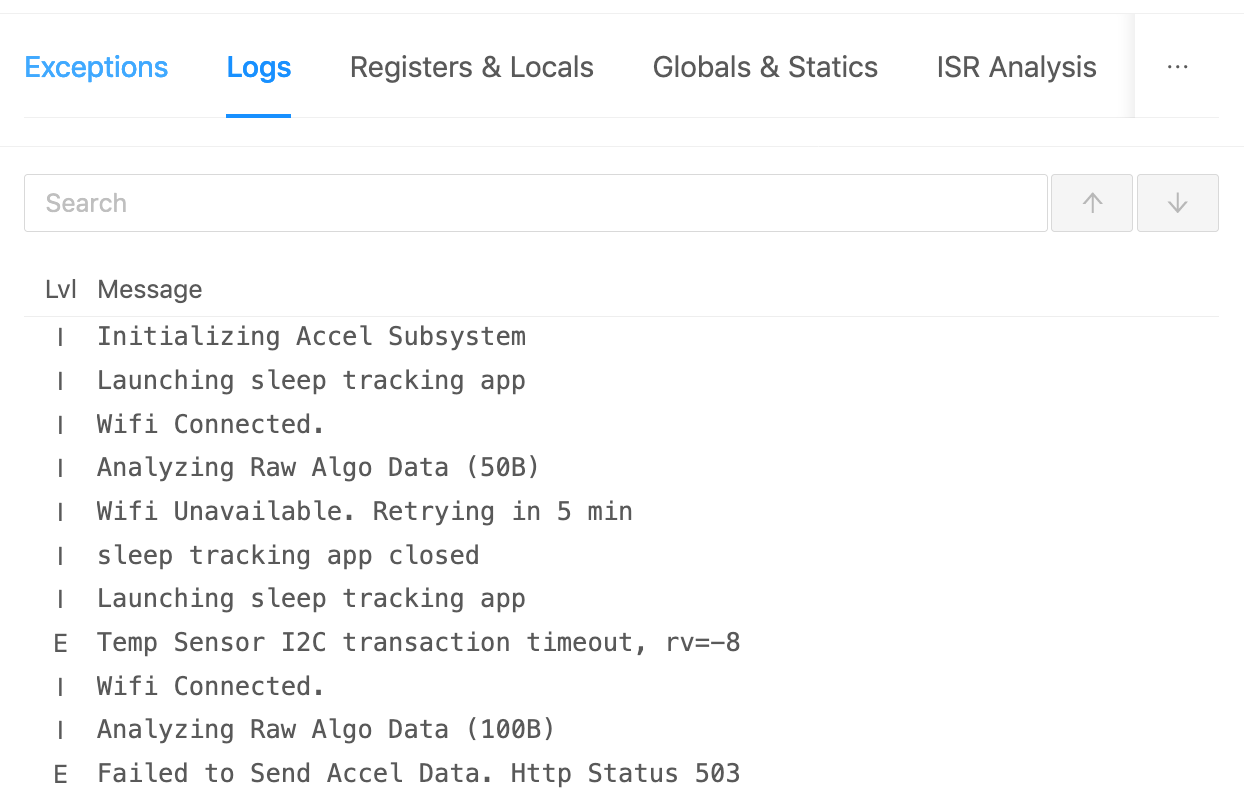
- Logs can now be captured within a coredump and can be viewed within the Issues UI.
- Thread Support for NuttX
- Add support for the TI CCS ARM Compiler
- For more details on the changes to the Firmware SDK that didn't make the changelog, check out the Memfault Firmware SDK changelog.
Android Specific Improvements
- SELinux violations are now attributed to an application.
- Progress has been made to support Android 8. Stay tuned.
- For more details on the changes to the Android Bort SDK that didn't make the changelog, check out the Memfault Bort SDK changelog.