
May 2023

Simplified Debugging with Device Timezone in Memfault

The Timezone selector allow users to adjust the timezone within which all information viewed in Memfault is contextualized for that session. Currently, the timezone selections available include “Browser” (browser default), “Universal” (UTC), “Device” (configurable) and “Custom” (region selection).

Timezone selection within Memfault is designed to make it easier for international teams working with globally deployed devices to contextualize, coordinate and collaborate. Whether you want to standardize working within the “Universal” timezone across your team, or you want to use the “Custom” or “Device” options to adjust your session to the specific local timezone of a device you are debugging, having this type of control over context can be powerful.

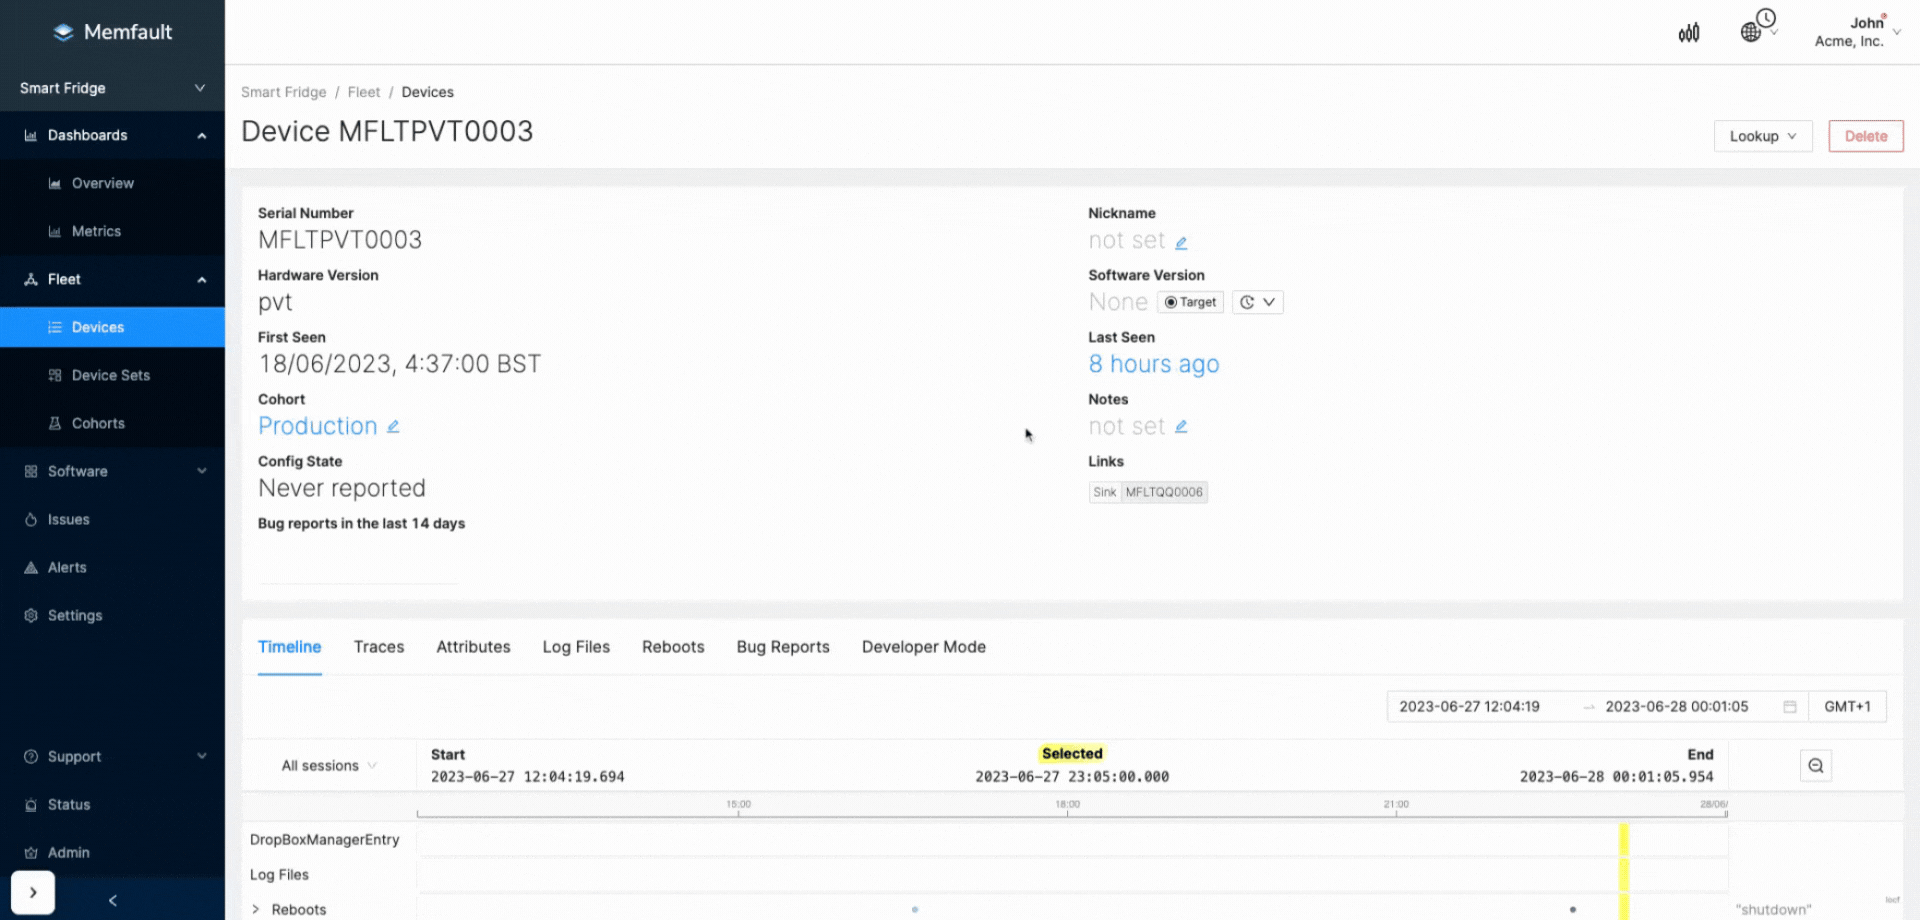
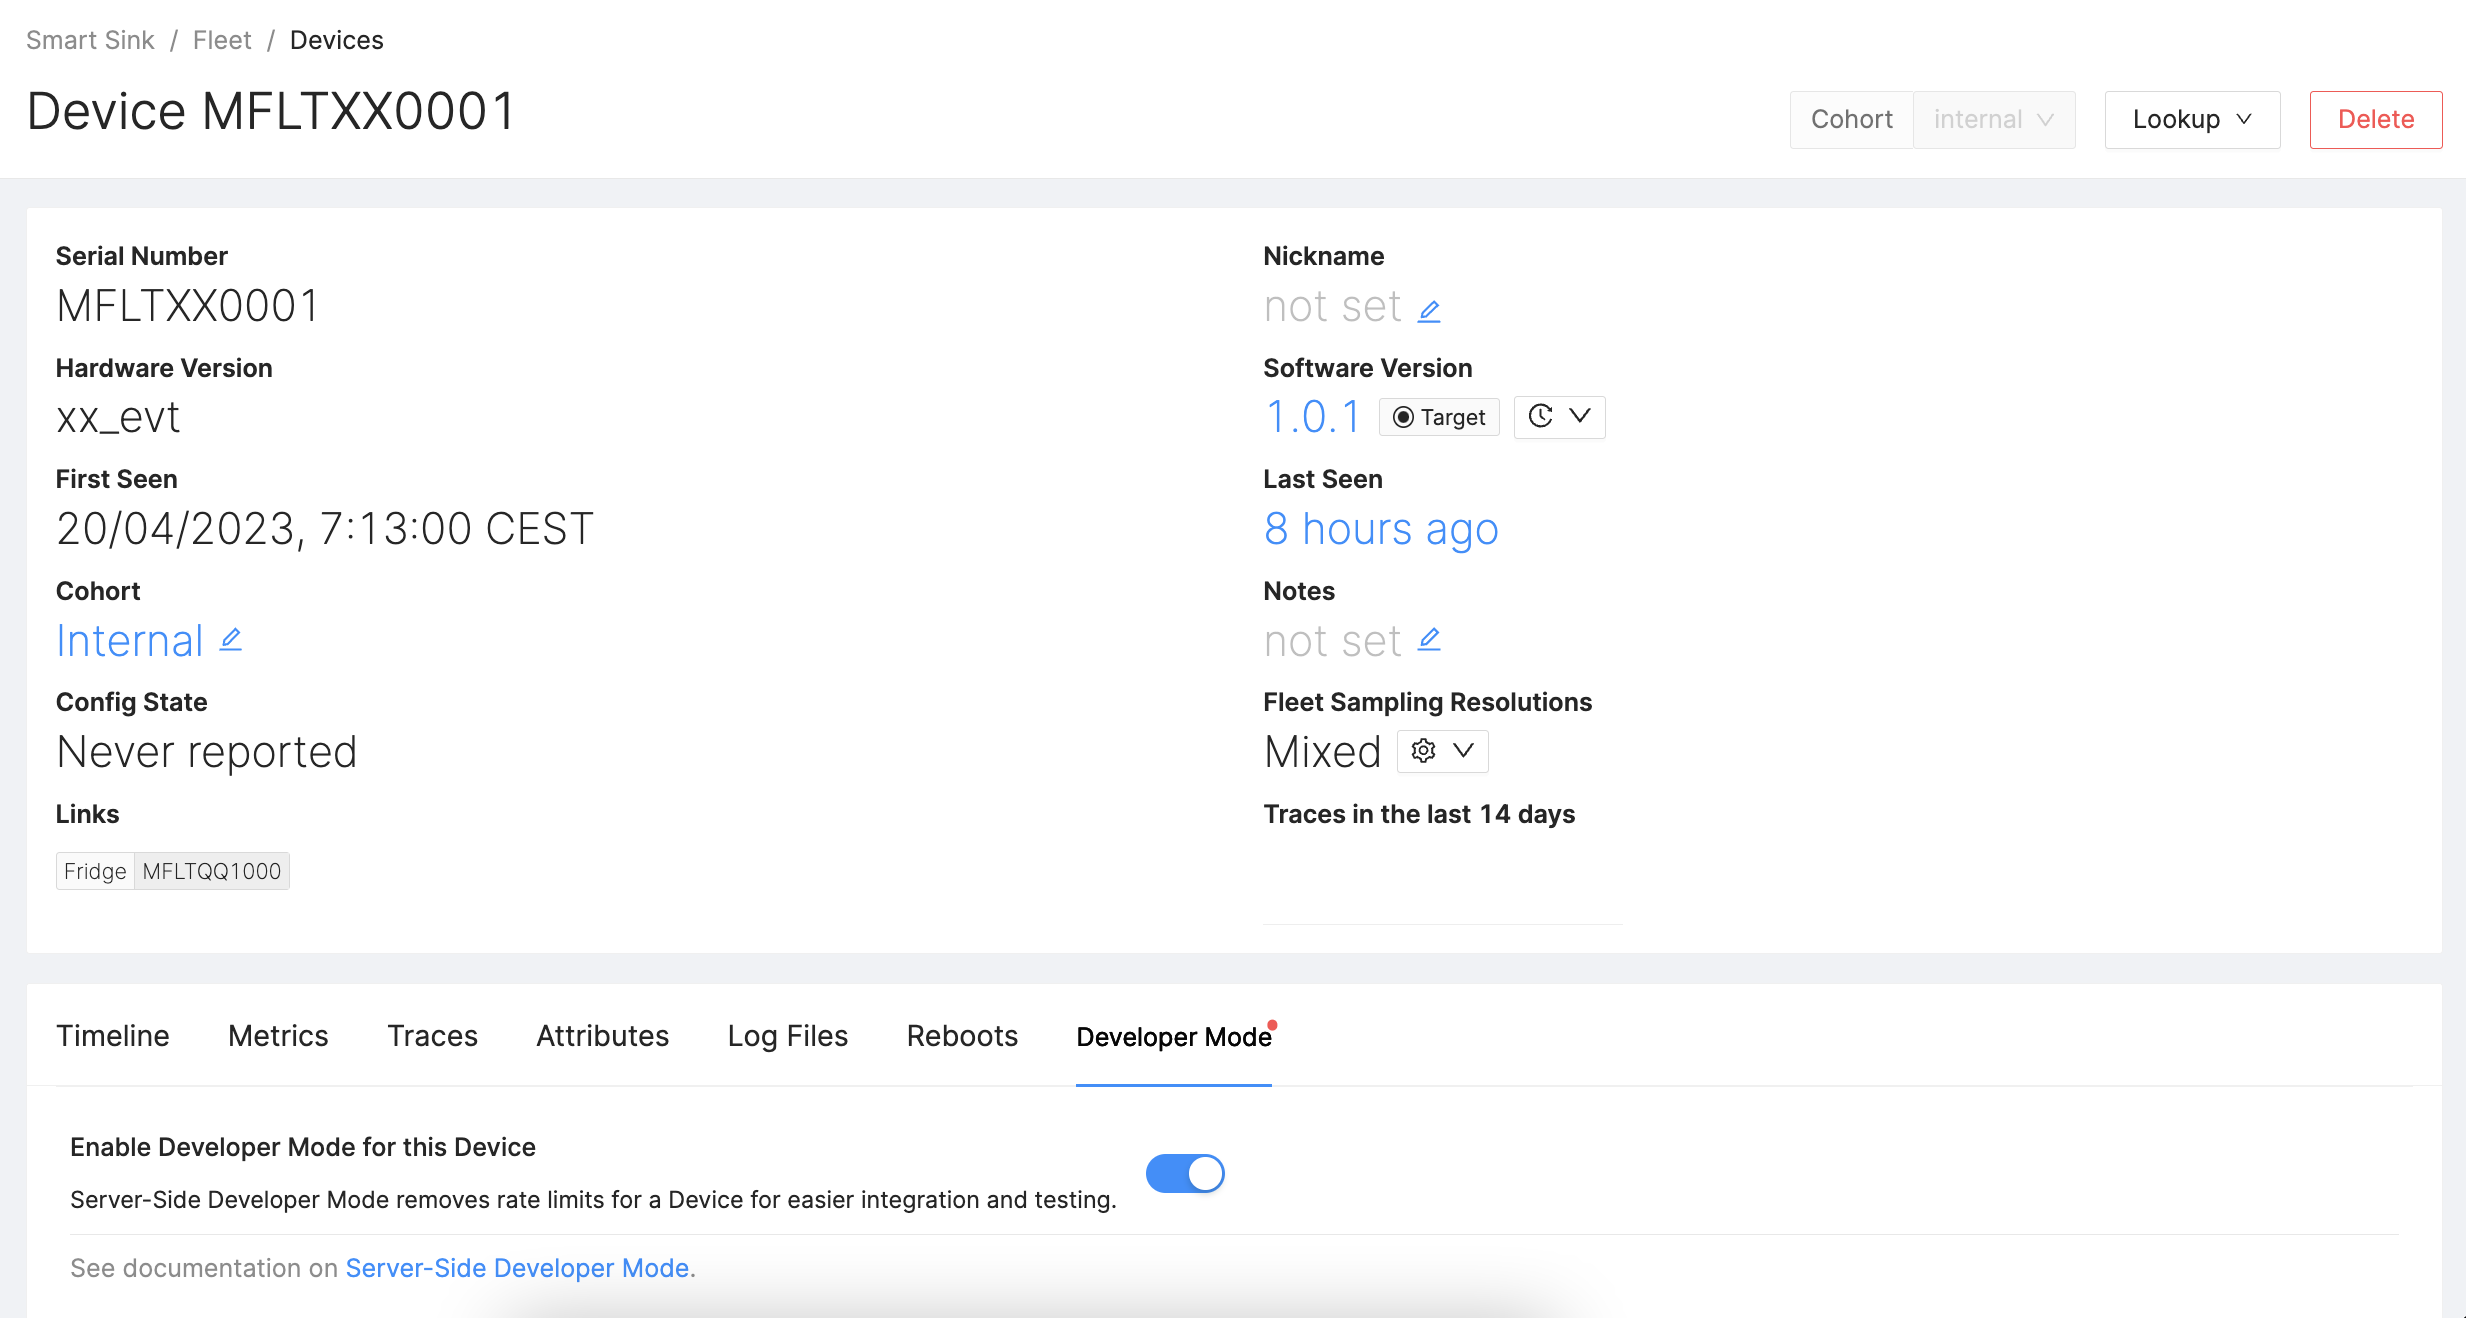
To provide a specific example, let’s say you receive a report of a customer having an issue with a device via your support team. The end user has reported a problem at 11am this morning. Rather than the developer needing to do the calculation manually they can just adjust to the correct “Custom” timezone assuming they know where that device was located. This process is even quicker if “Device” timezone is configured and takes a single click with no additional information required.

This month we made some improvements to the function of the “Device” timezone selection for Android devices. This selection is now available by default for Android devices using the persist.sys.timezone system property.

You can read more about timezones here and about the Android specific “Device” timezone metric collection here.

April 2023

Server-Side Support for Developer Mode

Developer Mode now allows you to temporarily remove any server-side rate limiting on devices from within the device view. This new functionality gives you full control over your integration/testing process with no imposed requirement to pause or prematurely switch between devices because a rate limit has been hit.

This will make it easier to integrate, configure and test new Memfault features and accelerate the testing, debugging and feature development processes of your own products using Memfault.

Developer Mode is activated on a per-device basis and will remove all rate limiting for uploads from the device to Memfault of coredumps, bug reports, heartbeats and other data. This Server-Side Developer Mode functionality is an extension of the existing device-side Developer Mode (Android, Linux) and they can be used in tandem or independently.

Memfault Support for Cortex-R

Memfault has expanded its coverage of Arm-based devices adding support for coredumps on Arm Cortex-R. This allows customers to realize the full value of the Memfault monitoring, debugging and update capabilities on more of their Arm-based devices.

For customers already familiar with integrating the Memfault Firmware SDK on Cortex-M devices, the process for Cortex-R-based devices is very similar, with the only minor difference in the integration of the exception/interrupt handlers on Cortex-R. For more information on how to complete the integration, please review our Arm Cortex-R integration guide.

March 2023

New Access Control Permissions: Teams and Roles

Memfault added new concepts for access control: Teams are a flexible way to group members of an organization. They can reflect an actual company structure with functions such as “quality assurance” or “firmware engineering.” Alternatively, with Roles, administrators can design teams solely to manage permissions more conveniently when assigning dedicated roles on a per-project level.

Teams and Roles allow for configuration scenarios such as “read-only access for this department” or “OTA must only ever be performed by these four people.” They further allow for sophisticated setups such as “these five contractors may only ever see this one project and nothing else” or “newly invited members of the organization can do anything with our playground project but are otherwise limited to read-only access.”

Using this new system is strictly optional as all members of an organization are part of the group “everyone” that grants permission to all of Memfault’s features by default.

February 2023

Memfault Support for RISC-V on ESP32-C3 Devices

Memfault now supports RISC-V on ESP32-C3 devices. By following the steps in the ESP32 ESP-IDF integration guide, you will be able to integrate the Memfault Firmware SDK into a system that is using the ESP-IDF, including the ESP32-C3 chip. The integration guide assumes you already have a working project/toolchain for the ESP32. If you do not, the official getting started guide is a great resource.

January 2023

Including Linked Devices in the Search Results

With the introduction of the Linked Device Search feature, users can not only list the devices returned by search results, but also the devices that are linked to those devices. This is helpful when defining a population of devices (both primary and linked) before performing follow-up tasks such as assigning them to a specific Cohort, describing a new Device Set or assigning Fleet Sampling Resolutions and while doing so preventing any discrepancies (e.g. linked device staying in the old Cohort while the primary device is moved to a new one). Improvements to the Device Details page will also allow users to easily inspect the configuration states and update the Fleet Sampling Resolutions of both devices.

December 2022

Fleet Sampling

As your fleet grows, it becomes more costly to send, process and store the data from all devices in growing fleets. With the Fleet Sampling feature, Memfault helps manage the costs for your device data bandwidth by only collecting diagnostics and performance data from a smaller, yet statistically significant, subset of a fleet that you can control at any time.

Thanks to Chart Normalization, all insights to understand issues occurring across your fleet will still be at your disposal even when a only smaller number of devices are reporting from the field. For more information, please refer to the Fleet Sampling documentation.

Best Practices: Low-Bandwidth Devices

Memfault was built from the ground up to handle devices with limited bandwidth, intermittent connectivity, and minimal processing power capabilities. Following the guidelines and code examples in the recently published Using Memfault with Low-Bandwidth Devices article, IoT operators can save on network costs and lower the power consumption of their devices.

November 2022

Debug Devices with Custom Data Recordings

Memfault’s new Custom Data Recordings (CDRs) allow devices to send any custom data for specific events or periods at arbitrary times. Memfault’s Device Timeline shows these recordings grouped by their user-defined reason in relation to the existing debug information, such as metrics, logs, traces, or reboots to provide even more detail about the state a device was in at a given moment.

The underlying data of CDRs can be of any format and is accessible for download for further analysis outside of Memfault. This allows devices to send vendor-specific or proprietary debug data from their sub-components. Via the Memfault CLI, one can also augment the device timeline with data captured outside of the device (e.g. reports for hardware-in-the-loop tests).

October 2022

Best Practices: Tracking Battery Life

Two of the most important IoT reliability metrics are the expected and the actual battery life for devices. Understanding and predicting trends for battery life and detecting regressions with thousands to millions of devices in the field is a challenging problem that Memfault recently published advice and product improvements for.

The combination of metric charts, device timeline, and the recently added documentation with code samples help with understanding battery life of MCU, Linux or Android devices.

September 2022

Linux SDK 1.0 with Coredump support

Memfault's Linux SDK reached version 1.0 when introducing support for Coredumps: In the event of a crash of any process on the system, memfaultd produces a memory dump that will be uploaded to Memfault for further processing to allow for detailed debugging across the fleet. Together with the already existing support for OTA, metrics, and reboot reasons, Memfault now offers all its essential features on Linux devices!

The documentation of Memfault’s Linux SDK was extended even further to explain the integration steps as well as the growing number of configuration options.

August 2022

Linux SDK 0.3.0 – Metrics and Diagnostics Data

Memfault's Linux support reaches another milestone: Devices can now report metrics and diagnostic data to measure the success of software updates (OTA) and to proactively diagnose anomalies before users even experience their effect. The Memfault Linux SDK 0.3.0 ships with a configurable set of plugins for collectd to obtain standard KPIs at the operating system level (e.g. available storage or RAM, CPU utilization, or network status and traffic). You can also use the SDK to collect product-specific custom metrics via statsd.

When sent to the cloud, all telemetry data is being processed and distilled to fleet-wide time-series metrics (e.g. "was there an uptick in avg. CPU usage since the last version?"), device attributes (e.g. “which devices at site B ran for more than 6 months already without reboot?"), and detailed per-device insights via the Timeline UI (e.g. “are there any anomalies on the network traffic that correlate with crashes reported for this device?").

Combined with Memfault's alerting feature, operating your fleet of Linux devices is now easier than ever!

Improved Device Timeline

Memfault’s Device Timeline provides a view for each device’s metrics, reboots and crashes to make debugging easier. With the recent performance improvements, Device Timeline now renders considerably more time-series metrics simultaneously and expandable “Panels” group relevant metrics together for ease of use (see Value History, Foreground, Longwakes below).